Article Text

Abstract
Objective To determine the effect of statistical correction for intra-individual variation on estimated urinary iodine concentration (UIC) by sampling on 3 consecutive days in four seasons in children.
Setting School-aged children from urban and rural primary schools in Harbin, Heilongjiang, China.
Participants 748 and 640 children aged 8–11 years were recruited from urban and rural schools, respectively, in Harbin.
Primary and secondary outcome measures The spot urine samples were collected once a day for 3 consecutive days in each season over 1 year. The UIC of the first day was corrected by two statistical correction methods: the average correction method (average of days 1, 2; average of days 1, 2 and 3) and the variance correction method (UIC of day 1 corrected by two replicates and by three replicates). The variance correction method determined the SD between subjects (Sb) and within subjects (Sw), and calculated the correction coefficient (Fi), Fi=Sb/(Sb+Sw/di), where di was the number of observations. The UIC of day 1 was then corrected using the following equation:
Results The variance correction methods showed the overall Fi was 0.742 for 2 days’ correction and 0.829 for 3 days’ correction; the values for the seasons spring, summer, autumn and winter were 0.730, 0.684, 0.706 and 0.703 for 2 days’ correction and 0.809, 0.742, 0.796 and 0.804 for 3 days’ correction, respectively. After removal of the individual effect, the correlation coefficient between consecutive days was 0.224, and between non-consecutive days 0.050.
Conclusions The variance correction method is effective for correcting intra-individual variation in estimated UIC following sampling on 3 consecutive days in four seasons in children. The method varies little between ages, sexes and urban or rural setting, but does vary between seasons.
- intraindividual
- urinary iodine concentration
- shool-aged children
- statistical correction
This is an Open Access article distributed in accordance with the Creative Commons Attribution Non Commercial (CC BY-NC 4.0) license, which permits others to distribute, remix, adapt, build upon this work non-commercially, and license their derivative works on different terms, provided the original work is properly cited and the use is non-commercial. See: http://creativecommons.org/licenses/by-nc/4.0/
Statistics from Altmetric.com
Strengths and limitations of this study
Children's urinary iodine concentration (UIC) results were corrected using the variance correction method, indicating this method could be used for different populations.
The correcting coefficient (Fi) within seasons, ages, sexes and setting (urban or rural) was compared to the cut-off value, which demonstrated that except for seasons, there were no obvious differences between ages, sexes and settings.
The correlation coefficient (r) of urinary iodine between non-consecutive and consecutive days was weak after the individual effect was removed from the measurements.
More tests of adults, pregnant women, lactating women and infants should be conducted in the future.
Whether the UIC corrected by two or three replicates is able to represent individual iodine nutrition level should be further tested.
Introduction
Iodine is an essential component of thyroid hormone synthesis.1–3 Children with inadequate thyroid hormone production have an increased risk of developing neurological disorders and mental retardation.4 ,5 Over the last two decades, the prevalence of iodine deficiency disorders has decreased worldwide due to the implementation of universal salt iodisation.6 However, there are 246 million school-aged children globally with insufficient iodine intake.7 In China, iodine deficiency disorders are still a public health problem in remote areas.8 Urinary iodine concentrations (UIC) are measured to assess the iodine nutrition status of populations; children are the preferred subjects because of their easier access.9 ,10 The median UIC is considered to be a valid biomarker of a population's iodine status. However, defining iodine status at an individual level remains challenging as UIC varies between days and from hour to hour.11 The UIC measured in a single spot urine sample varies greatly from day to day within individuals. This variation increases the spread of the distribution such that it does not reflect the range of long-term or ‘usual’ iodine status around the median in a population.12 ,13 Previous research investigated the intra-individual variation of UIC in older non-Indigenous Australians living in an urban iodine-deficient area. The report concluded that ‘the addition of information about intra-individual variability has potential for increasing the interpretability of UIC data collected to monitor the iodine status of a population’.14 Older residents were investigated in that study, but they are not a population usually surveyed in the field compared to children as studied in this report. Besides, in this study, three spot urine samples collected separately on three consecutive days were obtained in four seasons to determine the effect of statistical correction for intra-individual variation on estimated UIC in children. In addition, the differences between seasons, ages, sexes and settings (rural or urban) were also examined.
Methods
Subjects
Research approval was obtained from the Ethics Committee of Harbin Medical University. Written consent was obtained from the children's parents. Shangzhi primary school was selected as the Harbin urban survey location. Three other primary schools in Dancheng village, Zhoujia village and Xinxing village affiliated to Shuangcheng county of Harbin city were chosen as the rural survey locations. Harbin is a geologically low-iodine district of China where more than 80% of the residents’ iodine intake comes from iodised salt.15 The research recruited healthy children aged 8–11 years with no recent use of iodine-containing multivitamins, food supplements or medicines before the survey. For each type of location, urban or rural, at least 500 students were required as the variation in median UIC will be less than 5% when the sample size is above 485.12 From June 2011 to March 2012, the school-based investigations in the four survey locations were conducted in each season of the year (in June, September and December 2011 as well as in March 2012). The spot urine samples were collected from all participants once a day for 3 consecutive days. Individuals were excluded if they did not provide urine samples for 3 consecutive days in one season.
Assays
Urine samples were kept in disposable polyethylene tubes and stored in deep freezers until analysis. UIC was measured by the modified acid digestion method by As3+−Ce4+ catalytic spectrophotometry based on the Sandel-Kolthoff reaction.16 ,17 A standard substance with a known concentration from the National Iodine Deficiency Disorders Reference Laboratory was used for quality control.
Statistical analysis
SPSS software (V.21.0) was used for statistical analysis. The UIC data were transformed using the square root to improve normality. The UIC was presented first as the UIC of day 1 followed by the results of two correction methods: the average correction method (average of days 1, 2 and average of days 1, 2 and 3) and the variance correction method (UIC of day 1 corrected by two replicates and UIC of day 1 corrected by three replicates). The average correction method was used to calculate the average UIC for days 1, 2 and days 1, 2 and 3. The variance correction method had a conceptual underpinning: the variance of the observed UIC could be divided into two parts, that is, Vobserved=Vbetween+Vwithin. The Vobserved was the distribution of UIC for a group based on 2 or 3 days of UIC data, which included Vbetween (variance between subjects) and Vwithin (variance between two or three repeated measurements within a subject). The correction coefficient (Fi) for each child was computed as: 1
1
where Sb is the SD between subjects, Sw is the SD within subjects, and di is the number of observations available for each subject (two or three).
For each child, the corrected urinary iodine value was computed as: 2
2
Each group of UIC data was calculated for the 5th, 10th, 25th (lower quartile), 50th (median), 75th (upper quartile) and 95th percentiles. All p values were two-sided and significance was defined as p<0.05. The raw correlation coefficient (r) was calculated between different days. The correlation results after removal of the individual effect of the measurements are more meaningful. Supposing that Yij denotes the observed UIC for the ith child on the jth spot sample, and suppose that m denotes the overall mean and ai is the effect of the ith child, it can be assumed that 3
3
In the equation, ρ denotes the correlation of iodine values between consecutive days, after removal of the effect of the child. The model assumes that the correlation between non-consecutive days is ρ2. Next, two linear contrasts can be defined: 4
4
To estimate ρ under the model, a direct estimate can be obtained by solving for ρ using the equation below with the two variances by the empirical estimates: 5
5
Evaluation standard
The iodine nutrition criteria recommended by the WHO for children are as follows: deficient, median UIC of <100 μg/L; adequate, median UIC of 100–199 μg/L; more than adequate, median UIC of 200–299 μg/L; and excessive, median UIC of ≥300 μg/L.17 As Fi was varied from 0 to 1 and there was no standard available to evaluate Fi, we adopted the cut-off value of correlation coefficient (<0.4, weak correlation; 0.4–0.7, medium correlation; >0.7 strong correlation) to evaluate Fi.
Results
Children who had recently consumed iodine-containing multivitamins, food supplements or medicines before the survey were excluded from the analysis. In total, 1388 children aged 8–11 years were selected for the study, consisting of 748 from the urban setting and 640 from rural settings. A total of 1296 children were enrolled in the study after the exclusion of urinary samples from students who were absent for one or more of the 3 consecutive days in one season. Of these children, 716 lived in an urban area and 580 in rural areas. There were 667 boys and 629 girls of whom 234, 462, 391 and 209 were aged 8, 9, 10 and 11 years old, respectively. Urine samples were collected from 1199, 897, 984 and 928 children in June, September and December 2011 and March 2012, respectively. The distribution of UIC and the corrected results are shown in figure 1 and table 1.
Urinary iodine concentration distribution of raw data for days 1, 2 and 3, and for day 1 corrected by the average correction method and by the variance correction method
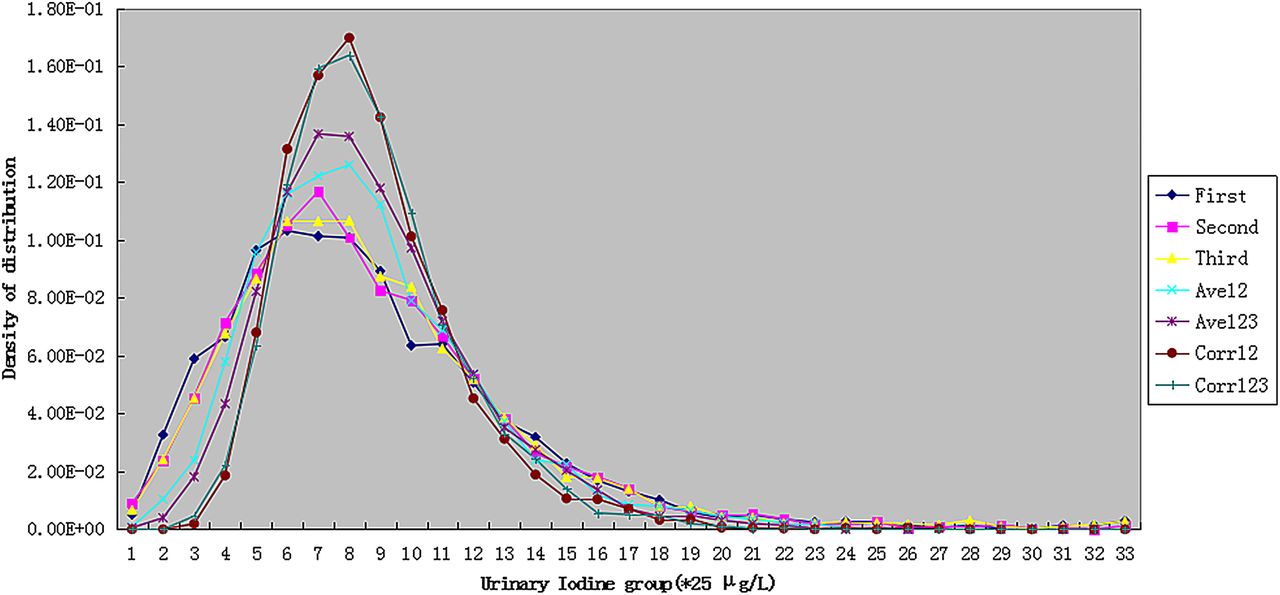
Population distribution of urinary iodine, according to the number of days of spot urine collection.
Ave12, UIC (urinary iodine concentration) of day 1 corrected by average of days 1, 2; Ave123, UIC of day 1 corrected by average of days 1,2,3; Corr12, UIC of day 1 corrected by two replicates; Corr123, UIC of day 1 corrected by three replicates.
The median UIC (range quartile) for day 1 was 183.1 µg/L (122.6–262.0 µg/L); when corrected using the average correction method, it was 188.5 µg/L (138.0–253.4 µg/L) for days 1, 2 and 192.6 µg/L (146.4–250.3 µg/L) for days 1, 2 and 3. When corrected by the variance correction method, Fi was 0.742 by two replicates and 0.829 by three replicates, and the median UIC was 192.3 µg/L (155.4–239.2 µg/L) and 194.8 µg/L (156.3–241.6 µg/L), respectively. Although Fi was different between two and three replicates, the median UIC was very similar. These findings showed that the iodine intake of the children was adequate based on the WHO iodine nutrition criteria (100–199 µg/L) and the median UIC increased with the number of corrected days for both correction methods.
The raw correlation coefficient (r) of UIC for different days was analysed. For day 1 and day 2, r=0.347; day 1 and day 3, r=0.233; day 2 and day 3, r=0.308. For day 1 and the average of days 1, 2, r=0.831; day 1 and the average of days 1, 2 and 3, r=0.729; day 2 and the average of days 1, 2, r=0.810; day 2 and the average of days 1, 2 and 3, r=0.746; day 3 and the average of days 1, 2, r=0.326; day 3 and the average of days 1, 2 and 3, r=0.711. The correlation between day 1 and day 1 corrected by two replicates was r=0.833; the correlation between day 1 and day 1 corrected by three replicates was r=0.729. These results described a weak correlation between different days, and a strong correlation between day 1 and the average data, and between day 1 and variance corrected data. Furthermore, after removing the individual effect from the measurements, according to equation 5, ρ=0.224, ρ2=0.050, that is, the r of UIC between consecutive days was 0.224, while the r of UIC between non-consecutive days was 0.050, and both were in weak correlation and lower than the r of raw correlation, demonstrating that the individual effect existed but was rather weak.
From the distribution of UIC in figure 1, compared with the raw data, it can be seen that the distribution of UIC after correction by the different methods was changed. The curve transformed from a right-skewed distribution to an approximately normal distribution, and was smoother. When corrected by two or three replicates, the shape of the two curves was closer to being normalised. For correction by three replicates, the skewness of the curve was smaller (1.127) compared to day 1 (1.545), and the kurtosis was also smaller (2.392) than for day 1 (4.348).
Different seasons
The UIC medians (day 1 and two correction methods) for different seasons were all at an adequate level except that for autumn, which was above adequate as shown in table 2.
Urinary iodine seasonal distribution: raw data for day 1, and for day 1 corrected by the average correction method and by the variance correction method
Fi was different in different seasons. In spring, summer, autumn and winter, the values were 0.730, 0.684, 0.706 and 0.703 for two replicates, and 0.809, 0.784, 0.796 and 0.804 for three replicates, respectively. Summer had the lowest Fi, and spring had the highest. Based on the cut-off value (0.7), summer had different Fi for two replicates compared to the other seasons. In figure 2, the distribution of UIC for day 1 is presented by each of the four seasons: spring was similar to summer, and autumn was similar to winter concerning the shape of the curve, while summer had the smallest UIC median compared to the other seasons.

The children's urinary iodine distribution on day 1 for different seasons.
Different ages
The median UIC was adequate for the different age groups, except for the 11-year-old group, which the various correction methods showed had a level slightly above 200 µg/L (table 3).
Urinary iodine distribution by age: raw data for day 1, and for day 1 corrected by the average correction method and by the variance correction method
Fi did not differ much among children aged 8, 9, 10 and 11: calculated by two replicates and three replicates, for children aged 8, it was 0.740 and 0.832; for children aged 9, 0.755 and 0.842; for children aged 10, 0.725 and 0.820; and for children aged 11, 0.814 and 0.829, respectively. Based on the evaluation standard, all Fi values were above 0.7, with no difference found between them.
Different sexes
For different sexes of the children, the medians of different groups were all at adequate levels (table 4).
Urinary iodine distribution by sex: raw data for day 1, and for day 1 corrected by the average correction method and by the variance correction method
The median UIC of boys was near the upper limit of the adequate level. Fi values did not vary much as all were above 0.7, and were 0.749 and 0.839 for boys and 0.739 and 0.830 for girls, for two and three replicates, respectively.
Different settings
The UIC medians of children calculated using different correction methods were different for different settings (urban and rural). For the rural group, most of the UIC medians were above adequate, while for the urban group, values were all adequate (table 5).
Urinary iodine distribution by city or village, raw data for day 1, and for day 1 corrected by the average correction method and by the variance correction method
No obvious difference between different groups was found for Fi in the urban (0.748 and 0.833) compared to the rural (0.744 and 0.828) groups.
Discussion
In previous research, samples were taken once a week over 3 weeks,14 while in our study, samples were taken on three consecutive days. Obviously, subject attendance rate will be better using our method compared to sampling over 3 weeks because parents usually know their child's iodine intake (iodine-containing vitamins, food iodine supplementation and medicine) before the investigation and their child's school attendance in the coming 3 days. In addition, an investigation over 3 days is easier to conduct regarding preparation, investigators’ travel and accommodation needs, and sample preservation. Comparing to three weeks' correction, the 3 days’ variance correction method also had satisfied correction effect compared to the 3-week method. However, the children's iodine intake may have been influenced by the survey, particularly as urine iodine is determined by food consumption during the previous 24–36 h. If the results were independent, appropriate correction would be carried out using the subset of children with either two or three replicates and estimating the within and between sample variance. In this study, a similar analysis method which was slightly different from the former approach14 was used to compare the results. In the previous study, the authors investigated community-dwelling older adults in New South Wales, Australia.14 In our study, the UIC of children in Harbin in China was tested to see if it could be adjusted by this method, which would indicate that the method was feasible and could be used in different populations. Although children are the most surveyed subjects in iodine deficiency disorder monitoring due to their accessibility, their food needs differ from those of older adults.18 Instead of the log transformation method,14 we adopted a square root transformation method to guarantee the normality of UIC distribution in children. The Fi of our research was 0.742 and 0.829, similar to their results of 0.79 and 0.83; the difference was small and might have been caused by population differences. If Fi approaches 1, then the corrected UIC for 1 day (day 1) is near the long-term UIC tendency.19 ,20 Our study included the Fi of different seasons, ages, sexes and settings to determine if it was different for various population subsets. The results showed that age, sex and setting subsets make little difference, whereas season has an important influence on Fi. In the previous publication, the median UIC of different seasons was also different.21 ,22 In summer, fruits and vegetables are more abundant and the diet is more diverse, which may reduce the consumption of food cooked with iodised salt, and cause a decrease in urinary iodine. In addition, physical activity, water consumption and sweat production are all increased, which reduces UIC and decreases Fi, that is, the 1-day UIC is less representative of the long-term tendency. In contrast to the above-mentioned study, the distribution curve of the UIC corrected by 3 days had a lower peak than when corrected by 2 days, and from the results, the 3 days’ correction was similar to the 2 days’ correction. This suggests that the two corrections differ little, which could be explained by the correlation coefficients of UIC between non-consecutive days and consecutive days obtained after removing the individual variances, being both just weakly correlated. According to the reference, when the sample size is above 485, the median UIC of the population will have a precision of above 95% compared to a 24 h urinary iodine determination.12 As our sample size was above 485, the error of the median UIC would be below 10 µg/L, which fit well with the difference between the median UIC of day 1 and the median UIC of the corrected groups.
Although this study improved a previous method and applied it to a different population, more tests of other populations should be carried out in the future. These populations should include adults, pregnant women, lactating women and infants. Our method corrects the population distribution of the UIC, so whether it can determine individual iodine nutrition should be tested. One study suggested that 10 spot urine samples or 24 h urine samples were necessary to assess individual iodine status with 20% precision.23 Another reported showed that in a non-fasting state, the middle-morning UIC was more stable from day to day in a single subject, depending on their eating habits, than in various subjects. Thus, a single urine sample even in the non-fasting state may provide rough information about an individual's iodine status.24 Spot samples would likely be preferable because of their ease of collection. However, the large number of repeated urine samples needed to estimate individual iodine status is a major limitation and emphasises the necessity of further investigation on more practical bio-markers for measuring individual iodine status. In the future, 24 h urinary iodine should be sampled simultaneously to confirm this variance correction method.
Conclusion
In conclusion, the variance correction method can be used in children, who are the most accessible subjects for iodine deficiency disorder surveys. There are small differences between ages, sexes and urban or rural populations, but large difference between seasons. Compared to sampling three spot urines, each 1 week apart, sampling on 3 consecutive days is more feasible for a field survey as the attendance rate will be higher. For children's UIC, the square root transformation shows better normality than log transformation. Concerning the variance correction method, the UIC of day 1 corrected using two replicates differs little from that corrected using three replicates.
Acknowledgments
The participation of all children in the study is gratefully acknowledged. We also thank the staff of Harbin Center for Disease Control and Prevention for their field work.
References
Footnotes
XHJ and PL are first authors and contributed equally.
Contributors PL and XHJ wrote the manuscript, XHS and YHG designed the study and organised the field survey, ZQS and WW determined the iodine in urinary samples, and DJS had primary responsibility for final content. All authors have read and approved the final manuscript.
Funding This work was supported by grants from the Technology and Education Department of the Ministry of Health, China, grant number 201202012.
Competing interests None declared.
Patient consent Obtained.
Ethics approval The Ethics Committee of Harbin Medical University approved this study.
Provenance and peer review Not commissioned; externally peer reviewed.
Data sharing statement No additional data are available.