Article Text

Abstract
Objectives In 2014/2015, 46% of community pharmacies were commissioned by local authorities to provide emergency hormonal contraception (EHC) free without prescription in England. Commissioning EHC services influences EHC prescribing from General Practice (GP)—greater community pharmacy provision reduces GP prescribing. This study aimed to examine predictors of GP and pharmacy EHC activity, describing them using path analysis. From this, commissioners and policy-makers may understand ways to influence this.
Study design Cross-sectional study of routinely recorded data, obtained through freedom of information requests to local authorities.
Setting Community pharmacies and general practices in England, UK.
Participants All local authorities in England were included in the study (147 areas). The study population were all girls, adolescents and women aged 12–55. Of the 147 areas, data from 80 local authorities were obtained covering an eligible female population of 9 380 153.
Primary and secondary outcome measures Correlation between community pharmacy and GP EHC activity.
Results Data from 80 local authorities were analysed, representing 60% of the eligible female population in England. A significant negative correlation was found between rates of community pharmacy provision and GP prescribing (−0.458, p<0.000). Community pharmacy provision and the proportion of pharmacies commissioned were significantly correlated (0.461, p<0.000). A significant correlation was found between increased deprivation and community pharmacy provision (0.287, p=0.010). Standardised total effects on GP prescribing were determined from path analysis including community pharmacy provision (ß=−0.552) and proportion of pharmacies commissioned (ß=−0.299). If all community pharmacies were commissioned to provide EHC, GP EHC prescriptions could decrease by 15%.
Conclusion Community pharmacy EHC provision has a significant influence on GP EHC prescribing. Increasing the proportion of commissioned community pharmacies should have a marked impact on GP workload. The methodology affords the possibility of examining relationships surrounding other commissioned service activity across different settings and their impact on linked care settings.
- REPRODUCTIVE MEDICINE
- PUBLIC HEALTH
- PRIMARY CARE
- Health policy
Data availability statement
No data are available.
This is an open access article distributed in accordance with the Creative Commons Attribution Non Commercial (CC BY-NC 4.0) license, which permits others to distribute, remix, adapt, build upon this work non-commercially, and license their derivative works on different terms, provided the original work is properly cited, appropriate credit is given, any changes made indicated, and the use is non-commercial. See: http://creativecommons.org/licenses/by-nc/4.0/.
Statistics from Altmetric.com
Strengths and limitations of this study
This study presents a novel methodology for evaluating the impact of primary care commissioned services, within a complex healthcare system.
This study uses routinely collected data that make the study and future work amenable to replication.
Due to the local commissioning process, the conclusions are not necessarily applicable beyond the geographical area studied.
It was not possible to independently verify the accuracy of the freedom of information data received, but the data supplied to local authorities was subject to contractual obligation for accuracy and routine audit.
Introduction
Unplanned pregnancies are associated with an increased risk of adverse outcomes, the incidence increasing with deprivation.1 2 In 2020, 200 083 girls, adolescents and women had terminations in England, the highest number on record.3 Girls, adolescents and women in the most deprived areas were more than two times as likely to have a termination than those in the least deprived.3 Meeting unmet contraceptive needs is therefore a key objective of UK public health policy.4 5
Within the UK, emergency hormonal contraception (EHC) can be obtained primarily from family planning clinics, GP surgeries and community pharmacies. EHC is free of charge from both family planning clinics and GP surgeries, but unless specifically commissioned (contracted) it must be purchased from community pharmacies. Community pharmacies can sell EHC to girls, adolescents and women, in line with the product license, without referral from another healthcare practitioner.
There is a known inverse relationship between healthcare access and deprivation.6 Deprivation is a measure of various population health and social needs, measured through several domains including income, employment, crime and health deprivation. This inverse relationship has been compounded by the COVID-19 pandemic, which has widened health inequalities, with implications for general practice capacity to meet demand in deprived areas (ie, low socioeconomic areas).7 Studies have demonstrated lower rates of diagnosis and treatment commencement in general practice particularly in areas of high deprivation, because of the pandemic.7 8 This is likely to translate into increased demand for GP care for years to come, an incentive for policy-makers to identify factors influencing patient demand and determine alternative pathways to access care. Furthermore, deprivation is known to correlate to EHC need and variability in access.9–11
Unlike healthcare in the UK more generally, community pharmacy has been shown to exhibit the ‘positive pharmacy law’; access to community pharmacy care in England is greater in areas of greater deprivation. Accordingly, understanding influences on community pharmacy care and access may support action to tackle health inequalities in deprived areas. In particular, understanding factors that influence uptake of care (eg, EHC) in community pharmacy opens avenues to proactively change patient pathways.
The price of EHC is a barrier to access, particularly for younger girls, adolescents and women; studies have found that only 20% of under 20 year olds reported being willing or able to purchase EHC.12 Local authorities (local government) in England can commission community pharmacies to provide EHC free of charge (without a prescription). There is no common understanding of the factors influencing commissioning by local authorities or EHC provision community pharmacies. Although access to community pharmacies is greater in areas of higher deprivation, there is no literature indicating that EHC provision is greater.
Where commissioned, data are routinely collected by commissioners, primarily for payment purposes. Previous studies have demonstrated that there is no difference in the advice provided, clinical outcomes or adherence to treatment guidelines between community pharmacy and GP surgeries in EHC provision.12 Furthermore, the introduction of EHC services into community pharmacy decreases GP prescribing rates by approximately 41%, without influencing family planning clinics or accident and emergency (A&E) departments.13 This finding was limited to a small rural area, but a relationship between community pharmacy and GP EHC provision is nevertheless evident.13 Other research has demonstrated this correlation between increased community pharmacy EHC provision and decreased GP EHC prescribing across England.14
In 2015, it was found that 97% of English local authorities commissioned an EHC service from community pharmacies.15 However, the number of pharmacies within an area commissioned to provide the service varied from 4% to 99%.15 Nationally, only 47% of community pharmacies provide EHC services.15 This inconsistent provision plays a role in EHC prescribing from GP surgeries.14 16 17
Relationships between linked care settings, such as GP surgeries and A&E, have been identified previously.18 19 For example, the size of a GP patient list, the distance from hospital and the ability for patients to see or speak to a GP/nurse, have all been found to correlate to hospital attendance rates.18 19 By quantifying the relative strengths of the variable associations, priorities can be determined in service design and commissioning frameworks. Path analysis is like multiple regression but allows for numerous dependent variables to be considered at once as well as describing the inter-relationships between them. Path analysis is particularly useful for understanding the competing variables in a health system, an approach not yet applied to community pharmacy services. For example, path analysis can attempt to determine how the location of services, rurality or impact of social factors influences service uptake and outcomes.20 Path analysis also provides an indication of indirect relationships, that is, the association variable A, may have on variable C through its impact on variable B.
This study aimed to examine predictors of GP and pharmacy EHC activity, before using path analysis to detail relationships between variables. From this, possible ways to influence this relationship may found, to support policy-makers and commissioners in their decisions. In particular, ways to increase community pharmacy EHC provision, therefore decreasing GP EHC prescribing, will support efforts to reduce GP workload.
Methods
Study design
This study is a cross-sectional study using routinely collected data. To determine the relationship between community pharmacy and GP settings, routinely collected EHC data (the number of EHC provisions without prescription from commissioned community pharmacies and GP prescriptions) were obtained through freedom of information (FOI) requests. Community pharmacy EHC provision data are submitted to local authorities for the purpose of audit and payment, usually via an electronic clinical record system. Depending on the exact nature of the commissioned service, this may include data on the consultation and may or may not be anonymised. For the study, no individual patient data were requested or collected. Pharmacy sales of EHC are not included in the data set.
The FOI requests included a request for unique identifiers, with a preference for the unique National Health Service (NHS) code used by NHS payment authorities. Where NHS codes were provided by local authorities, these were matched with the public NHS data sets. Where unique NHS codes were not provided, manual comparison of pharmacy trading names and addresses was used to determine the NHS code.
In England, 327 potential local authority commissioners of community pharmacy services were identified from the National Office of Statistics dataset.21 Between March and April 2020, all local authorities were sent an FOI request for data held on EHC provision from community pharmacy commissioned services in the financial year 2017–2018. This period was chosen to include a complete year (with seasonal variation), while allowing for postpayment verification.
Community pharmacy data were provided for local authority boundaries, whereas GP data were obtained for clinical commissioning group (CCG) boundaries. National data sets compare the geographical boundaries of CCGs and local authorities, indicating the proportion of the areas that match. Following data collection, areas were compared with identify coterminus geographies. The female populations aged 12–55 for each local authority were determined from Office of National Statistics data, and the rates per 10 000 population were determined. The data were collected in Microsoft Excel, before transfer to IBM SPSS V.24 for further analysis.
Patient and Public Involvement
Patients and the public were not involved in the design, reporting or dissemination of the research.
Variables
The rate of GP EHC prescriptions per 10 000 female population (aged 12–55) was the dependent variable (termed from here on as the GP rate). GP prescribing data were obtained from openprescribing.net, an open source website.16 The primary independent variable was the rate of commissioned community pharmacy free of charge EHC provisions per 10 000 female population (aged 12–55) (termed from here on as the Ph rate).
The total number of pharmacies was obtained from local authorities, distance selling pharmacies (online pharmacies) were excluded from the analysis. Covariates, including indices of deprivation (specific measures of relative deprivation), local authority rurality and Sexual and Reproductive Health Activity Data Set (SRHAD) data, were identified and mapped to local authorities. The SRHAD database includes data of community based sexual and reproductive healthcare services. A full list of the variables is presented in table 1.
Identified variables
Data analysis
The data were reviewed, and outliers removed through the plotting of boxplots and removal of data points outside 1.5 times the IQR from the 1st or 3rd quartile. Linear regression determined the correlation between Ph rate and GP rate. Bivariate correlations were calculated between both variables and the covariates identified from the literature. This included the individual measures contained within the Index of Multiple Deprivation, as well as local authority rurality which is defined by the Office of National Statistics, and measured on a scale from 1 (major urban) to 6 (at least 80% of the population in rural settlements).22 Correlations were also calculated for the proportion of community pharmacies commissioned to provide the service within each local authority and the rate of EHC prescribing (per 10 000 12–55 female population) from the SRHAD dataset.17 Multiple regression modelling was completed to indicate the relationship between covariates and GP rate.
Finally, SPSS Amos V.27 Graphics was used to create a path analysis. A series of co-variables correlating to EHC access have been reported in the literature.9 12 23 A theoretical model was constructed of known and quantifiable variables using data obtained and national data sets, guided by the literature. Path analysis presents both standardised and unstandardised rates, with unstandardised rates being less subject to sample variance.24 Standardised rates (ß) are standardised to have a mean of 0 and an SD of 1, allowing direct comparison to determine the relative strength of relationships. Standardised rates are presented here, as these are more easily compared and interpreted.24
Results
Data response rate
FOI responses highlighted the complexity of local authority commissioning, with several county councils commissioning on behalf of numerous smaller district councils. A review of commissioners resulted in 147 local authorities who commissioned public health services within England. Of these 147, 113 (76.9%) responded to the FOI requests, 5 of which confirmed there was no EHC service commissioned from community pharmacy. To protect confidentiality, data were aggregated by local authority, and local authority identifiers removed. This is set out in figure 1.
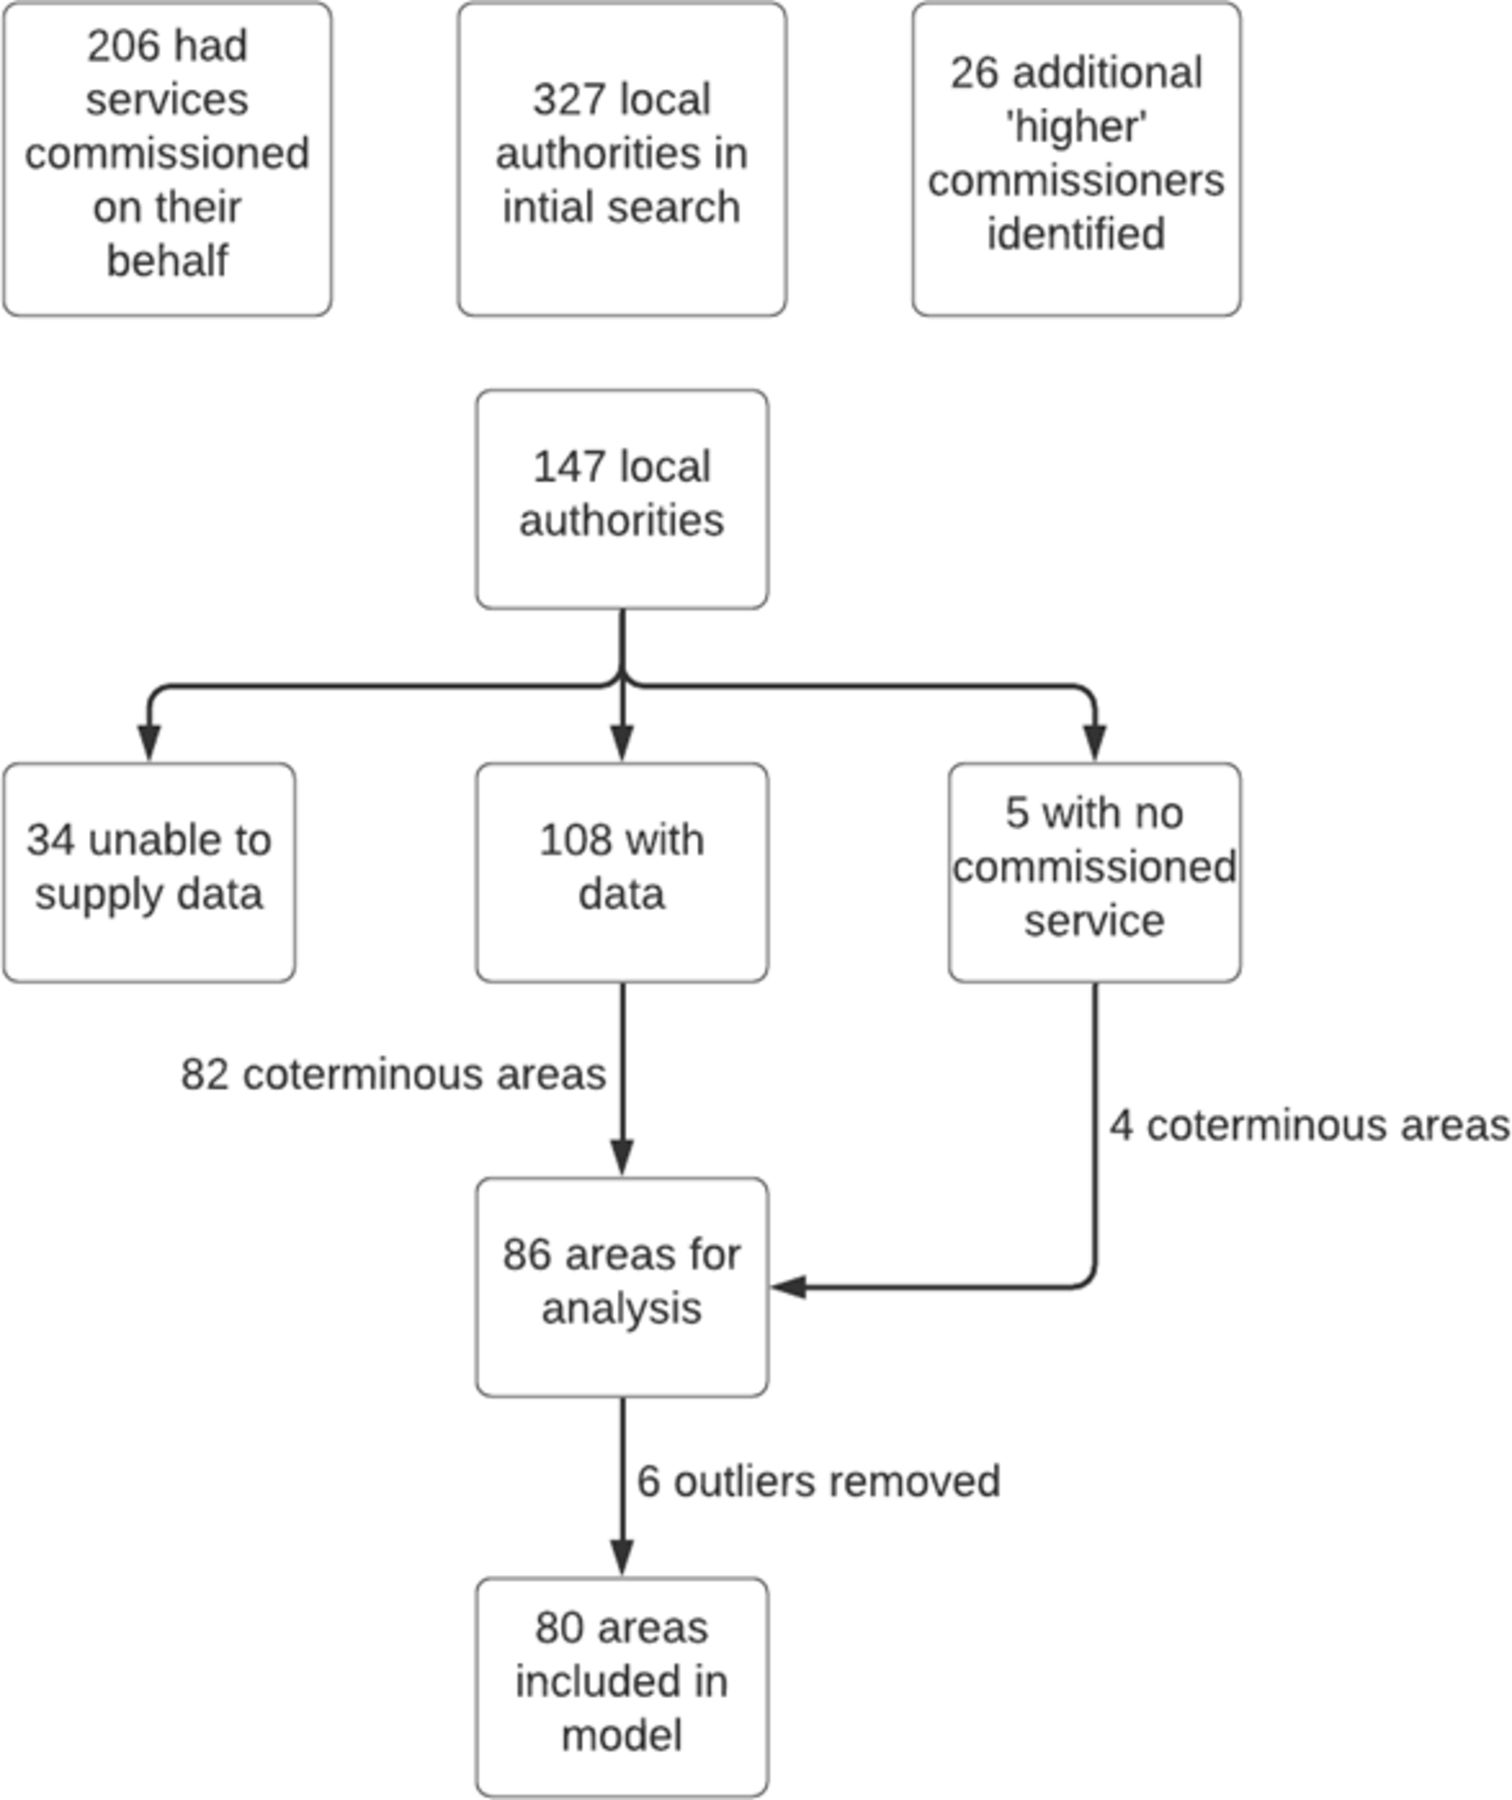
Data collection and mapping of local authorities.
Data preparation
The local authority boundaries were compared with CCG boundaries, using nationally available data.25 The Office of National Statistics compare CCG and local authority geographies.26 Areas with 95% or greater overlap were considered coterminus, resulting in 86 areas for analysis. This refined data included 207 731 community pharmacy EHC provisions and 82 822 GP prescriptions. Using population estimates, the rates of provision per 10 000 female population aged 12–55 were calculated.27 This provided two key variables, Ph rate (number of EHC supplies made by community pharmacies via a commissioned Local Authority service/10 000 female population) and GP rate (number of prescriptions recorded for EHC from GP surgeries/10 000 female population).
The data related to an estimated total female population (aged 12–55) of 9 380 153 (local authority mean 109 072, SD 83 899). This data reflected 60% of the eligible English female population (aged 12–55) and 59% of all English local authorities. No additional data available.
Identifying variables and correlations
Outliers were removed following a review of the data. Ph rates above 600 (n=7) and GP rates above 130 (n=6) were removed. This left 92.5% of the data for analysis. The mean Ph rate was 200.2 (SD 154.9) and the mean GP rate 79.3 (SD 26.3). Linear regression demonstrated a negative correlation between Ph rate and GP rate (figure 2). The R2 value was determined to be 0.21, indicating the Ph rate accounts for 21% of variance in the GP rate and 79% being due to other factors.

Linear regression of General Practice emergency hormonal contraception (EHC) prescribing rate (per 10 000 female population) and community pharmacy EHC provision rate (per 10 000 female population).
Bivariate correlations were undertaken between the GP rate and Ph rate, and all available covariates identified within the literature. Statistically significant correlations are highlighted in table 2. The GP rate was significantly correlated with Ph rate (−0.458, p=0.000) and the Living Environment Deprivation Domain (0.241, p<0.05). The largest correlation was between the Ph rate and the proportion of community pharmacies commissioned (0.461, p=0.000).
Bi-variate correlations
A multiple linear regression was calculated to predict the GP rate from significantly correlated variables. Backwards regression was used to construct a model with three dependent variables. A significant regression equation was found (F (3,67) =15.380, p<0.00), with an R2 of 0.408. The adjusted R2 value was 0.381. This predicted that the GP rate is equal to 59.132±0.092×(Ph rate)+3.648×(local authority rurality)+1.283×(living environment deprivation). The GP rate decreased by 9.2 for every increase in the Ph rate of 100, increased by 3.6 between increasing levels of rurality and increased by 1.3 for each point increase in the living environment deprivation.
Path analysis
The path analysis of the theoretical model (figure 3) shows the standardised squared multiple correlation (R2) value for the Ph rate (0.45) and the GP rate (0.37). These values indicate 45% of the Ph rate and 37% of the GP rate can be explained by the variables identified. Direct effects are when a variable directly relates to another, whereas indirect effects describe the effect a variable has through a third variable. Table 3 shows standardised direct, indirect and total effects on GP prescribing.

Path analysis model (standardised values shown). *Correlation is significant at 0.05 level. **Correlation is significant at 0.01 level. EHC, emergency hormonal contraception. RMSEA = Root mean square error of approximation. CFI = Comparative Fit Index. GP = General Practice. Ph = Community Pharmacy.
Standardised direct, indirect and total effects on General Practice prescribing
Direct effects
The Ph rate and living environment directly impacted on the GP rate. Greater Ph rate decreased the GP rate (ß=−0.552, p=0.000), and greater levels of living environment deprivation increased the GP rate (ß=0.435, p=0.000).
Increased proportions of EHC service commissioned pharmacies increased the Ph rate (ß=0.542, p=0.000), whereas decreasing rurality (ie, more urban) increased the Ph rate (ß=−0.262, p<0.05). All the indicators of deprivation in the model had a direct effect on the Ph rate, increasing it in the case of greater deprivation in health (ß=0.424), environment (ß=0.182), older people (ß=0.099), children (ß=0.013) and crime (ß=0.194).
Indirect effects
The relationship between the proportion of commissioned pharmacies and the GP rate was negatively mediated by the Ph rate (ß=−0.299). This was the largest indirect effect and larger than many direct effects. Rurality was positively mediated by the Ph rate, with increased rurality increasing the GP rate (ß=0.144). In addition to the direct effect, living environment has a further indirect effect on the GP rate, negatively mediated by the Ph rate (ß=−0.101). Due to the elimination of outliers, the path analysis was run with some missing data. This means indirect and total effects are estimated and significance levels are not available.
Discussion
This study demonstrates the nature of the relationship between commissioned community pharmacy EHC services and GP EHC prescribing. The main finding was a significant effect of the Ph rate on the GP rate. The regression analysis shows that increasing the Ph rate by 100 would decrease the GP rate by 9. Prior to this study, there was evidence of a relationship, but the precise nature was unclear.13 This result shows that there is a measurable significant negative correlation.
The other variable with a direct effect on GP rate is living environment. Increasing the Living Environment Deprivation Score by 10 (from lower to greater deprivation) increases the GP rate by 7. Broadly, increased deprivation increases Ph rates, but has no significant impact on GP rates, excepting living environment. This shows that socioeconomic factors play some role in EHC within general practice but these are more pronounced within community pharmacy.
The path analysis model provides further insight, first by visualising the relationships and second by showing indirect effects. Most deprivation indictors indirectly reduce the GP rate. This means that generally, in areas of greater deprivation there is more community pharmacy EHC provision and less GP EHC prescribing.
The overall model explains 37% of the variance in GP rates, even though the model is an incomplete description of EHC access (eg, it does not include sales of EHC). Research considering sociodemographic predictors often produces low R2 values.23 The higher R2 of 0.37 may be due to this model incorporating organisational factors.
The covariate with the largest correlation with Ph rates or GP rates is the proportion of commissioned pharmacies. Mackridge et al previously demonstrated no significant correlation between the proportion of community pharmacies commissioned to provide EHC services and local under 18 pregnancy rates.15 This lack of relationship was considered in isolation, without the related covariates explored here. This model considers the relationship between GP rates and Ph rates, rather than local health outcomes such as under 18 pregnancy rates. When considering the wider health system, the proportion of commissioned pharmacies appears to be an important factor in predicting patient routes of access.
A key objective of policy-makers is to both maximise access/uptake to EHC services in all areas and promote patient pathways to expand primary care capacity.5 28 It is known that community pharmacy EHC services can both decrease EHC GP prescribing and increase overall rates of EHC provision.13 However, this has only been demonstrated in a rural location. Understanding that this trend is replicated nationally, and the possible influences on this is likely of interest to commissioners and policy-makers alike.
While most local authorities commission a community pharmacy EHC service, nationally less than half of pharmacies are commissioned.15 The path analysis illustrates that increasing the proportion of EHC service commissioned pharmacies not only increases the Ph rate, but also has a further indirect effect, reducing the GP rate. Considering local health outcomes in isolation fails to account for the natural flex in healthcare provision, where alternate settings provide care in the absence of commissioning. This may explain the poor correlation between the proportion of EHC service commissioned pharmacies and under 18 pregnancy rates.15 Patient needs are met by the healthcare system, so where community pharmacies are not commissioned, alternate providers ensure local health needs are met.
The model shows organisational (pharmacy commissioning) and environmental factors (deprivation and rurality) are important in predicting GP prescribing. It does not capture individual factors, either those influencing patient choice or the specific organisational factors of GP surgeries or community pharmacies. Nor does it account for sales of EHC, a likely contributing variable. The data obtained through FoI requests could not be independently verified. However, contractual agreements between pharmacies and local authorities include requirements for accuracy, and routine audit processes to validate the information provided and subsequent payments made.
An important variable is the proportion of commissioned pharmacies. This is a proxy for access to EHC. What is not captured through this variable is the opening times of the commissioned pharmacies. These data were not available, and therefore the relationship may be further influenced by opening hours, particular extended hours.
This analysis is based on the complex commissioning landscape of England, application outside this setting should be done with care. Wales and Scotland have nationally commissioned EHC services, and future research comparing UK countries would support further understanding of this pharmacy/GP relationship.
Nevertheless, the data are representative of 60% of the eligible English female population and include 207 731 community pharmacy EHC provisions and 82 822 GP EHC prescriptions. Quantifying the relationships allows prediction of the impact if variables were changed. The proportion of EHC service commissioned pharmacies affords an opportunity for policy change. If this were increased to 100%, the mean Ph rate would increase from 200.2 to 346.4. An increase of this magnitude could decrease mean GP EHC prescribing rates by 11.7/10 000 (15%). This could equate to a total reduction across England of 20 706 GP consultations per year, without any additive increases likely from patient awareness of a national/wider service offering.
Conclusion
This study quantifies the correlation between community pharmacy EHC provision and GP EHC prescribing—increasing the Ph rate by 100, decreases the GP rate by 9. It demonstrates that increasing the proportion of community pharmacies providing commissioned EHC services increases the Ph rate and further decreases the GP rate.
It also demonstrates the place of path analysis in quantifying the influence of community pharmacy services. This approach could well be applied in numerous environments, to predict the outcome of future commissioning or changing services.
This information is likely of value to public health commissioners and policy-makers who wish to target EHC care to areas of greatest need and decrease GP workload post-COVID-19. Increasing the proportion of community pharmacies providing an EHC service, through national commissioning or other standardisation processes, will likely bring benefits to patients and local health systems alike.
Data availability statement
No data are available.
Ethics statements
Patient consent for publication
Ethics approval
Ethics approval was granted by Keele University Faculty of Medicine and Health Sciences Research Ethics Committee (MH-200114)
References
Footnotes
Twitter @nickthayer99
Contributors All authors were involved in the study design and conception. Data collection and analysis were completed by NT and MF. The first draft was written by NT and MF. NT, MF and SW contributed to the review, editing and final draft. NT acted as the guarantor.
Funding The authors have not declared a specific grant for this research from any funding agency in the public, commercial or not-for-profit sectors.
Competing interests None declared.
Patient and public involvement Patients and/or the public were not involved in the design, or conduct, or reporting, or dissemination plans of this research.
Provenance and peer review Not commissioned; externally peer reviewed.