Article Text

Abstract
Objective In the UK, families of disabled children are entitled to receive disability benefits to help meet costs associated with caring for their child. Evidence of actual costs incurred is scant, especially for mental health disability. In this study, we aimed to quantify the cost of mental and physical health disability in childhood and adolescence to families in the UK using the concept of compensating variation (CV).
Design Repeated cross-sectional survey.
Setting The UK general population
Participants 85 212 children drawn from 8 waves of the Family Resources Survey.
Outcomes Using propensity score matching we matched families with a disabled child to similar families without a disabled child and calculated the extra income the former require to achieve the same living standards as the latter, that is, their CV. We calculated the additional costs specifically associated with several definitions of mental health and physical health disability.
Results Families of a child with any mental health disability, regardless of the presence of physical health comorbidity, needed an additional £49.31 (95% CI: 21.95 to 76.67) and, for more severe disabilities, an additional £57.56 (95% CI: 17.69 to 97.44) per week to achieve the same living standards of families without a disabled child. This difference was greater for more deprived families, who needed between £59.28 (95% CI: 41.38 to 77.18) and £81.26 (95% CI: 53.35 to 109.38) more per week depending on the extent of mental health disability. Families of children with physical health disabilities, with or without mental health disabilities, required an additional £35.86 (95% CI: 13.77 to 57.96) per week, with economically deprived families requiring an extra £42.18 (95% CI: 26.38 to 57.97) per week.
Conclusions Mental and physical health disabilities among children and adolescents were associated with high additional costs for the family, especially for those from deprived economic backgrounds. Means testing could help achieve a more equitable redistribution of disability benefit.
- child disability
- living standards
- compensating variation
- propensity score matching
- disability benefits
This is an Open Access article distributed in accordance with the Creative Commons Attribution Non Commercial (CC BY-NC 4.0) license, which permits others to distribute, remix, adapt, build upon this work non-commercially, and license their derivative works on different terms, provided the original work is properly cited and the use is non-commercial. See: http://creativecommons.org/licenses/by-nc/4.0/
Statistics from Altmetric.com
Strengths and limitations of this study
Strengths of this study are the use of: (i) a large and rich dataset representative of the UK population; (ii) disability domains employed in the Disability Discrimination Act consistent with definitions applicable to policy settings and (iii) novel analytical approach based on propensity score matching.
Limitations of this study are: (i) its cross-sectional design; (ii) difficulties in disentangling physical and mental health disabilities (which are often co-occurring) and (iii) data limitations making it problematic to account for severity of disability and to measure living standards, and only covering the period 2004/2005 up to 2011/2012.
Introduction
Families of children suffering from chronic conditions and physical and mental health disabilities incur significantly higher costs than those of their healthy counterparts.1–5 These costs are primarily accounted for by more frequent visits to inpatient and outpatient departments and by greater use of prescribed drugs,1–3 although evidence also suggests that the need to provide or secure informal care adds to the financial burden of child disability for these families.4 5 Previously, the UK studies have estimated the cost of having a disabled child at about £79–£100 per week4 and that under the benefits arrangements at the time (1997) families of disabled children were undercompensated by £30–£80 per week4 and by £28 in 2001.5 More recent evidence has estimated that in the UK families of severely disabled children require up to an additional £79 per week to be able to meet the same living standards of those without disabled children.6
Mental health conditions account for a great portion of the burden of disease among children and adolescents below the age of 16 years.7 Onset of most mental health conditions occurs at different stages of childhood and adolescence: developmental and hyperkinetic disorders become manifest in early childhood, while depressive (including suicide and self-harm), psychotic, anxiety, conduct and eating disorders most commonly arise in adolescence and young adulthood.8 Evidence suggests that in the UK there has been a trend towards increasing rates of children and young people suffering from mental health conditions since the 1980s.9 The 2004 British Child and Adolescent Mental Health Survey (B-CAMHS) conducted by the Office of National Statistics reported that 10% of children aged 5–16 years met diagnostic criteria for a mental health disorder.10
A socio-economic gradient exists in the distribution of child mental health disorders.11–13 In the 2004 B-CAMHS, prevalence of diagnosable child mental health conditions was higher among single-parent (15.6%) compared with married or cohabiting (7.7%) households; among families with low (16.1%) compared with high (5.3%) income and among families whose parents had no academic qualifications (17.0%) compared with those with university degrees (4.4%).14 Evidence exists that life adversities are a risk factor for the onset of mental health conditions as well as that mental health problems of the child can lead to family breakdown and unemployment.14
Both mental health problems and socioeconomic disadvantage in childhood and adolescence can have enduring effects and significantly impact on a young person’s future. Children and adolescents suffering from mental health problems more often report low levels of academic achievement, and engage in risky behaviours such as alcohol and drug use with detrimental effects on employment prospects.15 Similarly, childhood experience of economic hardship can result in long-term adverse health outcomes via the persistence of lower socioeconomic status.15
Since 1992, in the UK, families of children affected by disability have been eligible to receive a non-means-tested weekly disability living allowance (DLA).16 The rationale for these benefits is that they 'may help with the extra costs of looking after a child who: is under 16; has difficulties walking or needs more looking after than a child of the same age who doesn’t have a disability’.16 The amount of benefits that the family is entitled to receive largely depends on the severity of the child’s condition, which is determined by the disability service centre often in conjunction with external assessments. In 2017, under the care component of DLA, children could receive either £22 (if they needed a little help during the day or night), £55.65 (if they needed frequent supervision) or £83.10 (if they needed constant help day and night, or were terminally ill) per week. Under the mobility component of DLA, children were entitled to receive between £22 (if they could walk but needed supervision outdoors) and £58 (if they could not walk, if walking represented a health risk, or if they were blind) per week.
Previous UK studies have shown that families of disabled children incur high costs, but were however unable to attribute these extra expenditures to either physical or mental health disability, which has been shown to inflict a substantial economic burden in other settings.2 3 In the absence of literature exploring the cost of child mental health disability to families, and the rising prevalence of these problems, the aims of this study are to: (1) investigate the cost to families of having a child with a mental health disability; (2) compare the costs of mental health versus physical health disability to assess whether such stratification is needed when considering disability benefits and (3) examine how these costs vary by economic deprivation in order to assess whether means testing of DLA should be considered.
Materials and methods
Sample
We employed data from eight consecutive rounds of data collection from the Family Resources Survey (FRS) covering the financial years 2004/2005 to 2011/2012. The FRS is a repeated cross-sectional survey undertaken by the Department of Work and Pensions whose aim is to collect data on the financial and social circumstances of individuals living within private UK households. Although representativeness of the older age groups within the population might be limited in FRS due to the focus on private households (nursing and retirement homes are not included), the overall sample, used in this study, is representative of the UK population,17 and our focus on families with children aged under 16 years means this is unlikely to introduce a bias.
In the FRS, households are defined as ‘a single person or group of people living at the same address who either share one meal a day or share the living accommodation, that is, a living room’. Each household may include one or more benefit unit, ‘a single adult or couple living as married and any dependent children’. A dependent child is a ‘child younger than 16 years or an unmarried aged 16–19 years in full-time non-advanced education’.18 In this study, for simplicity we refer to benefit units as ‘families’ and consider children as our main unit of analyses, as matching was done at child-level. Our sample includes children aged 0–15 years and their families who had complete data on all variables included in the model covariates and necessary to estimate the CV (ie, income and living standards). We excluded all the children from families with more than one disabled child because of difficulties separating the effects of multiple disabled children in the same family (2.7% of total children). In families with only one disabled child who had siblings we excluded the siblings to avoid within-family matching.
Child mental and physical health disability
In line with the definition of disability included in the Disability Discrimination Act (DDA) 1995 and 2005, the FRS defines a child as having a disability if they have a long-standing illness lasting longer than 6 months and affecting their ability to undertake daily activities. Families were asked if their child had any long-standing illness, disability or infirmity. Families responding ‘yes’ were directed to a set of follow-up questions asking which area of the child’s life was affected by their disability. Possible answers were: mobility; lifting; manual dexterity; continence (ie, bladder control); communication (ie, speech, hearing, or eyesight); memory and learning; recognition of physical danger; physical coordination; other or none of these areas. As we were not able to define their disability either as affecting physical or mental health, we excluded children whose family claimed had a disability but subsequently said that none of these areas was affected by disability (3.4% of total children).
Of these eight disability domains, we assume that memory and learning, and recognition of physical danger can be attributable solely to mental health problems, as they are related to cognitive impairment. We assume all other areas primarily reflect physical health problems,19 but acknowledge these domains could also be affected by, or affect, mental health status. For ease of explanation, we will hereafter refer to memory and learning, and recognition of physical danger as ‘mental health’ disability areas, and mobility, lifting, manual dexterity, continence, communication and physical coordination as ‘physical health’ disability areas.
Using this distinction, we defined disability accounting for: (1) presence of comorbidity between mental and physical disability; (2) number and type of areas affected by disability. Therefore, we created six disability groups defined as follows:
Group 1: any mental disability (either or both domains), no physical disability;
Group 2: any physical disability, no mental disability (group 1 and 2 are mutually exclusive);
Group 3: any mental disability (either or both domains), with or without physical disability;
Group 4: both mental disabilities (both domains), with or without physical disability;
Group 5: any physical disability, with or without mental disability;
Group 6: no disability.
Online supplementary table 1 provides a summary of our groups. We did not create a separate group for children with both mental health domains affected by disabilities, but no physical disability as the numbers were too low. Under the same rationale, we did not include a group with children affected by disability in all of the physical health domains due to low numbers. We compared these groups as follows:
Comparison A: group 1 versus group 6;
Comparison B: group 2 versus group 6;
Comparison C: group 3 versus group 6;
Comparison D: group 4 versus group 6;
Comparison E: group 5 versus group 6.
Supplementary file 1
By allowing for comorbidity between mental and physical health disability in groups 3, 4 and 5, we attempt to explore whether these disability groups could represent more severe conditions compared with groups 1 and 2. Physical health impairments are more common in children with mental health problems14; similarly, physical health disability can adversely affect mental health.20 We hypothesise that if the cost of mental health disability is greater than that of physical health disability, we should see a positive CV for groups 1, 3 and 4 and this will be greater in magnitude than that observed in groups 2 and 5.
It is possible, however, that both physical and mental health have a positive and significant impact and, although the magnitude of the CV across the previously defined groups can give an indication of the overall impact of mental and physical health disability on the costs borne by the family, it is important to attempt to quantify their relative impact. Therefore, in order to investigate our second aim we ran three additional models comparing the exposed group against both children without disabilities and children who had a disability ‘other’ than that employed to define the main exposure. For example, children with any or both (all) ‘mental (physical) health disabilities’ plus other physical (mental) health comorbidities were compared with children with no disabilities and children with only physical (mental) health comorbidities. We defined these models as:
Comparison F: group 3 versus group 6 and group 2;
Comparison G: group 4 versus group 6 and group 2;
Comparison H: group 5 versus group 6 and group 1.
Living standards
Material deprivation is measured in the FRS through a set of 21 questions asking whether the family: (i) can afford and has; (ii) would like to have, but cannot afford or (iii) can afford, but does not want a number of goods previously identified as necessities by families. Ten of the 21 questions were relevant for families without children; all 21 were relevant for families with children.21 We employed a subset of 12 questions asked to the whole sample at each survey wave included in our study. These questions were selected on the basis of their relevance for families with children, irrespective of whether or not the child was disabled. For instance, a question about taking children to swim at least monthly was not included as this might not have been a relevant domain for families with children with disabilities affecting mobility, irrespective of whether or not it was affordable. In online supplementary table 2, we provide a list of all questions we did and did not include with a rationale for the latter.
From these questions we developed a living standards index (LSI) using prevalence weighting22 with weights representing the proportion of families considering the item a necessity. We calculated the LSI as follows:
 (1)
(1)
In Eq. (1), xi is a binary variable indicating whether the family can afford each item (1=’yes, can afford and has it’; or ‘yes, can afford, but does not want’, 0=would like to have, but cannot afford), wi is the proportion (ie, weight) of respondents who consider the item desirable, as defined above22 and M is the number of items.
A total of 10% of families in our sample had missing data for one or more of these questions. In order to derive a LSI value for these families, we scaled the score they obtained from the questions they answered on the total score they could have obtained if they had could afford each of the items they were asked about  .
.
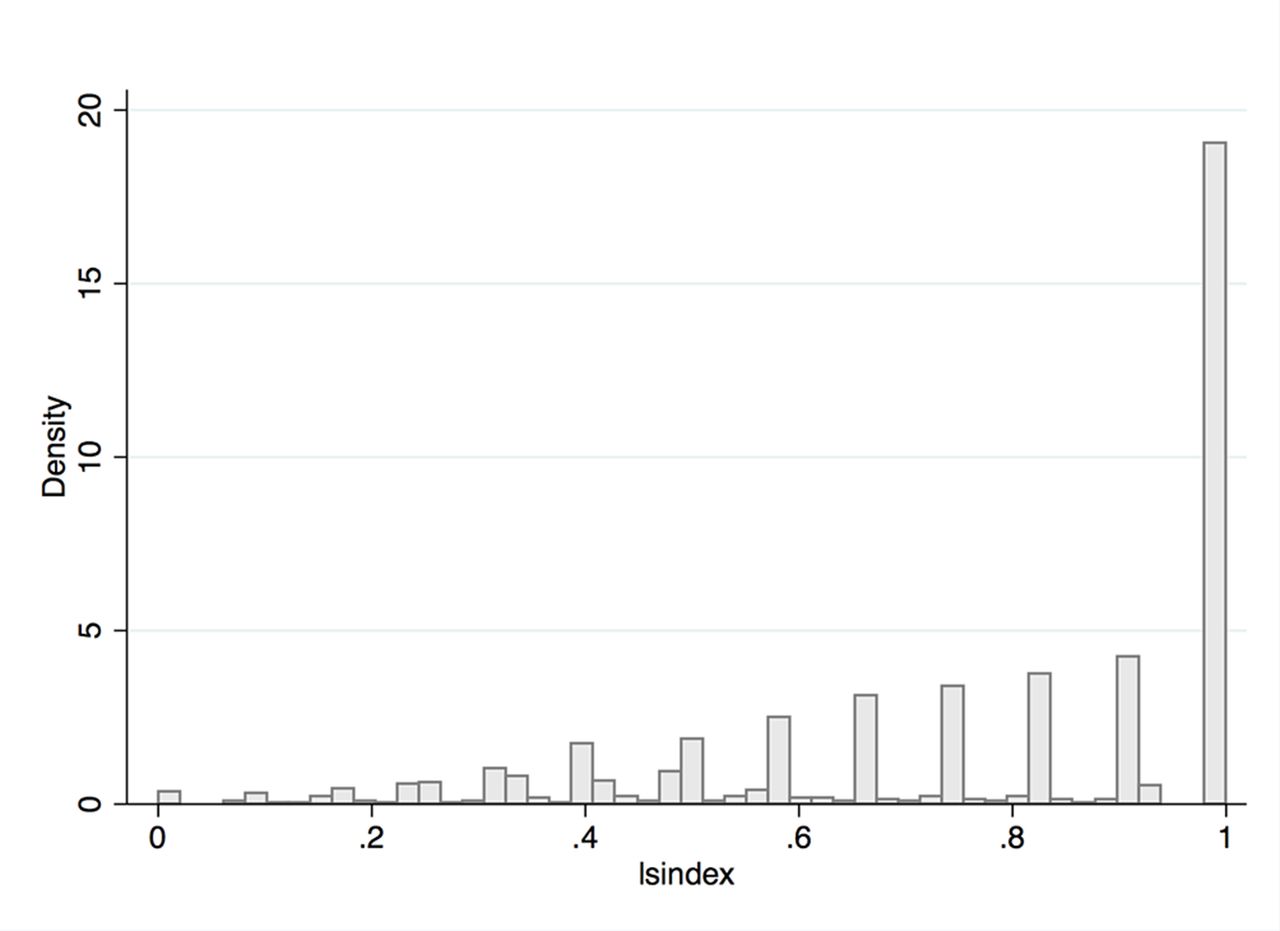
Finally, from the continuous LSI ranging from 0 to 1 (distribution in figure 1) we defined families with an LSI=1 as having ‘high living standards’, since they could afford each item included, and families with LSI<1 as having ‘low living standards’ as they could not afford one or more of the items. We employed continuous values of the LSI to match families using propensity scores and the derived binary variable to conduct stratified analyses (see ‘Data analysis’ section).

Distribution of the living standards index.
Income
We derived a measure of income accounting for all available resources affecting living standards,23 24 including net income from all sources (ie, earnings, self-employment, investments and pensions) as well as from any benefits, including disability benefits, received by the family. Disability and other benefits were included because these affect living standards. We inflated incomes to 2011/2012 prices. We did not employ an equivalised measure of income for ease of interpretation of the results (ie, our unit of analysis is the family and equivalised income is a measure of income per person); however, in order to account for family composition we included variables indicating number of adults and ages of children in the matching stage of the analyses (see below), in line with previous literature.23 25 Values of net income are reported ‘per week’ in the FRS.
Other variables
In our analyses, we match families with and without a disabled child on a number of sociodemographic and socioeconomic characteristics of the families and their children. We included indicators of the child’s age (linear term) and gender (male/female); two linear terms for number of dependent children in the family (range 1–8) and number of years of schooling after the age of 18 years (ie, the age at which compulsory education ends in the UK) of the head of the household and their marital status (single/couple); presence of a disabled adult (yes/no), and to account for family wealth, a categorical variable indicating family savings banded in five categories and an indicator of parental (ie, main respondent’s) employment (employed/unemployed/inactive).
We also included a categorical indicator for survey year and UK Government Office Region (London; South East; Rest of England; Northern Ireland, Wales and Scotlandi).
Data analysis
We described how sample characteristics vary by disability group using cross-tabulations with χ2 test and analysis of variance for categorical and continuous variables, respectively.
We employed the ‘compensating variation’ (CV) approach to calculate the cost of child disability, which has been previously used in studies of disability in adults24 and children.6 The CV can be defined as the additional income that a family with a disabled child needs to be able to achieve the same living standards of a family that is similar in all other respects but without a disabled child. More details on the theoretical approach can be found in the online supplementary material and in online supplementary figure S1. We used Propensity Score Matching (PSM)26 27 to match families according to comparisons A–H and calculate the CV (ie, the mean income difference). It has been suggested that this approach, by simulating a randomised controlled trial setting, can provide a more unbiased estimate of the income difference than parametric models in observational studies.24
We calculated propensity scores (ie, predicted probabilities) from probit regression models with each of our group allocations in the comparisons defined above (comparisons A–H) as the outcome (eg, for comparison A, participation in group 1 is coded 1 and group 6 is coded 0, all other groups are coded as missing). In all models, the independent variables were child age and gender, number of children and disabled adults in the family, years of schooling of the main respondent, marital status, family savings, government region and survey year. Additionally, for comparisons F, G and H we also controlled for areas of disability (other than those defining the group) as covariates. For all models, we calculated areas under the receiver operating characteristic (ROC) to estimate goodness of fit of the model and tested whether the distribution of the covariates was balanced between disabled and non-disabled children. More details on the PSM theoretical approach are in the online supplementary material.
For each matching pair obtained with this matching approach we calculated the CV and its 95% CI.28 As sensitivity analyses we estimated the compensating variation matching disabled children using 3:1 matching (ie, matching a disabled child to the three closest matches) and using radius matching (defining the radius as a quarter of the propensity score SD). All our analyses were run using Stata V.13.
Results
Sample characteristics
From an initial sample of 99 142 children (61 952 families), we excluded families with a disabled child whose disability could not be described in terms of one of the nine main disability areas (n=3461, 3.4%), those with more than one disabled child (n=2651 children, 2.7%) and siblings of disabled children (n=4636 children, 4.7%). After excluding children with any missing data on the variables of interest (n=3182, 3.2%), the final sample consisted of 85 212 children nested in 52 639 families (with minimum of 1 and maximum of 8 children).
The majority of children included in our sample were male (51.05%), lived in a two-parent family (74.75%), did not live with an adult with a disability (84.12%), lived in a family whose total savings were <£1500 (58.85%) and lived in the ‘rest of England’ (50.57%) (table 1). Mean child age was 7.42 years (SD=4.69), mean number of dependent children in the household was 2.19 (SD=0.99) and mean number of years spent in education past the age of 18 years by the main respondent was 18.08 (SD=2.15).
Sample characteristics
Child disability
In total, 1782 (2.1%) children had some type of mental health disability, irrespective of the presence of physical disabilities, and 352 children (0.4%) had mental health disability without physical health disability (table 1). A greater number of children had physical health disability, either with (2686, 3.1%) or without (1126 1.3%) mental health problems, respectively.
Compared with children without any disabilities, and for all definitions of disabilities, more children with disabilities were male, lived in a single parent household and with an adult also affected by disability, had a parent who spent less time in education and had fewer savings, and were older (table 1).
Across low and high living standards, families of children with any type of disability had lower income than those of children without disabilities (table 2); in every disability group, income was higher in families with higher living standards. Among families with low living standards, families of children with both mental health areas affected by disability had higher income than those without disability, whereas families of children with any mental or physical health only had lower income. Among families with high living standards, families of children affected in any of the physical or mental health disability areas or in both the mental health areas, regardless of other areas affected, had lower income compared with families of children without disabilities.
Mean (SD) net income by definition of disability and living standards group
Benefits
As seen in table 3, across all LS groups combined families of children with both mental health disabilities (group 4) received the highest amount of weekly benefits (mean value £45.95), followed by those with any mental health disabilities (group 3; £34.48), and those with any physical health disabilities (group 5; £26.22) (table 3). Note these groups included children with both mental and physical disabilities. Children only affected in either or both mental health areas received on average £17.40 per week (group 1) while those affected in any or all physical health domains only received £10.63 (group 2). The amount of benefits received did not vary by LS, reflecting the absence of means testing for disability benefits. None of the children in the non-disabled group was receiving any disability benefits.
Mean value of benefits received by disability and living standards group
Compensating variation
Over and above their net income (including benefits received) families of children with any (group 3) or both mental health disabilities (group 4) needed an additional £49.31 (95% CI: 21.95 to 76.67) and £57.56 (95% CI: 17.69; 97.44), respectively, a week in order to achieve the same living standards of similar families without a disabled child (group 6; comparisons C and D, respectively), across both levels of LS (table 4). We also found evidence that families of children with any physical health disability (group 2) needed an additional £35.86 (95% CI: 13.77 to 57.96) per week to meet the living standards of families without disabled children (group 6; comparison E). When pooling across living standards, we did not find any other differences in any of the other disability groups.
Compensating variation (£ per week)
When we split the sample by low and high levels of living standards, we found that in some cases families with low LS with a disabled child needed a higher net income to meet the same LS of families without a disabled child. Specifically, we found that families of a child with any mental health disability or both mental health disabilities (with or without physical disabilities) required an extra £59.28 (95% CI: 41.38 to 77.18), group 3, comparison C) and £81.37 (95% CI: 53.35 to 109.38, group 4, comparison D) a week more than a family without a disabled child. We also found an income difference, although smaller, for families of children with disability affecting physical health compared with families of non-disabled children, with the former needing an extra £42.18 (95% CI: 26.38 to 57.97, group 5, comparison E) more a week to achieve the same LS.
When we compared children affected by disability in any, or both mental health areas and in any physical health areas, regardless of the presence of other disabilities, against children without disabilities and other with physical and mental health disabilities, respectively (ie, in comparisons F–H), we found weak evidence that families of children with both mental health areas affected by disabilities needed an extra £47.45 (95% CI: −0.41 to 95.30) more per week to achieve the same LS if in the low LS category (table 4). Although, we did not find any evidence of differences for the other groups, in particular those with high living standards, there was an indication that children in group 1 (any mental health disability with no physical health disability), and group 4 (both mental health disabilities regardless of physical health disabilities) were adequately compensated, although the latter case only among children with greater LS. We did not find evidence of any other group differences.
Sensitivity analyses and model checks
The sensitivity analysis using 3:1 matching yielded virtually identical results to those in the main analysis (results not shown). The sensitivity analysis using radius matching also yielded similar results, with some small differences in the size and significance of the compensating variation for some comparisons (see online supplementary table S3).
In our main analysis, for comparisons A–E the distribution of covariates was balanced between treatment groups (ie, disabled and non-disabled children) with the exception of years of schooling, which in some models was unbalanced. In models F–H, the distribution of covariates was less well balanced in our main analyses. However, in sensitivity analyses all models were balanced, and since the results in the sensitivity analysis were similar to those of the main analysis, this suggests that this is unlikely to have biased our estimates.
Discussion
Little evidence exists on the costs borne by families of children affected by mental health disability in the UK. To the best of our knowledge, this is the first UK study aiming to quantify these costs using propensity score matching and a compensating variation approach to estimate cost of mental health disability.
We found no difference in income between families of children with a disability affecting any or all areas associated with mental health problems only and families of non-disabled children. When we allowed for existence of physical health comorbidities, we found that these families needed an additional £49.31 per week over and above existing net incomes (including disability benefits) compared with families of non-disabled children to achieve the same living standards, with an even greater amount needed if children’s disability affected both mental health domains (£57.56). These difference were, again, even greater for families with low living standards (£59.28 and £81.37, respectively). In comparison, families with children affected by physical health had a positive, but smaller in magnitude, CV (£35.86), which was, similar to what was observed for mental health disability, higher among families with low LS (£42.18). When we tested the relative impact of mental and physical health on the CV, by allowing our comparator group to have disabilities in the opposite domains of the one under investigation, we found a positive, although weak, CV for children affected in both mental health disabilities who live in families with low LS (£47.45). These findings suggest that all these groups are undercompensated by the benefits system.
These results suggest that mental health disabilities in childhood are associated with substantial costs, which need to be borne by their families. In other words, families of children with mental health disabilities need to have higher income in order to achieve the same living standards of a family without a disabled child. These costs appear to be higher when there are co-occurring mental and physical disabilities, possibly an indicator of severity of the condition, and for more economically deprived families. As benefits were already included in our income measure, the compensating variation represents the amount by which families appear to be undercompensated under current benefit arrangements.
Our findings on the cost of child disability are lower from those found by Dobson and Middleton estimating the cost of child disability to the family at £100 per week.4 5 Compared with these studies, we also found that undercompensation occurred to a lower extent, in the range of £8-£15 and only for deprived families with children with mental health disabilities, as opposed to £30-£804 and £24.5 One reason for this difference could be that these studies employed convenience sampling (ie, selecting children with more severe disabilities and living in more deprived settings) and different definitions of disability, which did not clearly distinguish between mental and physical health.
This study had several strengths. It employed a large and rich dataset representative of the UK population. The FRS also makes use of the disability domains employed in the DDA to define areas affected by disability, which makes it consistent with definitions applicable to policy settings. We also employed a novel approach which allowed us to match families based on their propensity scores distribution, and on the values of living standards with exact matching to the first decimal digit. Nevertheless, several limitations should be accounted for. First, we could only give an approximate definition of mental and physical health disability, knowing that areas which we have considered as physical health could be affected as a result of mental health disability only. Nevertheless, our approach represents a first attempt at both costing the impact of mental health disabilities on families and disentangling the relative effect of mental and physical health disability. We were also unable to explore the effect of severity of disability or of different types of disabilities given the nature of the available variables. Future studies should attempt to include specific diagnoses, perhaps including subclinical presentations as separate categories in order to account for varying degrees of severity. A total of 10% had missing data on LS measures, although we calculated our index rescaling the latter to the number of questions each family had answered, it is not possible to rule out the possibility that under estimation/overestimation of the LSI value for these families could have occurred. Moreover, our living standards measure provides an indication of what goods the family can afford, but not of their quality. However, values of mean income by low/high LSI seemed to suggest that the latter adequately describes the intended groups. The sample size for some of our disability definitions was small meaning that we could have incurred in type II error and failed to observe an income difference when indeed there was one. Due to the cross-sectional nature of the study, it was not possible to estimate the CV in the absence of benefits, as the latter contribute, when received, to the LS achieved by the family. This approach would have given a clearer indication of the income difference between families with and without a disabled child. In fact, based on our estimates, we are not able to tell, if we do not observe a difference in income, whether an actual difference would have occurred in the absence of the benefits system. By comparing the CV to the amount of benefits received, we however attempted to estimate whether the family was currently over compensated or undercompensated. Our propensity score model could have been improved by including more precise indications of family structure and parental education, as well as a greater number of family and child characteristics, such as a clearer specification of parental physical or mental health disability. Future studies should endeavour to be more inclusive in order to improve model prediction. We used data covering the financial years 2004/2005 to 2011/2012, which are not the most current available. This choice was motivated by a change in the definition of disability in 2012/2013 to include a separate mental health domain. Although using post-2012/2013 data would have resulted in a clearer definition of mental health and more recent estimates, we would not have had enough statistical power for our analyses. Nevertheless, we found that the amount of DLA received across disability groups in our sample was consistent with 2011/2012 and current DLA figures, suggesting that our findings bear relevance for current policy. Finally, some of our families, especially in adjacent years, could have been recruited in more than one wave of FRS data collection, meaning that our samples might have not been totally independent.29 However, given the large size of our sample we believe that it is unlikely that this could have biased our results.
In conclusion, we found that mental health in childhood and adolescence is associated with high costs, which need to be borne by the family. Our findings indicate that families of children from more disadvantaged backgrounds are currently undercompensated by the disability benefits system. Based on these findings, we suggest that mental health should be better defined as a criterion for receiving benefits and that the amount of disability benefits that a family is entitled to receive are subject to means testing, so that families from more deprived socio-economic backgrounds could be entitled to higher benefits amounts.
Acknowledgments
The authors would like to thank members of the Policy Research Unit for the health of children, young people and families: Terence Stephenson, Catherine Law, Amanda Edwards, Ruth Gilbert, Helen Roberts, Cathy Street, Russell Viner and Miranda Wolpert.
References
Footnotes
↵i Rest of England includes: North East, North West and Merseyside, Yorkshire and Humberside, East Midlands, West Midlands and South West (see online supplementary material).
Contributors FS: developed research question and study design, analysed data and wrote manuscript. MM: developed research question and study design, analysed data and contributed to manuscript revision. SM: developed research question and study design, contributed to manuscript revision and supervised data analyses and the overall project.
Funding This work was supported by the Policy Research Unit in the Health of Children, Young People and Families, which is funded by the Department of Health Policy Research Programme. This is an independent report commissioned and funded by the Department of Health.
Disclaimer The views expressed are not necessarily those of the Department.
Competing interests None declared.
Patient consent Not required.
Provenance and peer review Not commissioned; externally peer reviewed.
Data sharing statement The dataset used in these analyses is publicly available on https://www.ukdataservice.ac.uk/.