Article Text

Abstract
Introduction Orientation and mobility (O&M) specialists assess the functional vision and O&M skills of people with mobility problems, usually relating to low vision or blindness. There are numerous O&M assessment checklists but no measures that reduce qualitative assessment data to a single comparable score suitable for assessing any O&M client, of any age or ability, in any location. Functional measures are needed internationally to align O&M assessment practices, guide referrals, profile O&M clients, plan appropriate services and evaluate outcomes from O&M programmes (eg, long cane training), assistive technology (eg, hazard sensors) and medical interventions (eg, retinal implants). This study aims to validate two new measures of functional performance vision-related outcomes in orientation and mobility (VROOM) and orientation and mobility outcomes (OMO) in the context of ordinary O&M assessments in Australia, with cultural comparisons in Malaysia, also developing phone apps and online training to streamline professional assessment practices.
Methods and analysis This multiphase observational study will employ embedded mixed methods with a qualitative/quantitative priority: corating functional vision and O&M during social inquiry. Australian O&M agencies (n=15) provide the sampling frame. O&M specialists will use quota sampling to generate cross-sectional assessment data (n=400) before investigating selected cohorts in outcome studies. Cultural relevance of the VROOM and OMO tools will be investigated in Malaysia, where the tools will inform the design of assistive devices and evaluate prototypes. Exploratory and confirmatory factor analysis, Rasch modelling, cluster analysis and analysis of variance will be undertaken along with descriptive analysis of measurement data. Qualitative findings will be used to interpret VROOM and OMO scores, filter statistically significant results, warrant their generalisability and identify additional relevant constructs that could also be measured.
Ethics and dissemination Ethical approval has been granted by the Human Research Ethics Committee at Swinburne University (SHR Project 2016/316). Dissemination of results will be via agency reports, journal articles and conference presentations.
- functional vision assessment
- orientation and mobility
- omo and vroom tools
- co-rated measures
- embedded mixed methods
- translational research
This is an Open Access article distributed in accordance with the Creative Commons Attribution Non Commercial (CC BY-NC 4.0) license, which permits others to distribute, remix, adapt, build upon this work non-commercially, and license their derivative works on different terms, provided the original work is properly cited and the use is non-commercial. See: http://creativecommons.org/licenses/by-nc/4.0/
Statistics from Altmetric.com
- functional vision assessment
- orientation and mobility
- omo and vroom tools
- co-rated measures
- embedded mixed methods
- translational research
Strengths and limitations of this study
This study addresses an international shortage of functional vision and orientation and mobility (O&M) measures that facilitate comparisons of different people and assistive devices in infinitely diverse circumstances. No such versatile assessment tools have been available to date.
The corated measurement tools employ a constructivist approach to knowledge that aligns with O&M assessment practice. This resolves previous problems with O&M data quality that arise from assuming objectivity is possible in functional inquiry.
Each assessment tool aggregates ratings to a single comparable score on the spot so that results are immediately accessible to clients and O&M specialists to support person-centred practice, low-vision education and professional decision-making.
The assessment tools generate words and number data from the same context so that the resulting performance measures are precise and their relevance is warranted by individual participants. However, there are no established guidelines in the literature to evaluate the quality of corated data, and these guidelines need to be developed.
A limitation is that the study depends on recruiting sufficient industry partners to generate data with their clients during ordinary O&M assessments when the O&M industry is in a period of tumultuous change and there is a limited pool of O&M specialists in Australia to draw on.
Introduction
Globally, there are 285 million people with low vision or blindness, including 20 million Asians with visual acuity less than 3/60.1 In Australia and New Zealand, an estimated 605 300 people have visual acuity less than 6/12,2 3 making them ineligible to drive.4 Unfortunately, clinical vision measures (eg, acuity, fields, contrast sensitivity) do not predict a person’s everyday functional capability in the real world.5 Clinical and functional phenomena are fundamentally different; therefore, different measures are needed in translational research to evaluate clinical and functional outcomes.6 7
Clinical inquiry seeks to reduce confounding factors and measure single variables in controlled conditions, then statistically compare these variables post hoc. In contrast, functional inquiry is irreducibly complex.8 In the participant’s everyday environments, power shifts from the researcher to the participant who decides what matters then integrates multiple variables with priorities changing in transit. These simultaneous changes and associated responses are easier to show than to tell.9
We propose that functional vision has three manifestations: vision for watching and reading, vision for near tasks and vision for orientation and mobility (O&M). These manifestations increase in cephalocaudal involvement and task challenge, requiring different assessment conditions (figure 1).
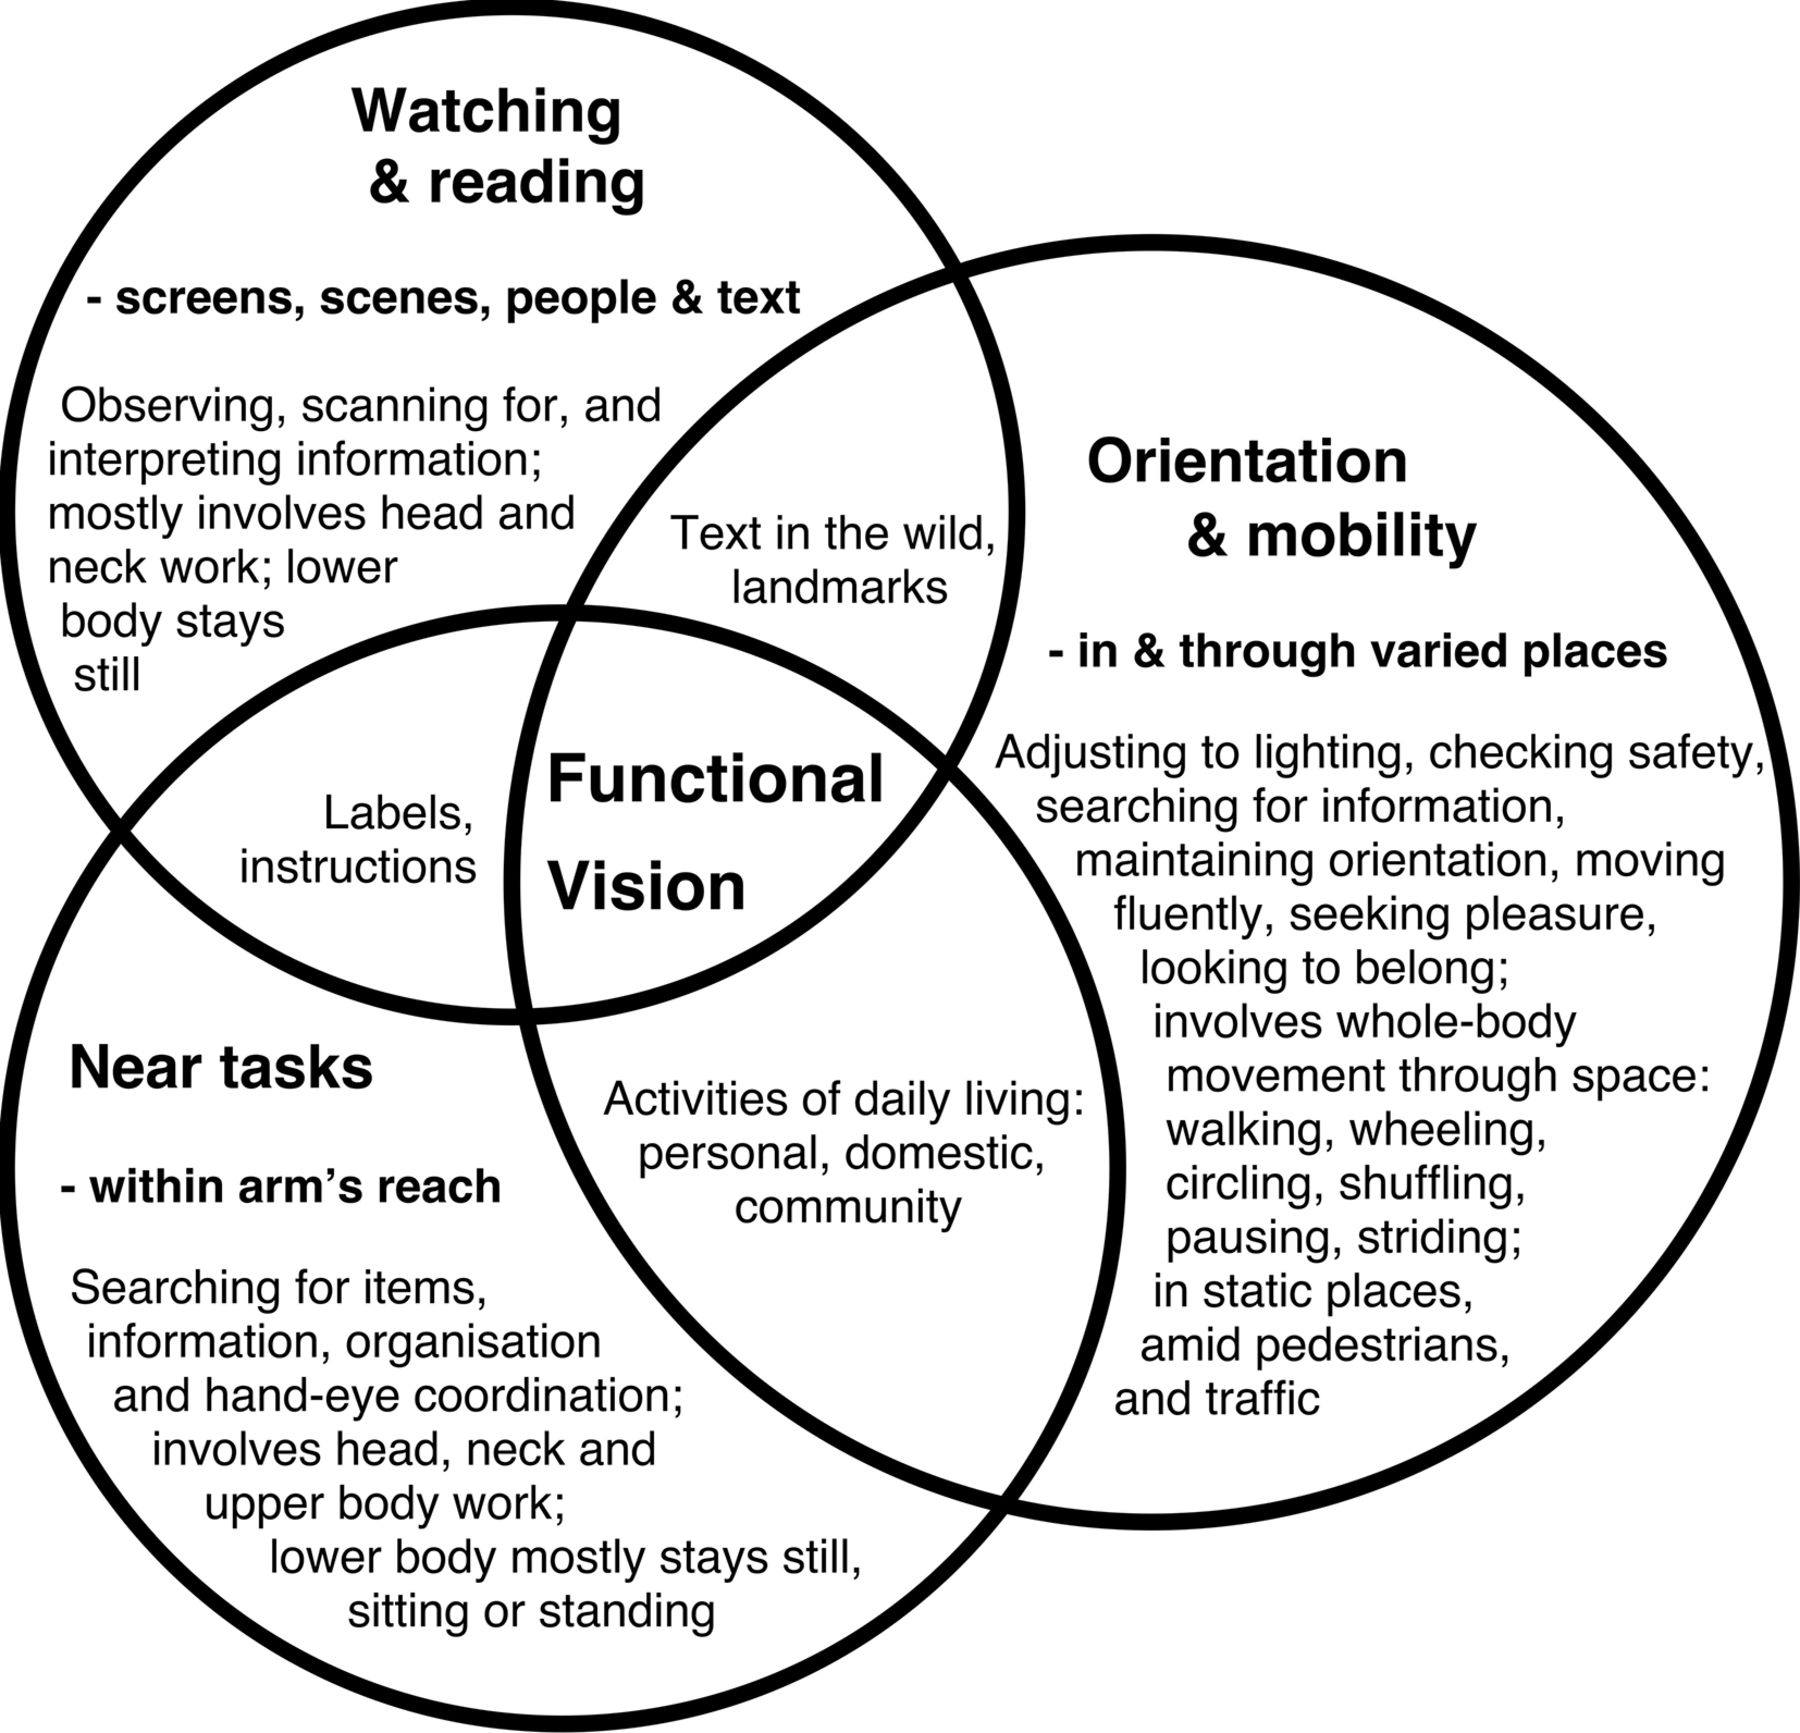
Three manifestations of functional vision.
Watching and reading primarily involve head and neck work to locate, scan and interpret information—looking for a familiar person around a table, browsing a magazine, watching television, a sunset, a play or a sporting event. Near tasks involve head and upper body work to locate task materials within arm’s reach and manage hand–eye coordination—making a sandwich or managing medications. Watching, reading and near tasks involve limited lower body movement so they can be assessed in controlled settings, seated or standing. However, functional vision for O&M is dynamic and irreducibly complex. O&M necessitates full-body movement through changing environments that can include unpredictable moving elements, adjusting to changes in lighting, while integrating multiple visual functions to achieve multiple purposes—cleaning the house, going to the playground, navigating work or school.
Many clinical O&M studies have been designed to investigate individual elements of O&M in controlled conditions10 —avoiding obstacles on a prescribed course,11 12 following a white line on a dark floor and locating a contrasting door13 or a sign on a door.14 Walking speed and obstacle tallies provide clean repeatable data in clinical trials, but their relevance as functional outcome measures of O&M training or vision-related interventions is based on surmise and has been inadequately justified in the literature.15 Not surprisingly, these measures have failed to capture the more holistic, lifestyle benefits gained from O&M training10 or vision-related interventions16 that participants report anecdotally. O&M clients have indicated they don’t mind contacting obstacles, but they care about travel fluency, fatigue and avoiding falls.17 18
Clinical O&M trials are often conducted in an uninhabited environment, rating only level 2 on the six-level O&M Environmental Complexity Scale (see online supplementary appendix 1).19 They rarely investigate free-roaming mobility in pedestrian-paced environments (levels 3 and 4) or traffic environments (levels 5 and 6) that require social skills, knowledge of the road code and timely responses to unpredictable events.
Supplementary file 1
In contrast, O&M specialists undertake person-centred practice in the community with non-drivers whose mobility problems are usually related to low vision or blindness.20 21 They assess a client’s functional vision and O&M skills qualitatively, then teach visual efficiency skills, mobility aid use (eg, long cane, dog guide, mini guide) and practical travel strategies to maximise the client’s independence.
O&M clients are diverse, making it difficult to compare their functional status and prioritise needs. There are checklists and rating scales to support aspects of functional O&M including general skills and confidence,22 children’s skills,23 body concepts24 and mobility challenges with tunnel vision.25 The ‘CVI Range’ is designed to measure cortical vision impairment in children.26 27 But there are no measures for use in general O&M assessment that reduce qualitative assessment data to a single comparable score. Internationally, O&M professionals need an efficient way to rate the functional vision and the O&M skills of any client they encounter to profile and compare different client groups and travel environments, interpret clients’ mobility choices, guide programme design and evaluate the outcomes of O&M training, assistive devices and interventions such as a bionic eye.28 29
The VROOM and OMO tools
During 2015, two new functional assessment tools were developed for use in ordinary O&M practice, measuring vision-related outcomes in orientation and mobility (VROOM) and O&M outcomes (OMO) (see online supplementary appendix 1).
The VROOM and OMO tools are designed to be used in the same assessment event, but they measure different phenomena, producing a separate score for functional vision and for functional O&M. These tools are built on the same measurement template. Each is a suite of behaviourally anchored rating scales, with part A scoring observed behaviours out of 30 and part B scoring elements of self-reported well-being out of 20. Rather than measuring opinions separately, the VROOM and OMO tools are scored together during a corating conversation between the assessor, the client and any other relevant stakeholders. Conversation about the client’s abilities leads to accord about how to score each construct, and disagreement can mean that more observation and detailed discussion is needed. When there is indecision between levels on a scale, the rule is to choose the lower rating. The subscores are then aggregated for each tool on the spot, resulting in a score out of 50 for vision and 50 for mobility.
The VROOM and OMO tools were developed following bionic vision research (2011–2015),18 30 where grounded theories about functional vision and mobility were derived from the lived experience of people with advanced retinitis pigmentosa (n=43).9 To test proof of concept, the VROOM tool was retro-scored with a convenience sample (n=13), drawing on live observations of people selected from across the visual spectrum and video data from the bionic eye project. This process showed that the measurement template worked with a broad spectrum of people including drivers and people with light perception only, yet was precise enough to capture subtle functional improvements in vision. The three retinal implant recipients each showed a 12%–16% (6–8 point) increase in their VROOM scores when their retinal implant device was switched on.9
The VROOM and OMO tools were then piloted during interviews with O&M clients who have a guide dog (n=51).31 During their corating conversation, participants were invited to critique the constructs being assessed in the tools and suggest improved wording of performance indicators. The VROOM tool inadvertently captured a 60% (30-point) improvement in one man’s functional vision from corneal transplant surgery in between his initial VROOM rating and a rescoring conversation several months later.
Rating decisions in part A are made after observing the client travelling in multiple settings, with attention to five universal travel functions: getting your bearings, checking ground plane, wayfinding, recognising moving parts and finding things. The rating scale for the OMO tool focuses on travel competence regardless of vision as: (3) elite, (2) competent, (1) basic or (0) beginner, regardless of visual status, whereas the VROOM tool rates sensory preferences as: (3) predominantly visual, (2) vision first confirmed by other senses, (1) other senses first, confirmed by vision or (0) non-visual.
In part B of the template, five relevant constructs, each with defined performance indicators, are corated while discussing well-being and lifestyle choices with the client. OMO part B explores activities, connections, life–space, orientation and self-determination (sense of agency), which are drawn from the Effective Mobility Framework,17 whereas VROOM part B explores vision for reading, visual certainty, mobility aid choices, people and pleasure, which are drawn from new theory about visual purposes.9
Comments from the client, the assessor and other stakeholders are noted alongside these ratings, providing precise, embedded mixed data32 about each client’s functional abilities at the time of assessment.
Exploratory factor analysis of the pilot data suggested that the subscales in the VROOM tool are measuring the one construct (functional vision for mobility). However, O&M is a more complicated phenomenon involving the mechanics of travel, spatial cognition and psychosocial factors, as indicated in the Effective Mobility Framework.17 OMO part A works well, scored after observing travel, but a larger dataset is needed to explore the sufficiency and relationships between the OMO part B constructs in accounting for O&M. In addition to grounded theory methodology,33 Rasch analysis of a larger VROOM and OMO dataset generated from more diverse clients will be used to review the subscales, calibrate the weighting of constructs and thereby convert the ordinal scales to interval measures.
The VROOM and OMO tools are not just created for use by researchers but are intended to support and streamline professional O&M practice, so a priority is to balance their user friendliness during client assessments, with their ability to generate precise, meaningful measurement data on the spot.34 O&M assessment apps and online training will be developed to support O&M specialists and clients to use the VROOM and OMO tools.
The VROOM and OMO tools are designed to:
benchmark functional skills on initial referral
measure the range of normal fluctuations (eg, day/night vision, morning/evening travel)
track deterioration of skills with ageing or specific conditions
compare skills pre–post O&M training (eg, long cane)
evaluate new assistive technologies (eg, smart-cane, bionic eye).
Over time, this practice-based evidence has the potential to inform referral criteria for O&M services and vision-related interventions, warrant funding applications for client services and assistive devices and shape social policies impacting eligibility criteria for pensions, urban planning for pathways, public transport and safety, and communication technologies that improve access to information.
The role and design of O&M technology
There are three ways that technology is related to this project: to support independent travel for O&M clients, to streamline O&M professional practices and to support the measurement of O&M outcomes.
Since World War II, specialised electronic mobility aids have been developed for people with low vision or blindness, to increase their range of preview during travel, to avoid collisions and support fluent wayfinding, to gain and maintain orientation and manage travel information.35 36 Wearable or implantable vision restoration devices include retinal prostheses,13 30 computer-mediated head-mounted displays37 and sensory substitution devices.38 Autonomous robot guidance is also proposed as an alternative to a dog guide to support wayfinding.39
Each of these technologies is remarkable for its innovation and fit for purpose. However, each is suited to a narrow clientele and devices differ in their cultural acceptability. Specialist technology is costly to develop, some devices never make it past the prototype stage and most that reach commercialisation tend to be superseded in a few years.40 Since global positioning system (GPS) apps (eg, www.blindsquare.com) have become widely available and accessibility features such as voice-over, zoom and camera functions have become common inclusions, many O&M clients now prefer mainstream technologies such as a smartphone or tablet to support their travel (figure 2).31 Mainstream devices are affordable and easy to upgrade, multipurpose and synchronised so the traveller needs to carry less equipment. They reduce social barriers as people with full vision, low vision and no vision enjoy the same technology.
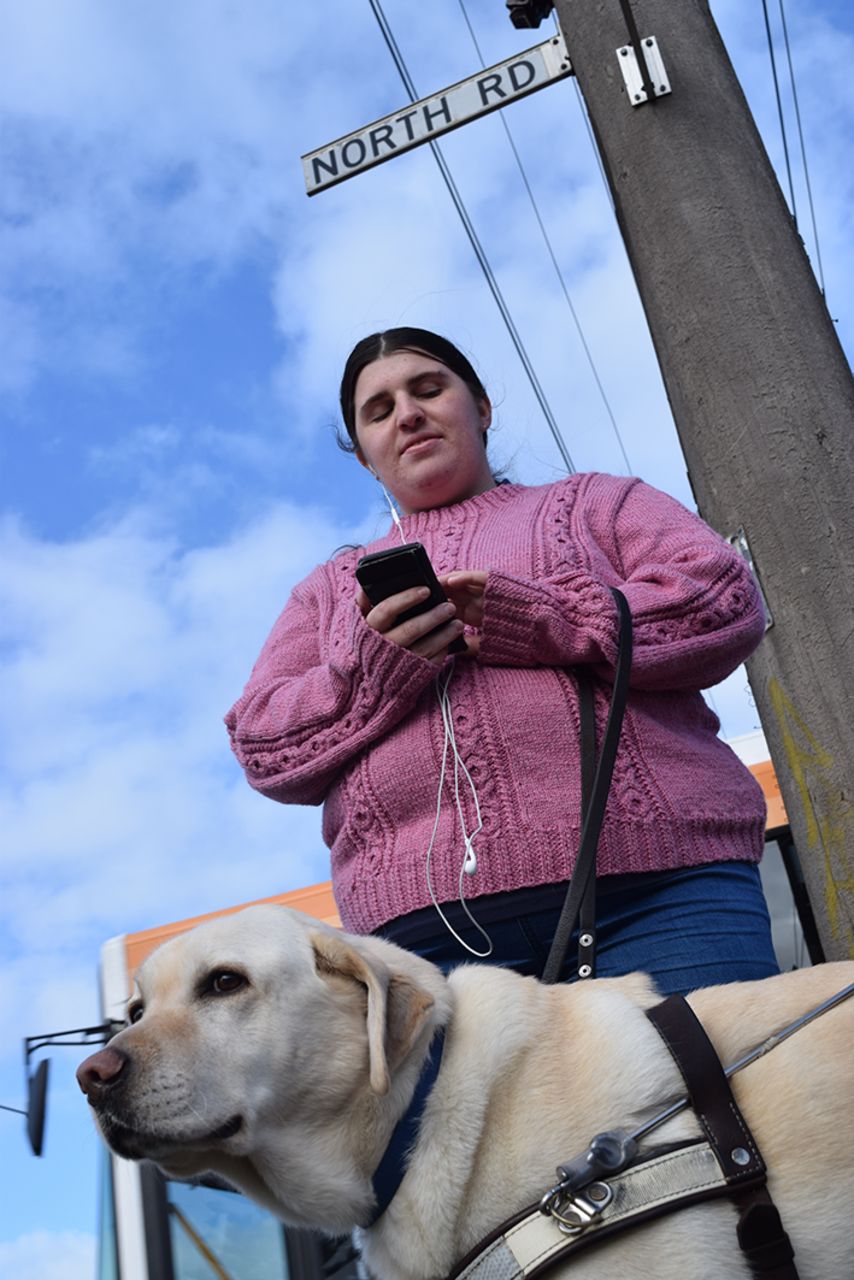
Orientation and mobility client uses GPS and public transport apps on her mobile phone to support travel with her guide dog. Photo by Lil Deverell, used with client’s permission. GPS, global positioning system
O&M specialists, some with low vision or blindness, also use smartphones and tablets to support their professional practice—to organise caseloads, access apps, maps, timetables, online directions and voice recording functions to plan, implement and review travel with clients. Video provides evidence of the client’s O&M skills to show relevant stakeholders. FaceTime connects city-based professionals and rural or remote clients to deal with real-time travel challenges in between regional visits.41 The internet makes diverse professional development opportunities available to isolated or time-poor practitioners.
Life-logging in O&M research has become easier with an increase in personal activity monitors (eg, Fit-bit, Smart-watch, mobile phone apps), discreetly integrated into a wristwatch or mobile phone. However, accessibility differs between different platforms and devices, and improvements are needed to increase their user friendliness for people with low vision or blindness. Egocentric vision can be captured with a video camera (eg, www.gopro.com) mounted on the head or body to record travel challenges, combined with eye tracker technology such as Tobii (www.tobii.com) or SensoMotoric Instruments (www.smivision.com) to measure mobile gaze direction, then state-of-the-art computer vision techniques can generate precise information about visual behaviour during travel.42 These data help to inform the iterative development of new vision-related technologies, but in functional research, it is important to consider appearances. In some communities, snatch-theft is a risk when costly equipment is on display, and devices that make the traveller look unusual can change the way that passers-by interact so that something other than ordinary functional performance is measured.
In human factors engineering, there is growing awareness of the need for user-centred design when developing technologies. Ethnographic analysis is a method that draws observations from the practical use of devices in the context of their intended use, accounting for both practical and cultural influences on usage and acceptance.43 Then, codesign is a participatory method, which places the user’s needs, desires and opinions at the centre of the design process.44 Consumers, researchers and designers all play a role in generating ideas, developing concepts and iteratively testing and modifying prototypes.
Aims of this study
The aims of this study are to:
Validate the VROOM and OMO tools during ordinary O&M assessment, to profile O&M clients and compare their functional abilities through:
quota sampling in Australia
cultural investigations in Malaysia.
Optimise technology to measure functional vision, mobility and service outcomes of people with low vision or blindness by:
analysing the technology use and needs of O&M agencies, O&M specialists and O&M clients in Australia and Malaysia;
developing assistive technology prototypes to support clients’ O&M through student projects;
developing phone apps and online training that enable O&M specialists and O&M clients to generate and manage practice-based evidence from O&M assessments.
Methodology and methods
Study design
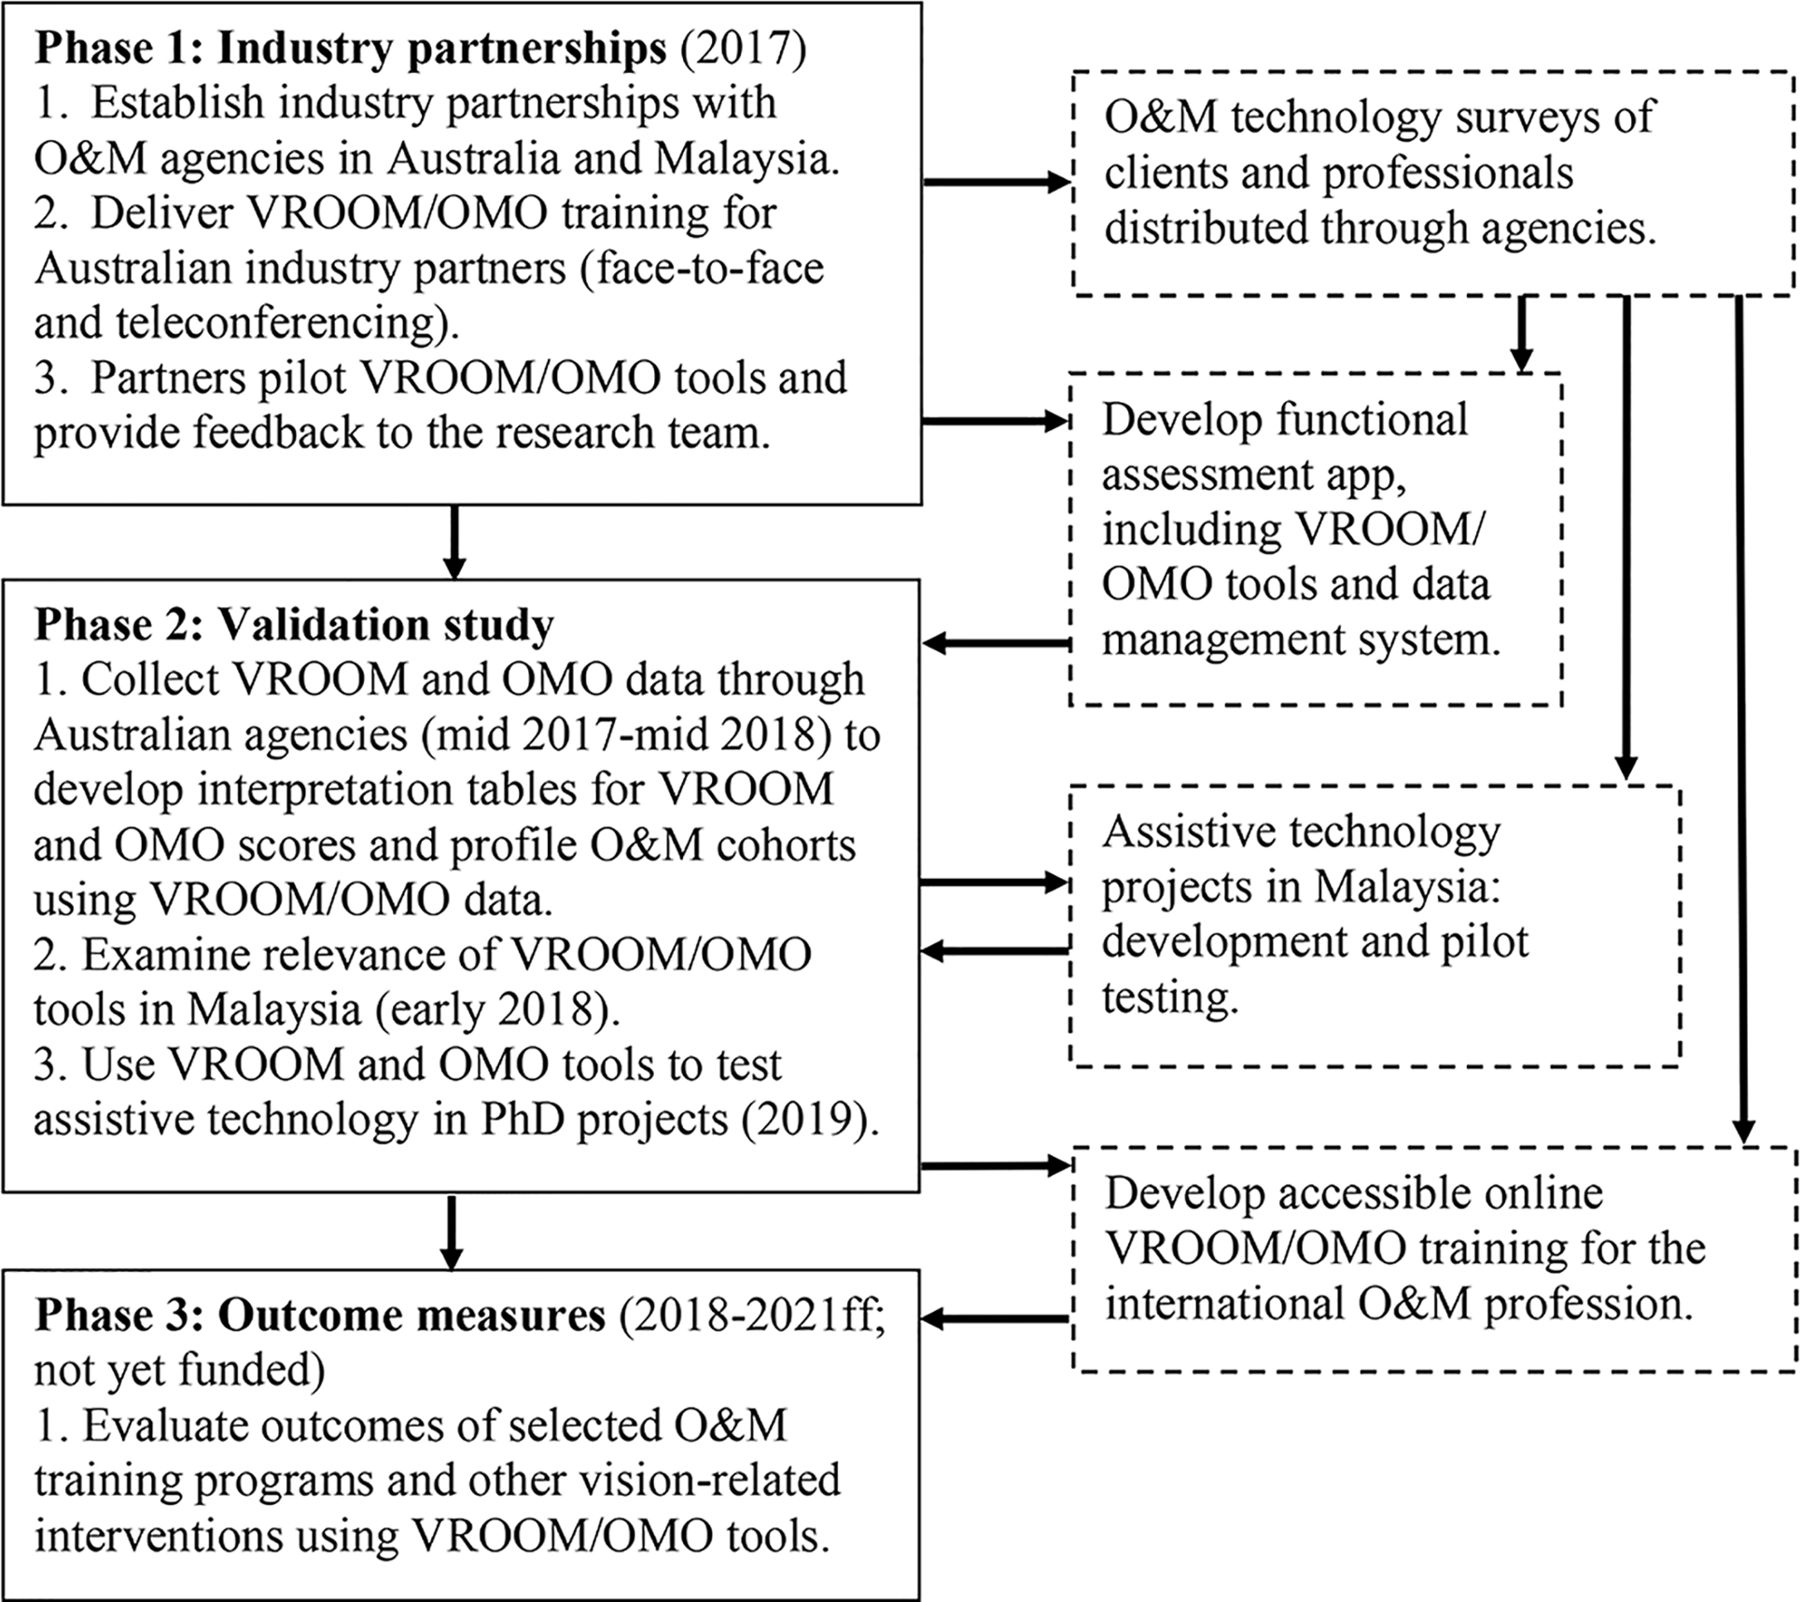
This study will employ a multiphase, mixed-methods design (figure 3), beginning with a cross-sectional study of O&M clients, extending to O&M cohort studies defined in relation to selected vision and mobility-related interventions.

Workflow between different parts of the study. Solid line boxes indicate VROOM/OMO validation study. Dashed-line boxes indicate technology developments. app, application; ff, following; O&M, orientation and mobility; OMO, O&M outcomes; VROOM, vision-related outcomes in orientation and mobility.
The VROOM/OMO validation study (solid line boxes) is an embedded, mixed-methods design with a QUAL/quan priority,32 which means that measurement data will be generated in the context of social inquiry in the participants’ lived environments (ie, ordinary O&M assessments) not from standardised tasks and venues. The validation study depends on establishing industry partnerships with O&M service providers (called agencies) in Australia and Malaysia. The objectives, methods, facilities/resources, and expected outcomes of the validation study are detailed in table 1.
VROOM/OMO validation study details—objectives, methods, facilities/resources and expected outcomes
At the same time, technology will be investigated and developed to support clients' independent mobility and professional O&M assessment practices (figure 3, dashed line boxes). First, online surveys of the technology uptake and needs of O&M clients and O&M specialists will inform the design and optimisation of technologies. A mobile phone app that streamlines VROOM/OMO data collection and upload will be developed and piloted in Australia, then refined at the end of first-round data collection as the VROOM and OMO tools are revised. Accessible online VROOM/OMO training will be developed to facilitate the widespread, consistent use of the tools by O&M professionals internationally. Parallel to this project, assistive devices that support independent travel with low vision or blindness will be developed in two PhD projects, using the VROOM and OMO tools to evaluate prototypes. Agencies might also choose to investigate the impact of particular assistive devices using VROOM and OMO assessments.
The first five objectives (establishing the feasibility, scope of application, reliability, content and construct validity of the tools) will be addressed during the first round of data collection, expected to take 1 year.
Data collection to address objectives 6 and 7 (establishing concurrent and predictive validity) will take longer and the following considerations will affect progress:
There are no gold standard measures of functional vision for mobility or O&M to establish criterion validity, but depending on the interests of agencies and clients, comparable data might be generated from the Stuart Tactile Maps test18 45 (spatial cognition), the Client Evaluation Tool22 (travel skills and confidence) or personal activity monitors (distance, roaming range, activity type and travel-related stress).
Adding assessment tools to VROOM and OMO will extend assessment times; O&M specialists will only fit this in as their workloads allow.
Some O&M programmes can last 12 months or more, so it can take a long time to complete data collection pre–post intervention.
The heterogeneous nature of O&M practice means it can take a long time to accrue data from multiple clients about a defined cohort or selected intervention.
The research team
The research team includes an O&M specialist, a psychologist, statisticians and experts in design and human–computer interaction, with team members located in Melbourne, Australia and Sarawak, Malaysia.
Participants and eligibility
Vision and mobility are generic human functions so the VROOM and OMO tools are designed to encompass the skills of O&M clients or anyone, of any age or abilities and in any location. The scope of application of the VROOM and OMO tools will be tested by O&M specialists in this study (table 1, objective 2) through purposive heterogeneous sampling to include children, adults and seniors with a wide range of comorbidities who are living and travelling in varied locations. There are no exclusion criteria for people being assessed, except their unwillingness to participate.
Sampling frame
The Australian O&M industry, which employs qualified O&M specialists, will provide the main sampling frame for this study. O&M specialists, including dog guide instructors, are uniquely skilled in assessing the functional vision and O&M skills of diverse clients who have low vision or blindness. Ultimately, they will determine whether the VROOM and OMO tools are feasible and enhance ordinary O&M practice (table 1, objective 1).
Malaysian agencies providing services for people with low vision or blindness provide a second sampling frame to explore the international relevance of the VROOM and OMO tools.
The VROOM and OMO tools have potential application beyond the O&M profession. Occupational therapists and community-based rehabilitation (CBR) fieldworkers employed by industry partners will be invited to participate in VROOM/OMO training sessions, trial the tools in collaboration with O&M specialists and provide feedback to the research team (table 1, part of objective 3). However, their findings will be analysed separately from the data generated by O&M specialists.
Sampling strategy and sample sizes
In this mixed-methods study, we consider sampling from two perspectives: data saturation and statistical power. First, data saturation is needed to ensure that the VROOM and OMO tools adequately account for the functional phenomena they purport to measure, which will be evident in their respective interpretation tables (table 1, objective 4). Superficially data saturation means collecting qualitative data until no new behaviours are identified. According to grounded theory methodology, theoretical data saturation is more dependent on theoretical sampling and theoretical adequacy than sample size,33 which is why sampling diversity is important in this study.
Statistically, we are aware that larger samples will more accurately represent any group subject to comparisons, but we need to strike a balance between available resources in the O&M industry and ideal sample sizes. Some useful rules of thumb have guided our sample size decisions: measuring group differences (eg, t-test, analysis of variance (ANOVA))—30 per cell for 80% power, and if decreased, no lower than 7 per cell; relationships (eg, correlations, regression)—around 50; χ2—at least 20 overall, with no cell smaller than 5; factor analysis—around 300.46 Thus, our purposive quota sampling will aim for minimum numbers of:
50 children (aged <20 years); 50 adults (aged 21–59) and 50 seniors (aged 60+)
50 participants in each of the 10-point categories in both VROOM and OMO (table 2)
30–50 participants in mainstream O&M groups (eg, long cane, dog guide users)
7 participants in specialist groups (eg, wheelchairs, assistive technologies)
300 participants for exploratory and confirmatory factor analysis
300 participants for Rasch analysis.
Quota of participant assessments needed in each category of the VROOM and OMO scales to make statistical comparisons
We estimate that 300–400 O&M assessments will be needed to fill these quotas by the end of first-round data collection.
O&M specialists will select who to assess, beginning with convenience sampling as their workloads allow, then moving to purposive sampling to fill the indicated quotas. We anticipate needing to recruit additional purposive samples of adults with near full vision to supplement participant numbers in the VROOM 41–50 category and people with profound mobility limitations to supplement participant numbers in the OMO 1–10 category, because people with full vision and people who will always travel with a carer seldom refer for O&M services in Australia.
Recruitment
We identified 15 agencies in Australia that provide O&M services, including 5 paediatric O&M services. These agencies employ around 224 O&M specialists, including at least 55 dog guide instructors.2 The number of O&M clients across Australia is unclear but Guide Dogs Victoria alone worked with 1380 clients in a 12-month period, delivering 2390 programmes.47 However, it is not feasible to validate the VROOM and OMO measures in one location. The agencies are perpetually under-resourced and can have long waiting lists.2 The roll-out of the National Disability Insurance Scheme (www.ndis.gov.au) is changing referral pathways, service profiles and reporting procedures, resulting in agency turmoil and substantial new learning for staff. Spreading the workload across agencies will give O&M specialists more choice to opt in when they are able and maximise diversity and collaboration in critiquing the VROOM and OMO tools. The number of VROOM/OMO assessments undertaken by each agency will depend on the agency’s size, service profile, referral rates and likely client characteristics; competing research priorities; the number of O&M specialists employed, their availability, workloads and interest and the informed consent of clients.
Through industry contacts and the internet, we identified seven organisations in Malaysia providing services to people with low vision or blindness. Several of these agencies offer CBR services, but the availability and extent of O&M services is unclear. The one guide dog handler in the country, Stevens Chan is repeatedly refused access to taxis, buses, shopping centres and parks, due to lack of legal frameworks, policies and community education in the country (eg, https://www.youtube.com/watch?v=G9Mh55TER7Y). Contact will be established with Malaysian agencies prior to a field trip in early 2018 to explore understandings of low vision and attitudes to disability and independent travel in Malaysia, then evaluate the relevance of the VROOM and OMO tools for use by Malaysian CBR fieldworkers and O&M specialists. Formal VROOM/OMO data collection in Malaysia followed by Item Response Theory/Rasch modelling needs to follow this grounded theory research phase but is beyond the scope of the current protocol.
Collaboration with O&M specialists and clients will occur throughout the project through industry partnerships, the professional body (O&M Association of Australasia) and an O&M client reference group (n=10) to critique the VROOM and OMO tools and associated technologies.
Data collection
Ordinary O&M assessment, comprising interview and observed travel in the client’s lived environments, provides the context for implementing the VROOM and OMO tools. O&M specialists will be encouraged to integrate the tools into their existing assessment practices in whatever way works best for the client. This means that corating decisions might be discussed through the initial interview, during observed travel and in a focused conversation at the end of the assessment.
O&M specialists will be encouraged to use the VROOM and OMO tools at any time in the initial phase of data collection—at initial assessment, mid-training or on completion of an O&M programme. This process will enable assessors and clients to gain confidence using the VROOM and OMO tools, test their application in a wide range of circumstances and evaluate their feasibility as professional assessment tools (table 1, objectives 1 and 2).
The research team will use these data to generate interpretation tables that describe the functional implications for each 10-point category in the VROOM and OMO tools. We will profile Australian O&M cohorts, describing relationships between their functional vision and mobility and their vision condition/s, life circumstances and mobility aid choices. Feedback from clients and assessors after this period will also indicate the most effective ways to implement the VROOM and OMO tools and inform guidelines for long-term data collection.
Examining the cultural relevance of the VROOM and OMO tools in Malaysia is part of establishing the generalisability of these tools for international use.
The second phase of data collection is longitudinal, measuring VROOM and OMO scores pre–post O&M training that might include a long cane, dog guide or Miniguide, wheeled mobility (eg, powerchair, scooter, bicycle), public transport, navigational devices (eg, GPS apps, Trekker Breeze), visual efficiency training and orientation to new places, in individual or group programmes. The VROOM and OMO tools will be used to evaluate the functional outcomes of assistive technology prototypes developed for O&M clients in this study (piloting with n=7). The question of what constitutes meaningful change in functional outcome research will be explored in this phase, building grounded theory from participants’ comments and descriptive statistics derived from the VROOM and OMO data sets.
After interpretation tables are developed, the VROOM and OMO tools will be available to research groups internationally as outcome measures for vision or mobility-related interventions. These intervention-specific cohort studies depend on securing relationships with industry partners and ongoing funding.
Primary measures: VROOM and OMO tools
The ordinal scales in the VROOM and OMO tools that aggregate to a score out of 50 for each tool and the associated comments that support these rating decisions provide the primary data about functional vision and mobility in this study (see online supplementary appendix 1).
Secondary measures
Sociodemographic questions built into the VROOM/OMO assessment provide additional information about clients and their travel contexts (see online supplementary appendix 2).
O&M Environmental Complexity Scale
O&M specialists will use the six-level O&M Environmental Complexity Scale to identify the most challenging settings observed during assessment, assuming the client can manage all environments below this level.19
Vision
When a client’s visual acuities (and fields) are available on file, measured within a year of the VROOM assessment, these measures will be compared with VROOM scores to explore equivalence between clinical and functional vision measures. However, clinical vision testing with every client assessment is not part of this protocol.
O&M technology surveys
Two online surveys will investigate the technology that O&M clients (see online supplementary appendix 3) and O&M professionals (see online supplementary appendix 4) already use, as well as identifying needs and ideas for optimising technology to support travel, O&M professional practice and research.
Data monitoring and management
Time frames and frequency of follow-up
We aim to complete the first round of data collection to profile Australian O&M clientele (n=300–400) in a 1-year period (late 2017 to late 2018). Then agencies will be invited to continue data collection pre–post training according to their own follow-up schedules. The timing and frequency of follow-ups will depend on the intervention/s received and the service profile of the Agency. For example, a client who has trained with a dog guide might receive follow-up at 1, 3, 6 and 12 months post-training.
Managing bias and subjectivities
O&M agencies in Australia have asserted the need for outcome measures and they affirm the VROOM/OMO project, but they are perpetually under-resourced, vie for government and charity funding, and their ability to collect data is subject to competing priorities. As industry partnerships implement the VROOM and OMO tools according to their own resources and service profiles, O&M clientele will not be equally represented according to their agency affiliations or geographical location. Rather, the combination of purposive and quota sampling methods will ensure that the VROOM/OMO data set represents the range of functional vision and O&M abilities seen within and beyond O&M professional practice.
Long-term, larger agencies will be encouraged to target their VROOM/OMO outcome assessments in key services that might render data from 50 or more clients. At the same time, the research team will draw together isolated assessment data from different agencies into groups that share like characteristics so that wherever possible, statistical comparisons can be made in addition to mixed methods analyses.
The VROOM and OMO tools are designed to represent what O&M specialists discover about the client’s capabilities and choices in the client’s environments, not to project what should happen. Thus, O&M specialists will be encouraged to follow the client’s cues about what is meaningful to assess, just as they ordinarily do during functional O&M assessment.
O&M specialists already navigate differences of opinion during O&M sessions, and power shifts dynamically between the client’s priorities, professional opinions and the concerns of other stakeholders. An impasse while corating might indicate that more information or further functional assessment is needed before VROOM/OMO measurement decisions can be made.
Data analyses
In addition to comparing each 10-point group in the VROOM and OMO scales, O&M assessment data will be compared on the basis of age, vision condition/s, comorbidities, occupation and mobility aid use.
Qualitative data will be coded and categorised with the support of NVIVO software, Excel spreadsheets and mind-mapping software.
Exploratory/confirmatory factor analysis and Rasch modelling will be used to refine the OMO and VROOM scales using reflective models. In part B of the OMO scale a formative model is required due to the range of elements that constitute mobility-related well-being. Structural equation modelling will be used to predict travel-related well-being from these items’ responses with confirmation from sociodemographic data.
Cluster analysis will be used to identify groups of clients exhibiting similar O&M patterns. χ2 tests will be used to compare these clusters with other client groupings defined in terms of vision, employment status and other demographics.
Between-groups ANOVA will be undertaken to compare the skills of different O&M client groups and with non-client participants if appropriate. An invariance test of the measurement models derived for Australia and Malaysia will determine whether these measures are likely to be transferable between cultures and languages.
Longitudinally, repeated measures analyses will be performed with the OMO and VROOM outcome data collected pre–post intervention to evaluate the effectiveness of these interventions.
In embedded mixed data analyses, qualitative findings will be used to review the personal relevance of measures and identify any salient aspects of functional vision or O&M that have not been measured; to build interpretation tables for the VROOM and OMO scales and to filter, interpret and warrant the generalisability of statistically significant results.
Data quality assurance
Corated data are different to independently rated data, requiring alternative approaches to data management than are typically used in the development of psychometrics. Validation of the VROOM and OMO tools does not depend entirely on statistical analyses. In a mixed-methods study, statistical results must be integrated with qualitative data in mixed analyses to generate robust findings.48 The qualitative/quantitative priority during data collection ensures that corated measurement data represent what matters to participants. Practices that support the trustworthiness of qualitative data are built into the assessment and corating process, including collaboration between the researcher and the researched, triangulation of multiple observations and opinions, member checking and reflexivity.49 50
During assessment, clients’ opinions are evident both in their words and actions, and relevant stakeholders can speak for clients whose insight, voice or actions might be limited. O&M specialists will be encouraged to justify their professional reasoning during assessments and minimise the influence of their own biases during corating conversations.
Ethics and dissemination
Ethical approval has been granted by the Human Research Ethics Committee at Swinburne University of Technology (SHR Project 2016/316). Informed consent will be obtained from all participants and express written permission sought before any identifiable data (eg, names of agencies or people, photos, video) are used in conversations, presentations or publications. However, O&M assessment happens in public places, so it is impossible to guarantee anonymity in this project.
Due to industry sensitivities, the research team will not publish data from this study that compare agencies; rather VROOM and OMO data across agencies will be reported along with client cohort profiles defined by these data.
VROOM and OMO assessments will add a little time but no additional risk to ordinary O&M assessments. O&M agencies already have safeguards in place (eg, health action plans, procedures and insurance policies) to manage risk and any incidents that might arise during O&M assessments.
Dissemination of results will be via individual agency reports, journal articles and conference presentations.
Acknowledgments
Dean Johnson and Mel Stevens have been valued conversation partners in the development of O&M theory, the VROOM and OMO tools and the technology surveys.
References
Footnotes
Contributors All authors contributed to the design of the study. LD conceived the VROOM and OMO tools and led the mixed methods and qualitative designs. DM, JB and FMAI led the quantitative design. BTL, AA-M, SS, AC, CM and PZ led the integration of technologies. AP advised on psychosocial elements. LD and FIMA led the drafting of the manuscript which was reviewed and commented on by all authors.
Funding This work is supported by Swinburne University of Technology, Melbourne-Sarawak Research Collaboration Scheme-Digital Health Project (October 2016-September 2018).
Competing interests LD reports personal fees from Bionic Vision Australia (2014) and Guide Dogs Victoria outside the submitted work and is an executive member of the Orientation and Mobility Association of Australasia.
Patient consent Obtained.
Ethics approval Human research ethics committee at Swinburne University of Technology (SHR Project 2016/316).
Provenance and peer review Not commissioned; externally peer reviewed.