Article Text

Abstract
Objectives To evaluate survival curves (Kaplan-Meier) as a means of identifying areas in the clinical pathway amenable to quality improvement.
Design Observational before–after study.
Setting In Norway, annual public reporting of nationwide 30-day in-and-out-of-hospital mortality (30D) for three medical conditions started in 2011: first time acute myocardial infarction (AMI), stroke and hip fracture; reported for 2009. 12 of 61 hospitals had statistically significant lower/higher mortality compared with the hospital mean.
Participants Three hospitals with significantly higher mortality requested detailed analyses for quality improvement purposes: Telemark Hospital Trust Skien (AMI and stroke), Østfold Hospital Trust Fredrikstad (stroke), Innlandet Hospital Trust Gjøvik (hip fracture).
Outcome measures Survival curves, crude and risk-adjusted 30D before (2008–2009) and after (2012–2013).
Interventions Unadjusted survival curves for the outlier hospitals were compared to curves based on pooled data from the other hospitals for the 30-day period 2008–2009. For patients admitted with AMI (Skien), stroke (Fredrikstad) and hip fracture (Gjøvik), the curves suggested increased mortality from the initial part of the clinical pathway. For stroke (Skien), increased mortality appeared after about 8 days. The curve profiles were thought to reflect suboptimal care in various phases in the clinical pathway. This informed improvement efforts.
Results For 2008–2009, hospital-specific curves differed from other hospitals: borderline significant for AMI (p=0.064), highly significant (p≤0.005) for the remainder. After intervention, no difference was found (p>0.188). Before–after comparison of the curves within each hospital revealed a significant change for Fredrikstad (p=0.006). For the three hospitals, crude 30D declined and they were non-outliers for risk-adjusted 30D for 2013.
Conclusions Survival curves as a supplement to 30D may be useful for identifying suboptimal care in the clinical pathway, and thus informing design of quality improvement projects.
- STATISTICS & RESEARCH METHODS
- STROKE MEDICINE
This is an Open Access article distributed in accordance with the Creative Commons Attribution Non Commercial (CC BY-NC 4.0) license, which permits others to distribute, remix, adapt, build upon this work non-commercially, and license their derivative works on different terms, provided the original work is properly cited and the use is non-commercial. See: http://creativecommons.org/licenses/by-nc/4.0/
Statistics from Altmetric.com
Strengths and limitations of this study
-
This is the first study to describe the use of survival (Kaplan-Meier) curves to tailor improvement programmes for hospitals with significantly higher risk-adjusted 30-day mortality, following public reporting of national quality indicators for selected medical conditions.
-
Simple, easy-to-do statistics visualised increased mortality along the clinical pathways in-hospital and post-discharge.
-
The findings are strengthened by the focus on condition-specific measures, and by using patient administrative data from all Norwegian hospitals, linked with the National Registry, to obtain all in-hospital and out-of-hospital deaths.
-
To what extent the association between the observed improvement and the interventions represents a causal relationship is not possible to assess due to the observational design and the limited follow-up period.
-
Formal comparisons of the survival curves have been made by log-rank tests.
Introduction
Many countries, regions and healthcare trusts publish hospital quality indicators that are based on the number of deaths within a standardised follow-up period.1–6 Three condition-specific indicators are published for Norwegian hospitals: first time acute myocardial infarction (AMI), cerebral stroke and hip fracture. Calculations use patient administrative data (PAD) from all hospitals and deaths from all causes occurring in-and-out-of-hospital within 30 days of admission. The Norwegian Knowledge Centre for the Health Services (NOKC) performs the analyses and the results are published on the website of the Norwegian Directorate of Health (NDH), as part of the Norwegian Quality Indicator System authorised by the Ministry of Health.7 Rather than publishing case-mix adjusted 30-day mortality, the corresponding 30-day survival is given for each hospital per medical condition.
The first publication was in 2011 for the reporting year 2009 and comprised a total of 61 hospitals, of which 56 admitted patients with AMI, 54 admitted patients with stroke and 51 admitted patients with hip fracture.8 Hospitals with statistically significant higher/lower case-mix adjusted 30-day mortality compared with the hospital mean were identified for each condition by logistic regression. No additional results were presented to the hospitals and neither guidance on interpretation of the quality indicators nor in-depth analyses were prepared ahead of the publication.
The intention of the Norwegian reporting system is not to provide inter-hospital rankings, but to flag hospitals with potential quality challenges. Hospitals with excess mortality should be encouraged to initiate further inquiries to reveal or debunk possible presence of suboptimal care.1 In the literature, comprehensive improvement programmes and experiences have been reported for hospitals identified as outliers.9–11 Much effort can be put into quality improvement projects but the degree of success may vary depending on, for instance, the context for which they are developed. When a hospital has sparse information, as was the case for the Norwegian hospitals, no intervention should be undertaken without exploring the data at hand. Data exploration is a first step to ensure efficacious quality improvements that ideally should be developed through iterations of innovation and testing.12 ,13 However, there is limited knowledge as to how data that form the basis for nationwide indicators can be explored to inform internal improvement projects at a single hospital.
The considerable media attention where newspapers pointed at the low performing outliers and the awareness of the hospital staff prompted further inquiries for data analyses by three outlier hospitals. Besides tabulation of summary statistics (mean, SD, counts, proportions, etc), visualisation is an effective tool for exploring data and results. For indicators based on the number of deaths within 30 days, the dimension of time to death within the period is usually neglected. A well-known descriptive method for time-to-death (survival) data is to plot the Kaplan-Meier estimate of the survival function.14–16 A Kaplan-Meier curve for an outlier hospital is likely to visualise the point in time when its survival profile apparently begins to deviate from other hospitals. In the hospital setting, the y axis of a Kaplan-Meier plot displays the cumulative probability of surviving a given time and the x axis displays time. At time 0, all patients are alive. The curve stays horizontal until the first event (death), where the curve drops vertically to the level displaying the remaining proportion of patients at risk of dying. The curve remains horizontal until the next event where the curve again drops vertically and so on. Thus, the steps of the curve visualise when the deaths occur. The vertical distances between horizontals display the change in cumulative probability over time. A major drop will reflect a time interval during which many patients die. When describing the data for an outlier hospital, the Kaplan-Meier profile of an outlier hospital may thus reveal important information: was the hospital an outlier immediately from time of admission or did the profile diverge from other hospitals at the end of the 30-day period, or was the outlier profile simply evolving continuously throughout the 30-day period. High mortality immediately following hospitalisation may require different improvement actions compared with excess mortality revealed at the end of the 30-day period. When a hospital initiates quality improvements aimed at specific parts of the clinical pathway in order to reduce mortality, the effect may thus be visualised by Kaplan-Meier curves for the preintervention and postintervention periods.
The aim of the present study was to evaluate whether survival curves (Kaplan-Meier) could help hospital staff identify phases in the clinical pathway with excess mortality and thus support tailoring of improvement programmes to reduce mortality. Three hospitals that asked for in-depth analyses following identification as outliers by the first national reporting of 30-day mortality included Telemark Hospital Trust Skien (AMI and stroke), Østfold Hospital Trust Fredrikstad (stroke) and Innlandet Hosptial Trust Gjøvik (hip fracture). The results before and after initiation of quality improvements are reported. The public reporting in 2011 was for the reporting year 2009. Thus, data for 2008–2009 constituted the ‘before’ period. Improvement initiatives were initiated in 2011 and data for 2012–2013 were used for the ‘after’ period.
Methods
Data sources for condition-specific 30-day mortality
PAD from all Norwegian somatic hospitals were used. Each data record comprised a ward stay for a patient and contained variables for type of admission (acute or elective), coded medical diagnoses and medical procedures, and date and time of admission and discharge. Status (dead/alive) for all patients was provided by the National Registry.17 Age and gender were provided by both data sources. Where there was a mismatch, the values from the National Registry were used. Use of a unique patient record key and an encrypted version of the personal identification number that all permanent residents in Norway have, enabled the merging of PAD and status. Thus, medical information from current and previous hospitalisations, date of death (occurring in-or-out-of hospital) and tracing of patients between hospitals was available.
Inclusion and exclusion criteria for condition-specific 30-day mortality
For a patient, an episode of hospital care constituted a single ward stay or was constructed by linking subsequent admissions if time from discharge to admission at another ward was within 8 h. For a patient admitted to another hospital within 8 h (transferred patient), the episode of care comprised information from both hospital stays. Among all episodes of care, we identified acute admissions for first time AMI, stroke and hip fracture, according to the International Classification of Diseases (ICD-10),18 and included/excluded according to age and previous admissions, table 1.
Inclusion and exclusion criteria for episodes of care, acute admissions only
To ensure a sufficient number of events per hospital, hospitals with less than 20 patient admissions per year for the actual medical condition were excluded. This limit was pragmatic as for very small hospitals the variation due to random noise may conceal effects caused by, for instance, suboptimal care.
Calculating condition-specific 30-day mortality as a quality indicator
For each medical condition, the outcome, that is, patient status of dead/alive, was modelled by logistic regression of hospitals and case-mix variables. For transferred patients, status was assigned to each hospital by the fraction of time (within the 30-day period) spent in each hospital to ensure use of all admissions and attributing the outcome to all hospitals involved in the episode of care.19 The hospitals were modelled as fixed effects by indicator variables.20 ,21 To adjust for differences in hospital population the following case-mix variables were included: age, gender, number of previous hospital admissions 2 years prior to actual admission, as well as the Charlson comorbidity index.22 The latter was calculated from previous admissions 3 years prior to, but did not include, the current episode of care. The reason for this was that a patient with a longer hospital stay is likely to have recorded more diagnoses than a patient who is discharged or dies within a few days. For patients with stroke, the logistic model also included type of stroke (infarction or haemorrhage). Age was modelled by natural splines. Fractional polynomials were used for number of previous admissions and the Charlson index.21
Many of the Norwegian hospitals are small and, accordingly, large variations can be expected. Thus, to ensure a reasonable number of events, data from previous years are included by a linear trend.23 The calculation of 30-day mortality for 2009 included data from four previous years whereas data for two previous years were included for 2013. The regression coefficients for the hospitals were compared to the trimmed mean, that is, the mean was calculated by excluding the lowest and highest 10% of the coefficients. We used the Benjamini-Hochberg24 method for multiple testing, with a false discovery rate (fdr) of 0.05 to test for outlier status.
The analysis for the report year 2009 identified significantly higher (lower) mortality for 1 (6) of 56 hospitals admitting patients with AMI, 5 (0) of 54 hospitals admitting patients with stroke and 2 (0) of 51 hospitals admitting patients with hip fracture.8
In-depth analysis for outlier hospitals
Three outlier hospitals requested explorative analyses of their data to initiate quality improvements. To achieve a reasonable number of events (deaths) at the outlier hospitals, data for 2008 and 2009 were pooled, that is, the ‘before’ period. As the quality indicators for 2009 were published in June 2011, data for 2011 were excluded from the follow-up analyses. Accordingly, data for 2012 and 2013 were pooled, that is, the ‘after’ period. Age and length of stay (LOS) were summarised by means and SDs. Counts and percentages were used to summarise number of deaths within 30 days (crude mortality), number of patients treated at two or more hospitals, sex, number of previous admissions (pooled into categories 0, 1, 2, 3–10, and 11 and more) and Charlson index (pooled into categories zero (score=0), mild (score=1, 2), moderate (score=3, 4) and severe (score=5 and above)).
The Kaplan-Meier curves were made for the crude fraction of patients alive, that is, the fraction at risk of dying, and was plotted as a function of time during the 30-day follow-up period. Patients who had been transferred between hospitals were assigned to the first hospital in the chain of admissions. Log-rank tests were performed to test for difference in Kaplan-Meier estimates between an outlier hospital and the other hospitals for the ‘before’ period and for the ‘after’ period.25 Log-rank tests were also performed to compare the before–after results within each outlier hospital and within the other hospitals. The Kaplan-Meier curves were part of an explorative analysis based on a limited number of events in the outlier hospitals. Hence, no CIs or corrections for multiple comparisons were made. For AMI, hospitals performing percutaneous coronary intervention (PCI) were pooled in a separate group. For stroke, the Kaplan-Meier curves were split according to cerebral infarction and haemorrhage (no data shown for patients with haemorrhage) and per age group (below/above median age, ie, 78 years). Apart from these, no adjustment for differences in case-mix was made for the explorative analyses.
The analyses were performed with R, V.2.15.2 and V.3.0.3 (free software available at http://www.r-project.org).
Results
Hospital population characteristics
The number of patients and their case-mix were summarised per medical condition for the outlier hospitals and the pooled estimates for other hospitals, table 2. For Norwegian hospitals, the number of patients with first time AMI increased from 21 595 in 2008–2009 to 22 853 in 2012–2013. The total number of cases with main diagnosis of stroke (cerebral infarction), was 15 906 in 2008–2009 and 15 351 in 2012–2013. For hip fracture, the numbers were 17 419 in 2008–2009 and 16 949 in 2012–2013. The decline in crude 30-day mortality was larger for the outlier hospitals (percentage points range: 1.1–3.2) compared with the other hospitals (percentage points range: 0.3–0.8).
Hospital population characteristics
For the two stroke outlier hospitals, there was a major reduction in the number of patients out-transferred to other hospitals from 2008–2009 to 2012–2013: from 38.3% to 11.3% for Skien and from 29.1% to 7.9% for Fredrikstad. For other hospitals treating patients with stroke, this proportion was around 8–9% for both periods.
The distributions of gender and age were similar for the outlier hospitals compared with the other hospitals, except for Fredrikstad, where the mean age was 66.2 years in 2008–2009, which increased to 72.7 years in 2012–2013, compared to 75.2/74.9 years for the other hospitals for 2008–2009/2012–2013, respectively.
LOS declined for the three medical conditions from 2008–2009 to 2012–2013. The largest reduction was for patients with stroke at Skien, from mean LOS of 19.7 to 10.9 days. The shortest mean LOS was for Gjøvik for 2012–2013 (5.7 days).
Across the medical conditions and the various hospitals, 50% or more of the patients had no previous hospital admission. As the Charlson index was based on previous admissions, the majority, that is, 60% or more, had an index of zero.
Statistical comparison of Kaplan-Meier curves
For 2008–2009, the hospital-specific Kaplan-Meier curves differed from the curves based on pooled estimates of other hospitals figures 1–4. The difference between an outlier hospital and other hospitals before intervention was borderline significant for AMI, Skien (p=0.064), figure 1A, and highly significant (≤0.005) for the remaining conditions, figures 2A,B, 3A,B and 4A, according to the log-rank test, table 3. No difference was found after intervention. For the comparison of before and after within each hospital, Fredrikstad was significant (p=0.006). Kaplan-Meier estimates for the number at risk of death, the number of deaths and proportion survivors, aggregated into 2-day time intervals up to 20 days, and two 5-day intervals up to 30 days, are provided in online supplementary appendix A1.
p Values from log-rank test for the comparison of Kaplan-Maier estimates of actual hospital versus other hospitals and the comparison before versus after intervention within hospital(s)

Kaplan-Meier curves for patients with acute myocardial infarction admitted to Telemark Hospital Trust Skien, percutaneous coronary intervention (PCI) hospitals and other hospitals during 2008–2009 and 2012–2013.
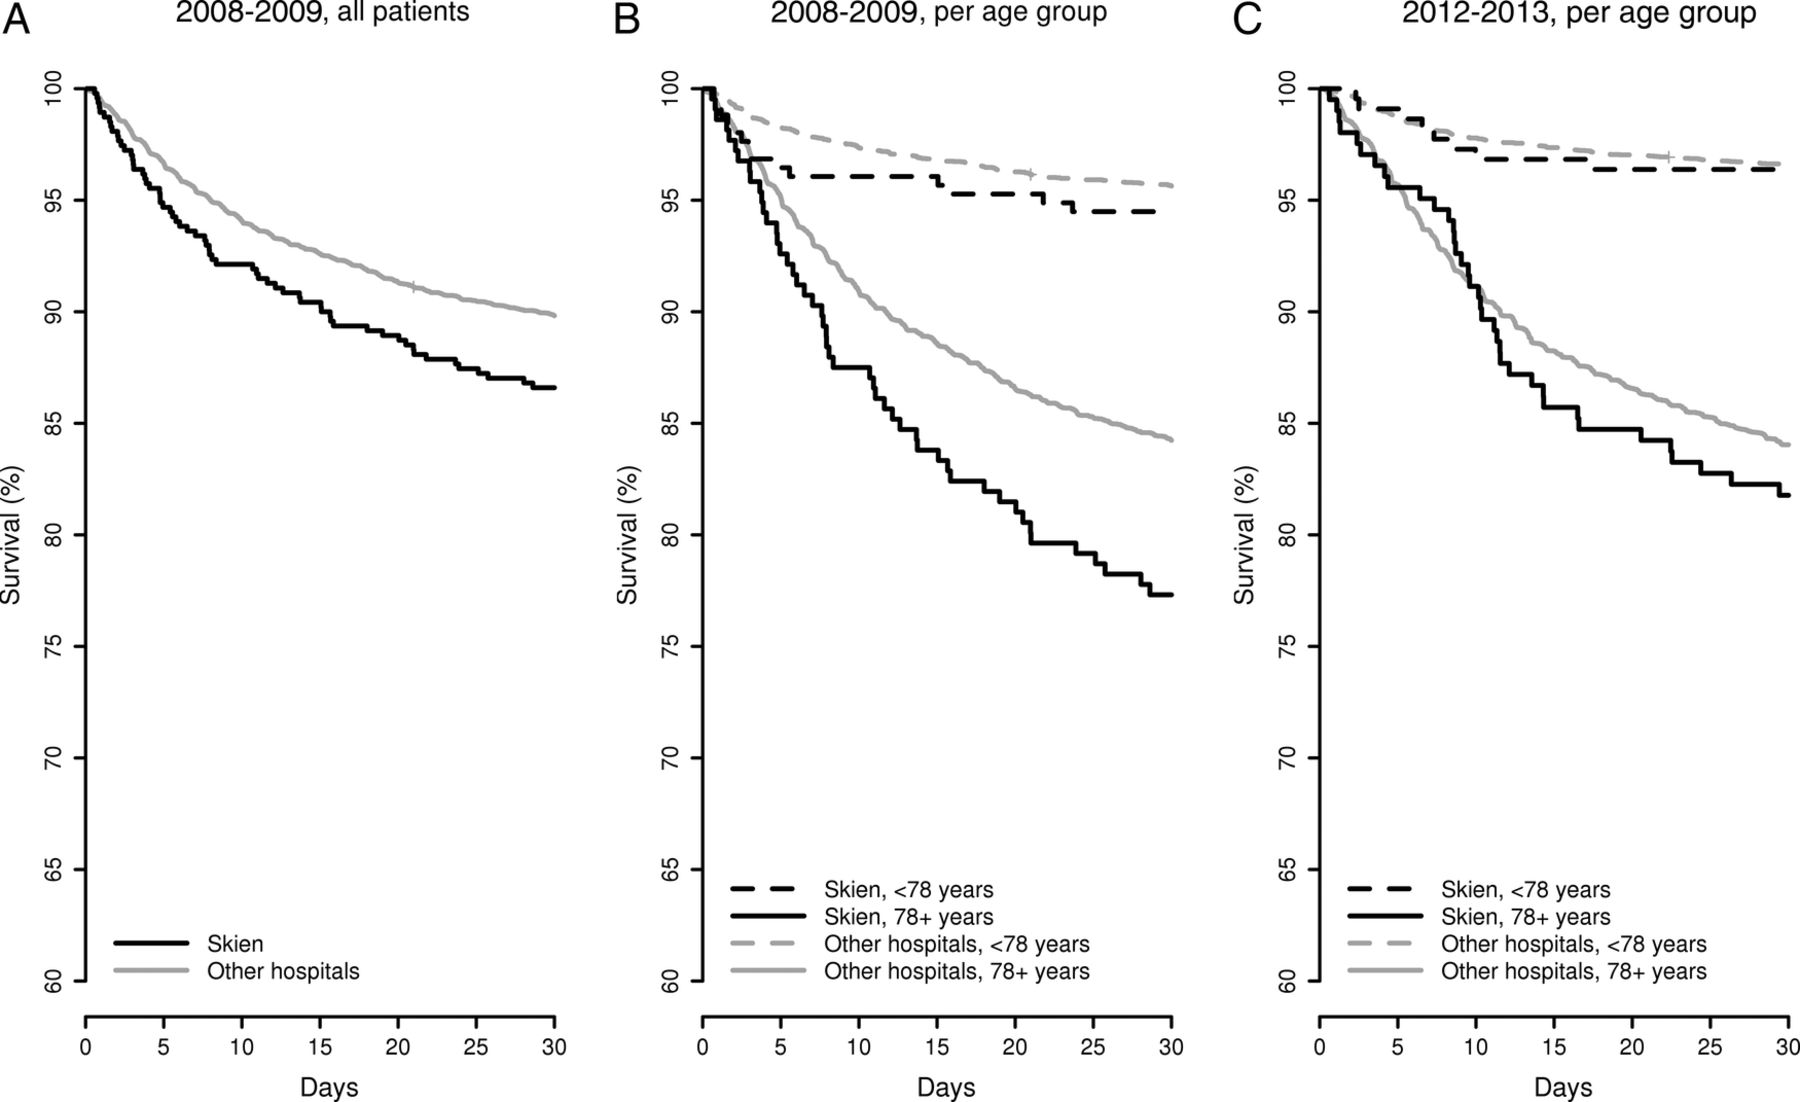
Kaplan-Meier curves for patients with stroke admitted to Telemark Hospital Trust Skien and other hospitals, overall for 2008–2009, and split per age group for 2008–2009 and 2012–2013.
The statistical analyses of risk-adjusted 30-day mortality reported as quality indicators for 2013 did not reveal the three hospitals as outliers;26 AMI Skien: mortality 12.05%, fdr=0.849; stroke Skien: mortality 13.72%, fdr=0.760; stroke Fredrikstad: mortality 14.37%, fdr=0.977; hip fracture Gjøvik: mortality 8.61, fdr=0.684.26
AMI and stroke (cerebral infarction), Telemark Hospital Trust Skien
For AMI 2008–2009, the Kaplan-Meier curve revealed excess initial mortality from time of admission and higher mortality maintained throughout the 30-day period, figure 1A. This was interpreted as an indication of suboptimal care during the initial phase of the clinical pathway affecting patient outcome. The hospital staff audited the medical records of all patients with AMI and initiated a process where adherence to guidelines was monitored. An improvement project aimed at better admission care and monitoring of patients was designed. This included:
-
Allocating beds in the intensive care unit (ICU) to cardiac patients to compensate for previous closure of a coronary care unit.
-
Following the ambulance ECG, sending patients with ST-elevated myocardial infarction or cardiac arrest directly to a PCI hospital rather than examining them at Skien first (already implemented at the time of reporting in 2011).
-
Implementing, from 01 Jan 2012, the revised European guidelines for the treatment of AMI.27 ,28
-
Monitoring clinical practice by joining the Norwegian Myocardial Infarction Register.29
For the patients admitted to Skien, the Kaplan-Meier curve for 2012–2013, figure 1B, indicated that the mortality was reduced to the national level up to about days 5–8 after admission. There was a small, temporary drop around day 5, but during days 8–12 a more substantial drop appeared to occur. For the remaining part of the 30-day period, the profile was similar to the other hospitals. The reduction in mortality may be associated with the improvement initiatives during the initial phase of the clinical pathway, that is, direct transport to a PCI hospital without examination at the local hospital for all patients with ST-elevation, and increased use of coronary beds in the ICU accompanied by implemented guidelines.
For patients with stroke, the Kaplan-Meier 2008–2009 curve for Skien revealed decreasing survival compared with the other hospitals throughout the 30-day period, figure 2A. When stratified according to age, there was a drop in survival from around day 5, followed by yet another drop around day 8, which persisted throughout the remaining part of the period for the oldest patients (≥78 years) compared with the other hospitals, figure 2B. This was thought to indicate problems further on in the clinical pathway. The latter drop might be interpreted as suboptimal care coordination or poorer community care after hospital discharge. As for AMI, it was difficult to assess the number of patients treated in accordance with internal and external guidelines, for example, fraction of patients receiving thrombolysis. The initiatives for quality improvement included:
-
Making the stroke unit a national pilot for the stroke initiative of the Norwegian National Patient Safety Campaign30 based on national guidelines for stroke.31
-
Implementing a detailed clinical pathway based on elements from the campaign, with checklists and reminders for the hospital staff.
-
Healthcare staff meeting people at shopping centres to provide information regarding stroke symptoms and the importance of rapid hospitalisation after onset of symptoms as this is highly important for the outcome.32
-
Monitoring clinical practice by joining the Norwegian Stroke Registry.33
-
Arranging an appointment with their general practitioner for follow-up after 2 weeks for patients discharged home before they leave the hospital.
The Kaplan-Meier curve for 2012–2013 showed survival at the national level throughout the whole period for the youngest patients. For the oldest patients the survival was at the national level up to about 11 days and somewhat lower during the remaining part of the period, figure 2C. However, when looking at the profile for the oldest patients at Skien there is an even more marked drop in survival of about 8–12 days after start of admission than seen for 2008–2009. The curve for 2012–2013 suggested that the initiatives thought to affect the initial phase may have contributed to improved survival, particularly for the oldest patients. We believe that the increased attention to treatment and follow-up of patients with stroke resulted in increased use of thrombolytic therapy. According to regional results from the Stroke registry, released in September 2014, Skien has the highest percentage of patients with cerebral infarction who receive thrombolytic therapy among the hospitals within the South-Eastern Norway Regional Health Authority. This proportion has increased from approximately 5% to 25% (January–April 2014).
Stroke (cerebral infarction), Østfold Hospital Trust Fredrikstad
Patients with stroke from the catchment area of Østfold Hospital Trust were admitted to two locations, Fredrikstad (having a stroke unit) and Moss (without a stroke unit) in 2008–2009. Fredrikstad had a significantly lower survival for 2008–2009 according to the national quality indicator; Moss was a non-outlier. For Fredrikstad, the Kaplan-Meier curve for 2008–2009 showed a small drop during 2–10 days, which then normalised, compared with the other hospitals, figure 3A. However, stratifying according to age revealed significantly lower survival for patients with cerebral infarction aged 78 and older, whereas the survival for patients less than 78 years of age was at the national average, figure 3B. According to the triage protocol, the oldest patients were admitted to a general medical department at Fredrikstad and not the stroke unit. Moss admitted younger patients. Following the publication of 30-day mortality for 2009 and meetings where the Kaplan-Meier curves were discussed, the Østfold Hospital Trust decided to change the prehospital protocol. All patients, regardless of age, were to be admitted to the stroke unit at Fredrikstad, as treatment in a stroke unit is associated with improved survival and better recovery.34 ,35 The capacity of the stroke unit was increased accordingly and no patient with stroke was to be admitted to Moss. The mortality decreased substantially within 6 months, and was at the national level for 2012–2013, figure 3C. This organisational change had been considered ahead of the publication of 30-day mortality, but the process was speeded up by the supplementary information from the Kaplan-Meier curves.

Kaplan-Meier curves for patients with stroke admitted to Østfold Hospital Trust Fredrikstad and other hospitals, overall for 2008–2009 and split per age group for 2008–2009 and 2012–2013.
Hip fracture, Innlandet Hospital Trust Gjøvik
The Kaplan-Meier curve for patients with hip fracture showed increased mortality in the perioperative period for the years 2008–2009, figure 4A. The orthopaedic department at Gjøvik performed elective orthopaedic procedures until 2007, when the capacity was extended to include acute admissions of patients with hip fracture. There had been concern about cases of suboptimal care, for example, delay of surgery. At the time of publication of 30-day mortality, a checklist to secure adequate perioperative care to standardise and improve the treatment of these patients had been implemented. A retrospective analysis of the medical records from 2009 and up to time of publication was carried out and trends for improved survival were found in the recent data for 2010–2011. The hospital reinforced the ongoing quality initiative and no further systematic improvement project was undertaken. The mortality was at the national level for 2012–2013, figure 4B.

Kaplan-Meier curves for patients with hip fracture admitted to Innlandet Hospital Trust Gjøvik and other hospitals during 2008–2009 and 2012–2013.
Discussion
The public reporting of 30-day condition-specific mortality for Norwegian hospitals identified hospitals with excess mortality rates. Exploring data for three outlier hospitals by survival curves showed diverging mortality compared with other hospitals during the 30-day period. The profile of the survival curves identified parts of the clinical pathway with elevated mortality. This information was used to: tailor improvement programmes aimed at the corresponding phases in the pathway, centralisation of units and reinforcement of an ongoing quality initiative. Following the interventions, the survival profiles were similar to the profile of the other hospitals, declines in crude mortalities were larger than for the other hospitals and the hospitals were non-outliers in the public reporting for 2013.
When using a hospital-wide quality indicator, it may be hard for a hospital to grasp reasons for its outlier status. By using a condition-specific indicator, an outlier hospital can focus on the clinical pathways for the condition at hand. However, it may still be a challenge to identify the specific areas for improvement when no additional information is available. Time to death is highly important information in regard to the interpretation of a mortality-based indicator. Graphical presentation was thought to provide more actionable data to the hospital staff by36 visualising the point in time for when its survival profile apparently began to deviate from other hospitals. The log-rank test found statistically significant differences in the profiles before the intervention when comparing outlier and other hospitals; no difference afterwards. The testing was for the 30-day period and did not provide statistical evidence for the point in time when the drop was significant. Apparent drops may be due to random variation because of the small number of events. Visualisation is convincing but may also mislead the reader. Simple manipulations of the axis limits may change the perception of the results displayed. In a quality improvement setting, where the hospital has no idea of where to search for possible areas of improvement, use of Kaplan-Meier curves may give a hint as to where to start. In the present study, when the survival curve suggested that the hospital was an outlier from start of admission, the clinical staff identified possible areas of improvement, in the beginning and subsequently, of the clinical pathway for the medical condition evaluated. This was found to be useful for designing the quality improvement projects. When the profile changed after time of discharge it was hypothesised that better care coordination might be helpful. Aspects of the latter have not been assessed in this study. If excess deaths are indicated by the survival curve close to time of admission, it is more likely to be associated with the initial treatment than for deaths occurring several days after discharge.
The study findings were strengthened by the use of data from all Norwegian hospitals and the National Registry. This ensured counting of all deaths occurring in-hospital and out-of-hospital within 30 days of hospitalisation and associated with hospital care. If 30-day mortality is calculated solely from in-hospital deaths, hospitals discharging patients early may seem to perform better than hospitals with longer patient stay, as out-of-hospital deaths would have been counted as survivors. For stroke, at Telemark Hospital Trust Skien, elevated mortality occurred during the post-discharge part of the 30-day follow-up period. This showed the potential of including out-of-hospital deaths, as these deaths may reflect a need for improved interaction between hospital-based and community-based services taking care of patients after hospital discharge.
Condition-specific 30-day mortality is arguably more appropriate than overall hospital mortality for identifying challenges related to patient safety and quality.1 Internationally, hospital standardised mortality ratio (HSMR) based on the diagnoses leading to 80% of all deaths within 30 days (overall mortality), is commonly used as an overall metric for benchmarking hospitals.1 ,37 ,38 When using a system-level metric such as HSMR, the hospitals tend to put forth a comprehensive programme that explores all parts of their activity to reduce overall hospital mortality rates, rather than focusing on improving specific parts of the clinical pathway for selected medical conditions.39 It might be that hospitals with suboptimal condition-specific 30-day mortality have a similar pattern in their survival curves that indicates a generic cause of an increased mortality. The different patterns for the two stroke hospitals in the present study, however, indicate that there are differences between outlier hospitals that should be reflected in the quality improvement protocols.
An important limitation of this study is the short follow-up period. The before–after comparisons have been performed by considering 2011 a wash-out period, that is, by excluding all data for 2011. Any causal relationship between the observed improvement and the interventions is difficult to assess. The improvements may be attributed to initiatives other than those initiated by the use of the survival curves, for example, the use of a checklist, as initiated at Innlandet Hospital Trust Gjøvik ahead of the public reporting.
The observed reduction in mortality may have been due to the statistical phenomenon regression to the mean, that is, an extreme observation in one time period will tend to move towards the population mean in the next.40 It should, however, be noted that the annual calculation of 30-day mortality for public reporting in Norway includes data from 2 years prior to actual year by a linear trend,23 which reduce the regression-to-the-mean effect, but may be too conservative for outlier detection. The time lag between the actual time of data inclusion and publication of results is a well-known challenge for the usefulness of quality indicators such as 30-day mortality. It is unknown whether a hospital identified with elevated rates might be performing better at the time of publication and vice versa. This distracts from the clinical usefulness of 30-day mortality. However, used as a trigger for further inquiry, as reported in this study, 30-day mortality visualised by Kaplan-Meier curves can provide valuable information to clinicians.
The history of the use of hospital mortality statistics as a quality indicator includes public inquiries initiated on the basis of increased mortality. Some have been the subject of massive media attention, such as the Bristol Case,41 the temporary closure of the Radboud University Nijmegen Medical Center,42 and the Pediatric Cardiac Surgery Program at Winnipeg Health Sciences Centre.43 The inquiries focused on cultural challenges such as “lack of leadership, ‘an old boys’ culture’ among doctors, a lax approach to safety, secrecy about doctors’ performance and a lack of monitoring by management”.44 Although these incidents happened decades ago, few initiatives have tried to address the underlying cultural problems. The process following the Mid-Staffordshire case45 may represent a shift.45 The report addressed factors that are likely to be of importance for the safety and quality of care and presented suggestions for improvement.46 The need for stronger focus and leadership to achieve improved patient safety was also reported by the inquiry following the increased mortality in NHS Lanarkshire, Scotland.47
Methods are available for the development and implementation of internal quality improvement initiatives, but there is considerable variation in the results achieved.48 The regular publication of hospital metrics and the subsequent media attention in Norway have so far contributed to a call for corrective actions to be taken by outlier hospitals. The present study demonstrated the potential of using 30-day mortality in quality improvement work when the hospitals, that is, both management and clinicians, took ownership of their results and initiated improvement initiatives.49 The experience from Telemark Hospital Trust Skien indicated that the exploration and visualisation of data improved the planning phase of the improvement projects and increased clinical engagement. This contributed to alter how the clinicians perceived 30-day mortality—from a rejection and critique to a demand for exploring the data. Skien also experienced that media changed focus from critical to supportive.
Several of the implementations of new routines were carried out over a longer time span for Telemark Hospital Trust Skien compared to the structural change at Østfold Hospital Trust. The latter initiative was driven by the management and the hospital board, and proved to be effective in a short time in contrast to what can be expected when implementing new ward routines that involve cultural changes as well. Structural changes may be upsetting. However, the results from Østfold Hospital Trust suggested the importance of organisation according to best practice.34 The types of interventions the three hospitals undertook are common,9 and the survival curves were useful for targeting (and restricting) the activities put forth. It is challenging to initiate a comprehensive hospital-wide improvement project and achieve results that persist so that new initiatives become routine. The success depends on many factors, including effective leadership and clinical champions, adequate financial and educational resources, and dedicated promotional activities.50 The staff at Innlandet Hospital Trust Gjovik found the use of checklists to be effective, but mixed experiences have been reported by this common initiative, for example, the introduction of surgical checklists in Ontario was not associated with significant reduction in mortality or complications.51 Superficial adherence to checklists does not achieve anything and the clinicians have to pay attention to all items to succeed.
In addition to the publication of 30-day condition-specific quality indicators for 2013, NOKC also generated reports of Kaplan-Meier curves, summary statistics and trend curves for the 30-day indicators for the latest 5-year period. The trend curves enable each hospital to follow its development over time whereas the quality indicators provide outlier status versus the other hospitals.52 The use of Kaplan-Meier curves is still in an explorative phase and should be further evaluated and developed in a larger setting. NOKC has also started to support hospital guidance material, starting with hip fracture.53
Conclusion
The awareness that followed public reporting of 30-day condition-specific mortality revealed a strong need for in-depth analyses to inform outlier hospitals in the process of initiating relevant actions to reduce mortality. Survival curves as a supplement to 30-day mortality may be used as a diagnostic tool to identify suboptimal care, and thus be useful for designing quality improvement projects and informing ongoing projects. To what extent the association between the observed improvement and the interventions represents a causal relationship is not possible to assess due to the observational design and limited follow-up period.
Acknowledgments
The authors thank the hospitals for kindly submitting data. They are grateful to the hospital staff for input on ongoing practices and auditing of medical records: in particular Håkon Tobro and Per Urdahl at Skien, and Øyvind Sletten at Gjøvik. Statistics Norway provided date of death from the National Registry. Tomislav Dimoski developed the system for collecting data from 2009 and earlier from the patient administrative data systems of the hospitals (‘FS-systemet’). The Norwegian Patient Registry provided patient administrative data for 2010–2013. The authors also thank Katrine Damgaard and Sahar Hassani for assisting in the preparation of data files and Andrew Garret for valuable language input.
References
Supplementary materials
Supplementary Data
This web only file has been produced by the BMJ Publishing Group from an electronic file supplied by the author(s) and has not been edited for content.
Files in this Data Supplement:
- Data supplement 1 - Online supplement
Footnotes
-
Contributors All authors have participated in the interpretation of data and results. JT and DC performed retrospective analyses of medical records. HPW coordinated the quality improvement projects at Skien. OT was involved in the quality initiatives at all three hospitals. JH, DTK and ASL performed data preparation and analysis of 30-day mortality. DTK and JH performed survival analyses. OT, DTK and LHR drafted the first version of the manuscript. All authors contributed to revised versions, read and approved the final manuscript.
-
Funding This work was carried out by the Norwegian Knowledge Centre for the Health Services (NOKC) and the hospitals: Telemark Hospital Trust Skien, Østfold Hospital Trust and Innlandet Hosptial Trust Gjøvik.
-
Competing interests None.
-
Ethics approval The Norwegian Data Inspectorate and the Ministry of Health approved the data collection for 30-day mortality. Ethical approval was not necessary according to the Regional Ethics Committee, as existing data were employed for quality improvement purposes.
-
Provenance and peer review Not commissioned; externally peer reviewed.
-
Data sharing statement No additional data are available.