Article Text

Abstract
Purpose Several non-pharmaceutical interventions, such as physical distancing, handwashing, self-isolation, and school and business closures, were implemented in British Columbia (BC) following the first laboratory-confirmed case of COVID-19 on 26 January 2020, to minimise in-person contacts that could spread infections. The BC COVID-19 Population Mixing Patterns Survey (BC-Mix) was established as a surveillance system to measure behaviour and contact patterns in BC over time to inform the timing of the easing/re-imposition of control measures. In this paper, we describe the BC-Mix survey design and the demographic characteristics of respondents.
Participants The ongoing repeated online survey was launched in September 2020. Participants are mainly recruited through social media platforms (including Instagram, Facebook, YouTube, WhatsApp). A follow-up survey is sent to participants 2–4 weeks after completing the baseline survey. Survey responses are weighted to BC’s population by age, sex, geography and ethnicity to obtain generalisable estimates. Additional indices such as the Material and Social Deprivation Index, residential instability, economic dependency, and others are generated using census and location data.
Findings to date As of 26 July 2021, over 61 000 baseline survey responses were received of which 41 375 were eligible for analysis. Of the eligible participants, about 60% consented to follow-up and about 27% provided their personal health numbers for linkage with healthcare databases. Approximately 83.5% of respondents were female, 58.7% were 55 years or older, 87.5% identified as white and 45.9% had at least a university degree. After weighting, approximately 50% were female, 39% were 55 years or older, 65% identified as white and 50% had at least a university degree.
Future plans Multiple papers describing contact patterns, physical distancing measures, regular handwashing and facemask wearing, modelling looking at impact of physical distancing measures and vaccine acceptance, hesitancy and uptake are either in progress or have been published.
- COVID-19
- PUBLIC HEALTH
- Health & safety
- Epidemiology
Data availability statement
Data are available upon reasonable request.
This is an open access article distributed in accordance with the Creative Commons Attribution Non Commercial (CC BY-NC 4.0) license, which permits others to distribute, remix, adapt, build upon this work non-commercially, and license their derivative works on different terms, provided the original work is properly cited, appropriate credit is given, any changes made indicated, and the use is non-commercial. See: http://creativecommons.org/licenses/by-nc/4.0/.
Statistics from Altmetric.com
STRENGTHS AND LIMITATIONS OF THIS STUDY
The sample size for this study is larger than comparable studies.
Our methodology allows us to consider many auxiliary variables to enhance the representativeness of our sample to the general population.
We employ an efficient and cost-effective recruitment strategy providing real-time data.
Some population groups are under-represented in the survey possibly due to lack of access to social media.
Our survey responses may be subject to recall bias since we ask respondents to recall contacts and other behaviours or activities from the previous day.
Introduction
The novel COVID-19, caused by SARS-CoV-2, has spread worldwide since December 2019. A global pandemic was declared by the WHO in March 2020 and, as of July 2021, there have been over 200 million cases of COVID-19 infections and over 4.3 million resultant deaths globally.1 As the roll-out of COVID-19 vaccines continues at varying rates worldwide, physical distancing measures2 remain among the most effective methods for COVID-19 prevention and control.3 Many governments have put in place physical distancing measures such as travel restrictions, closure of schools and workplaces, and the banning of large group gatherings to interrupt the transmission of SARS-CoV-2. These measures attempt to reduce contact between infected and healthy individuals in order to minimise disease spread and the impact on the healthcare system.
British Columbia (BC) is located on the West Coast of Canada and covers almost a million square kilometres. It has a diverse population of approximately 5.15 million as of 1 July 2020.4 Public health officials in BC began urging the public to practise physical distancing and avoid any non-essential travel in early March 2020. By 17 March 2020, a public health emergency was declared in the province and various physical distancing measures were implemented.5 These included restriction of indoor and outdoor gatherings, closure of businesses that were unable to meet physical distancing measures, self-isolation requirements after travelling outside the country and general physical distancing in all public space.
Assessing the impact of physical distancing measures on person-to-person contact can provide valuable information for refining control measures and help minimise both COVID-19-related disease burden and the related economic, social, and mental health impacts. Although methods such as mathematical modelling can estimate the potential for resurgence, these methods often lack population-based empirical data on contact patterns, especially on the varying levels of contact patterns exhibited by different demographic groups in the population. These population-specific data could better inform mathematical models by incorporating explicit knowledge of contact patterns that are driving transmission rather than inferring these from reported cases and hospitalisation.6–8 Ultimately, they serve as an evidence base to guide targeted measures that are amenable to actions by the government to ensure that the COVID-19 cases remain below the resurgence thresholds.
Various studies have assessed the impact of physical distancing measures imposed by governments on local contact patterns and behaviours during the COVID-19 pandemic in Belgium,8 Greece,9 Kenya,10 Luxembourg,11 the Netherlands12 and the UK.13 Others include Verelst et al’s SOCRATES-CoMix Study14 and a rapid review of social contact patterns by Liu et al.15 Such surveys can measure the public’s compliance with physical distancing measures and provide valuable information to inform other public health measures that may be necessary to avoid further waves of COVID-19 infections. In addition, the impact of physical distancing measures on mixing patterns and contact behaviours may vary across different age groups, and by individuals’ primary place of activity such as schools or workplaces.9 16–18
Here, we describe the development of the BC COVID-19 Population Mixing Patterns Survey (BC-Mix), an ongoing online survey to monitor and assess social contact behaviours and mixing patterns in BC, Canada, during the COVID-19 pandemic. We detail the development of the survey and recruitment of respondents, as well as the characteristics of the participants.
Cohort description
Survey design and methodology
The BC-Mix (http://www.bccdc.ca/our-research/projects/bc-mix-covid-19-survey; https://a4ph.med.ubc.ca/projects-and-initiatives/bc-mix/) uses a cross-sectional survey design with longitudinal follow-up. Eligible population includes residents of BC who are at least 18 years of age. The survey began on 4 September 2020, and as at the time of this publication, is still ongoing. Once a participant has completed the survey for the first time, they are invited for repeated follow-up. The first-time responses are referred to as the ‘baseline’. Participants responding to the baseline survey are invited to complete the first follow-up survey after 2 weeks. Subsequent follow-up surveys are then sent in 4-week intervals, following the completion of the previous survey.
Participant recruitment
To capture participants from a broad demographic range, the survey invitation is disseminated through Instagram, Facebook, YouTube, WhatsApp, Twitter and Google search engine results pages. The Google Ads Audience manager and Facebook Ads manager allow for paid advertisements to be targeted at specific audiences. We use these tools to target the survey advertisement campaigns to only residents of BC who are 18 years and above. We also monitor the demographic profile of survey participants and occasionally use these functions to target recruitment of certain age groups or sex that may be under-represented using the BC population as our point of reference.19
To help capture under-represented groups, we promote the survey to various ethnic populations. For instance, a South Asian community organisation promotes the survey on their social media pages and also sends the survey to individuals on their mailing list. Although the survey is in English, it is also promoted in different languages (specifically, Korean and Farsi) to members of minority community groups in BC on their social media pages. Flyers are also distributed at grocery stores and restaurants particularly including those frequented by minority groups.
Patient and public involvement
The initial version of the BC-Mix was first piloted with a randomly selected sample of the BC population and feedback received was incorporated in the final version before the official launch of the survey. Methods of recruitment and priority of research questions were also informed by discussions with members of the public and with a community group. We also receive input from survey participants on an ongoing basis through a dedicated email address. We plan to create dashboards and other infographics of the study results on the study’s website.
Survey domain and case definitions
The BC-Mix survey instrument was adapted from the POLYMOD Study17 and the Berkeley Interpersonal Contact Study (BICS),20 and was administered through Qualtrics,21 an online survey tool. The baseline survey comprises 94 questions across six key domains:
Demographic information: this domain includes age, sex, gender, ethnicity, education, employment, household characteristics and postal code.
COVID-19 testing and results, symptoms and health behaviours: this domain captures COVID-19 testing information, symptoms and behaviours such as doctor visits following symptoms.
Activities and behaviour in and outside of the home: this domain captures social contact and mixing behaviours such as number of contacts, location and duration of contact during the past 24 hours. Other questions in this domain include age and sex of contact, and relationship of respondent to the contact persons, physical distancing behaviour (eg, handwashing) and personal protective equipment use. Initially, respondents were asked to provide this information for up to three of their reported contacts. We began collecting data on the characteristics of up to 10 contacts from 11 December 2020. Also from 11 December 2020, we began collecting general information about greater than 10 contacts, that is, if a participant reports more than 10 contacts per day, they are asked general questions about these contacts for, for example, age group, duration and location of the majority of those contacts. If majority of contacts took place at a workplace setting, a follow-up question asks respondents to report the type of work setting where the contacts occurred.
Internet and social media use: this domain captures information on internet and social media use, such as most frequently used platform and frequency of use.
Perceptions and attitudes around COVID-19: this domain measures the respondent’s perception of physical distancing measures, and their self-confidence or ability to carry them out.
COVID-19 vaccine acceptance subquestionnaire: this subquestionnaire was added on 8 March 2021. Items from this domain were developed using a vaccine acceptance behavioural framework, which synthesises constructs from the Theory of Reasoned Action (TRA),22 Theory of Planned Behavior (TPB)23 24 and the Health Belief Model (HBM),25 to understand and predict the uptake of COVID-19 vaccine. According to the TRA, the best single predictor of behaviour is an individual’s intention.26 Intentions, in turn, are an outcome of the individual’s attitude toward performing the behaviour in question, and/or the individual’s perceptions of support from family and friends (subjective norms) for engaging in the behaviour.27 Perceived control or self-efficacy, the confidence that one has the ability to perform the intended behaviour,28 is another important construct taken from TPB. The TPB assumes that an individual’s perception of whether they can successfully engage in a particular behaviour often has a direct effect on their intentions, such as getting a vaccine.29 The widely used HBM has previously been used to evaluate beliefs and attitudes toward seasonal influenza and pandemic swine influenza vaccines as well as the COVID-19 vaccine.30–33 Relevant constructs from HBM were applied to develop questionnaire items to assess perceived threat of contracting the COVID-19, perceived severity of disease if infected and belief in the safety and effectiveness of getting the vaccine. Overall, this subquestionnaire is meant to provide an understanding of some of the individual-level health beliefs, perceptions and attitudes that may influence vaccine uptake. The vaccine acceptance subquestionnaire has the following domains: Attitude (perceived susceptibility, severity, benefits and barriers), Descriptive and Subjective Norms, Perceived Control and Intention.
Location data are used to generate other indicators at the area level. For example, the Quebec Material and Social Deprivation combines six indicators related to health and welfare that represent material or social deprivation based on Canadian Census data, including (1) proportion of persons without high school diploma; (2) ratio of employment to population; (3) average income; (4) proportion of persons separated, divorced, widowed; (5) proportion of single-parent families and (6) proportion of people living alone.34
A full list of key variables in the survey and definitions is presented in online supplemental table 1.
Supplemental material
Analysis, data cleaning and weighting
Quota sampling has been used by other studies to achieve representativeness.8 35 We used two approaches to achieve the same goal: adaptive recruitment through promotion and targeting to specific populations, and post hoc weighting. Our survey tool does not set quotas on recruitment but uses targeted advertisements to improve representativeness.
All suspected duplicate responses are removed (ie, a participant filling the survey more than once in a survey round). For suspected duplicates, the most recent record is retained, and others are removed. A survey completion rate of at least 33% of questions, and valid non-missing responses for the sex and age questions are required for inclusion for weighting the survey data and further analysis. To ensure that the BC-Mix sample is representative of the BC population, survey data are weighted using the weighting adjustment technique36 to obtain generalisable estimates (table 1). Using the 2016 Census data,37 the survey is weighted with the following auxiliary variables: age, sex, geography and ethnicity in the following hierarchy: as our first criterion, we consider age, sex, geography and ethnicity as our auxiliary variables. If a record has valid responses for all these variables except the ethnicity variable, then the survey weight is generated using only age, sex and geography (second criterion). If a record does not meet the first and second criteria, then we apply the third criterion which uses age, sex and ethnicity as the auxiliary variables. Finally, we use only age and sex as auxiliary variables, if a record does not satisfy the first three criteria.
Participant profile of BC-Mix baseline data (n=41 375), 4 September 2020–26 July 2021
Survey weights are estimated separately for baseline and for each follow-up. To assess participant profile, we computed unweighted and weighted frequency and percentages of key demographic variables using SAS software V.9.4. Baseline survey data were used to provide the survey participant profile and in comparison with the BC population profile (table 1). To assess potential systematic differences between eligible and ineligible responses, a comparison of the baseline eligible participants versus ineligible participants is presented in online supplemental table 2. Participant profile of follow-up surveys is also presented in online supplemental table 3.
Preliminary results
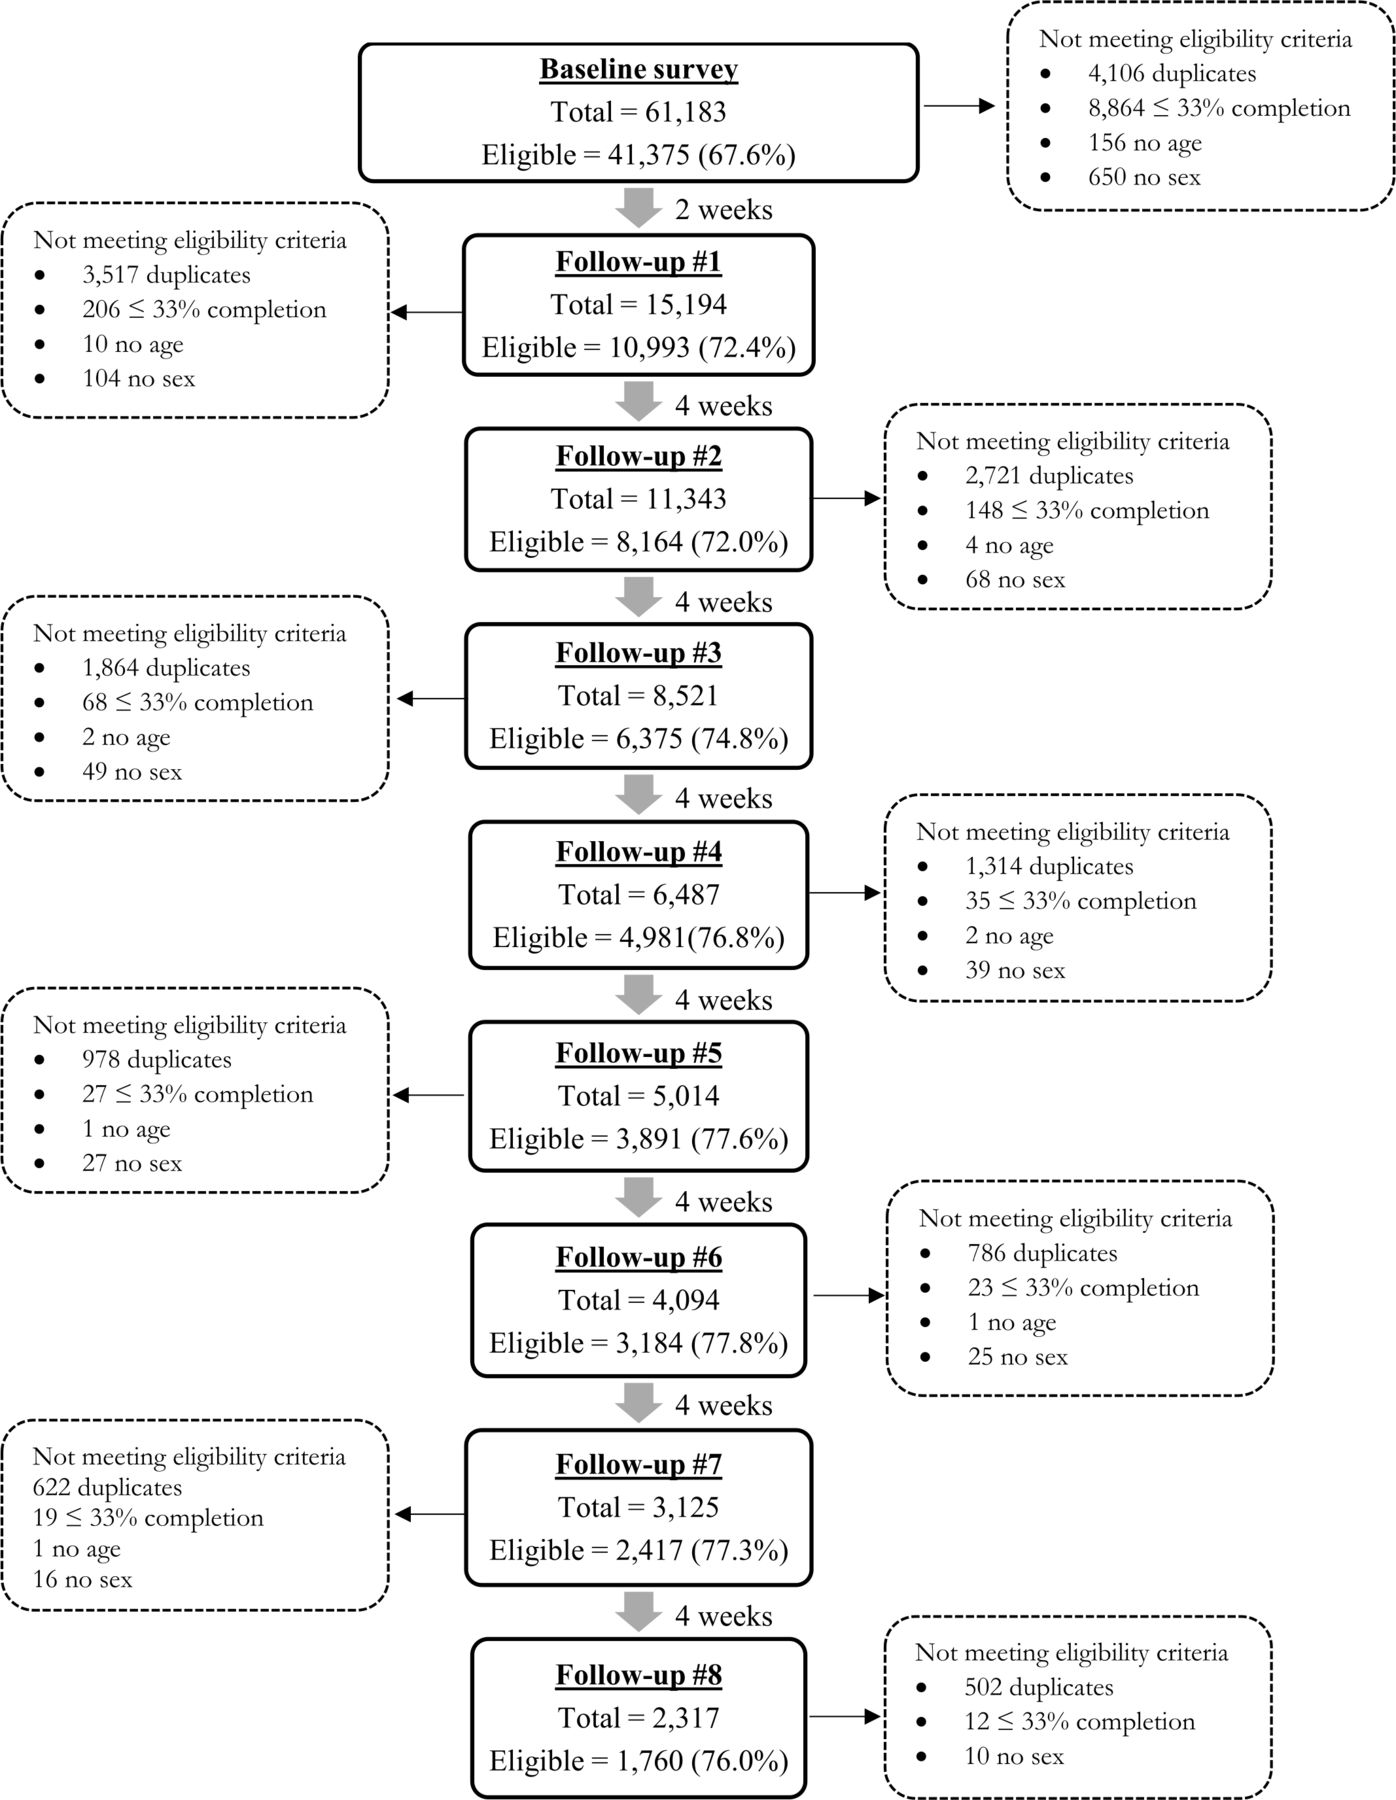
As of 26 July 2021, there were 61 183 respondents who participated in the baseline survey of which 41 375 were eligible for analysis. There were 15 194 (eligible=10 993) participants in the first follow-up survey, 11 343 (eligible n=8164) in the second, 8521 (eligible n=6375) in the third, 6487 (eligible n=4981) in the fourth, 5014 (eligible=3891) in the fifth, 4094 (eligible=3184) in the sixth, 3125 (eligible n=2417) in the seventh and 2317 (eligible n=1760) participants in the eighth follow-up survey (figure 1). Examining the eligible baseline sample by month recruited, June 2021 recorded the highest proportion (19.9%) of recruited participants (online supplemental table 4).

Participant flow chart for British Columbia COVID-19 Population Mixing Patterns Survey (baseline and first eight follow-up data).
Whereas the survey completion rate for the baseline survey was 64.7%, the least completion rate in the follow-up surveys was 96.6% (online supplemental table 3). Also, excluding duplicates, although 72.5% of the baseline records were eligible, all the follow-up surveys had more than 94% eligible (online supplemental table 5).
Considering the baseline sample (table 1), there were approximately equal number of male and female (weighted % of female=50.0%). Majority of participants were 55 years or older (weighted %=39.4%), self identified as white (weighted %=64.6%), had at least a university degree (weighted %=50.0%) and lived in the Fraser Health region (weighted %=36.2%).
Almost 63.8% (unweighted n=20 633) consented to a follow-up after the baseline survey and at least 94.2% (unweighted n=10 357) consented to receiving subsequent follow-up surveys (table 1 and online supplemental table 3). Approximately 27.3% (unweighted n=7290) of respondents in the baseline provided their personal health numbers for linkage with other healthcare utilisation databases.
After weighting, the distribution of the baseline survey sample was similar to the general BC population in terms of age, sex, health region and ethnicity (table 1). The distribution of the eligible participants was also similar to the distribution of ineligible participants in terms of sex, age, race/ethnicity and geography/health region (online supplemental table 2). Moreover, in a sensitivity analysis, we used a cut-off threshold of 67% instead of 33% and observed that the distribution of this sample was similar to the distribution obtained in our current eligible sample (online supplemental table 6). In addition, we compared the characteristics of a sample with 100% completion and <100% completion and found no systematic differences in demographic characteristics between the two samples (online supplemental table 7).
Findings to date
Following the identification of COVID-19 cases in BC, several interventions including physical distancing measures were implemented to limit the spread of COVID-19 in the province. Subsequently, the BC-Mix was developed by the BC Centre for Disease Control41 as part of an early warning system for monitoring social and physical interactions between individuals of different age groups and demography, and to help predict when COVID-19 transmission might further increase. This paper describes the BC-Mix survey methods and the profile of survey respondents.
Recent studies similar to the BC-Mix have assessed social contact patterns relevant to the spread and control of COVID-19 in different countries,8–13 42 43 many of which have adapted features of the POLYMOD Project.17 The 2020 Belgian CoMix Survey8 is an online longitudinal survey that closely monitors changes in social mixing behaviours among a sample of Belgian adults (aged 18 years and above). The UK CoMix Survey assesses contact patterns of a representative sample of UK adults. Launched on 24 March 2020, participants are followed up every 2 weeks to monitor changes in their self-reported behaviours.13 In Canada, the Quebec-based CONNECT Study uses population-based survey to assess social contacts and mixing patterns.42 Brankston et al43 also used paid panel representative of Canadian adults to construct contact patterns and determine the impact of physical distancing measures on COVID-19 transmission. Most of these studies commissioned market research companies or used survey panels to recruit participants.8 13 20 43 While market companies or survey panels offer a convenient approach to sampling, they have some challenges. Panels are made of membership in loyalty programmes or other panels constituting a select group of the population, and therefore, may not represent complete random recruitment from a population of interest.
The use of targeted social media advertisement for participant recruitment has gained prominence in health research,19 44 having been applied in areas such as mental health,45 cannabis use,46 smoking behaviour47 and other health-related studies.48 For our survey, we use social media advertisement and other recruitment strategies. Although social media-based recruitment does not necessarily generate a random sample of the general population given the characteristics of people who are on social media may differ from those who are not, social media channels like Facebook, Instagram, Twitter and others have powerful targeting capabilities that allow researchers to target advertisements to users with specific demographic characteristics. They also have the advantage of reaching hard-to-reach populations.49
Strengths and limitations
The following issues should be considered for interpretation of results from BC-Mix. Some population groups are under-represented in the survey, possibly due to the lack of access to social media. These are people who are economically marginalised and less likely to have access to a computer/electronic device or to have access to the internet or cellular data, for example, people living in poverty, people who are unemployed, people who are unhoused, etc. Additionally, people who are in prison (sentenced or on remand) or people who are under immigration detention may not have access to the internet or cellular devices. Our survey responses may also be subject to recall bias since we ask respondents to recall contacts and other behaviours or activities from the previous day. Other studies have used diaries17 to overcome this weakness but this may be logistically challenging and attrition with this method may be quite high. Another potential bias inherent in our survey is the issue of reporting bias, as respondents may respond in ways consistent with the laws around physical distancing. In addition, the BC-Mix is available only in English, thus excluding individuals who cannot communicate in English. This notwithstanding, according to the 2016 Census, 96.6% of BC’s population indicated that they can converse in English.37 Therefore, we do not believe that any bias associated with language would be significant. Another limitation is the large number of recruits that were ineligible and the attrition between successive rounds of survey. This could be related to survey fatigue, or the time required to complete the survey. Also, although we used survey weights to improve the representativeness of our sample, this was by no means perfect as some differences in the distribution of some characteristics can still be observed between our weighted sample and the BC population. This limits representativeness of the sample. Additionally, although weighting ensures that a survey sample is similar to the reference population in terms of some known demographic characteristics, this does not guarantee that the weighted data on a particular outcome measure are representative, particularly in situations where the outcome measure is related to unknown factors that were not considered during weighting.
Our survey has several strengths. Web-based surveys like the BC-Mix provide timely information for pandemic response.49 Also, during an infectious disease pandemic, web-based surveys offer a more convenient approach to data collection compared with in-person or other modes of data collection. We also found paid advertisements to be more cost-effective compared with the cost of panel data from survey companies.44 An additional strength of our study is its large sample size. Our total recruited sample of over 61 000 participants compares with the 1356 participants in the UK CoMix Study,13 the 9743 participants in the BICS,20 1542 participants in the Belgian CoMix Study8 and the 7290 participants in the POLYMOD Study.17 In addition, because we opted to achieve representativeness post-data collection (at the analysis stage), we were able to consider geography and ethnicity in our weighting strategy. It would have been logistically challenging to consider these variables together with other variables had we used quota-sampling given that many market research company panels were limited in terms of recruitment by age, sex and geography. Using many auxiliary variables in our weighting strategy increased the representativeness of the BC population.
Collaboration
The BC-Mix will continue to collect relevant data on behaviour and contact patterns in BC to reflect the changing dynamics of the COVID-19 pandemic. The BC-Mix has an overarching governance structure. We welcome further collaboration from interested researchers. Data requests should be sent to the Principal Investigator, Dr Naveed Z Janjua (corresponding author).
Conclusion
To our knowledge, the BC-Mix is the first and largest surveillance tool providing real-time quantitative data on mixing patterns and contact characteristics in BC and one of the largest in North America. Tools such as the BC-Mix are integral to the COVID-19 pandemic response as they provide critical data that can be used to inform the timing of loosening or re-imposition of physical distancing measures. Further analyses on contact patterns, relationship of contact patterns with transmission, disparities in contact patterns and facemask use are either in progress or have been published.39 40
Data availability statement
Data are available upon reasonable request.
Ethics statements
Patient consent for publication
Ethics approval
Informed consent was sought on the survey start page. The study was reviewed and approved by the University of British Columbia Behavioral Research Ethics Board (No: H20-01785). Data from BC-Mix contribute to modelling projections to inform COVID-19 control measures in BC (ref. 38). Multiple papers describing contact patterns, physical distancing measures, regular handwashing and facemask wearing, modelling looking at impact of physical distancing measures and vaccination levels, vaccine acceptance, hesitancy, and uptake are either in progress or have been published (ref. 39 and 40).
Acknowledgments
The authors would like to express their gratitude to Dr Joan Hu, Department of Statistics and Actuarial Science, Simon Fraser University, and Mei Chong of British Columbia Centre for Disease Control for their methodological guidance. We are also grateful to all residents of British Columbia who participated in the British Columbia COVID-19 Population Mixing Patterns Survey (BC-Mix).
References
Supplementary materials
Supplementary Data
This web only file has been produced by the BMJ Publishing Group from an electronic file supplied by the author(s) and has not been edited for content.
Footnotes
Twitter @bushramahmood
Contributors Conceptualisation—NZJ and PAA. Survey design—NZJ, PAA, TB-T and BM. Data curation—PAA, AY and SW. Statistical analysis—PAA. Funding acquisition—NZJ. Methodology—NZJ, PAA, MB, TB-T, BM, SI and MO. Writing (first draft)—PAA, DJ, MB, TB-T, SI and NR. Writing (review and editing)—NZJ, HAVG, BM, MJD, MB, JW, SB, MO and MAI. Overall content and guarantor—NZJ.
Funding This work was supported by Michael Smith Foundation for Health Research COVID-19 Research Response Fund (Award #: COV-2020-1183).
Competing interests None declared.
Patient and public involvement Patients and/or the public were involved in the design, or conduct, or reporting, or dissemination plans of this research. Refer to the Methods section for further details.
Provenance and peer review Not commissioned; externally peer reviewed.
Supplemental material This content has been supplied by the author(s). It has not been vetted by BMJ Publishing Group Limited (BMJ) and may not have been peer-reviewed. Any opinions or recommendations discussed are solely those of the author(s) and are not endorsed by BMJ. BMJ disclaims all liability and responsibility arising from any reliance placed on the content. Where the content includes any translated material, BMJ does not warrant the accuracy and reliability of the translations (including but not limited to local regulations, clinical guidelines, terminology, drug names and drug dosages), and is not responsible for any error and/or omissions arising from translation and adaptation or otherwise.