Article Text

Abstract
Objectives The present study evaluates the extent of association between hepatitis C virus (HCV) infection and cardiovascular disease (CVD) risk and identifies factors mediating this relationship using Bayesian network (BN) analysis.
Design and setting A population-based cross-sectional survey in Canada.
Participants Adults from the Canadian Health Measures Survey (n=10 115) aged 30 to 74 years.
Primary and secondary outcome measures The 10-year risk of CVD was determined using the Framingham Risk Score in HCV-positive and HCV-negative subjects. Using BN analysis, variables were modelled to calculate the probability of CVD risk in HCV infection.
Results When the BN is compiled, and no variable has been instantiated, 73%, 17% and 11% of the subjects had low, moderate and high 10-year CVD risk, respectively. The conditional probability of high CVD risk increased to 13.9%±1.6% (p<2.2×10⁻¹⁶) when the HCV variable is instantiated to ‘Present’ state and decreased to 8.6%±0.2% when HCV was instantiated to ‘Absent’ (p<2.2×10⁻¹⁶). HCV cases had 1.6-fold higher prevalence of high-CVD risk compared with non-infected individuals (p=0.038). Analysis of the effect modification of the HCV-CVD relationship (using median Kullback-Leibler divergence; DKL) showed diabetes as a major effect modifier on the joint probability distribution of HCV infection and CVD risk (DKL=0.27, IQR: 0.26 to 0.27), followed by hypertension (0.24, IQR: 0.23 to 0.25), age (0.21, IQR: 0.10 to 0.38) and injection drug use (0.19, IQR: 0.06 to 0.59).
Conclusions Exploring the relationship between HCV infection and CVD risk using BN modelling analysis revealed that the infection is associated with elevated CVD risk. A number of risk modifiers were identified to play a role in this relationship. Targeting these factors during the course of infection to reduce CVD risk should be studied further.
- infectious diseases
- cardiology
- epidemiology
This is an open access article distributed in accordance with the Creative Commons Attribution Non Commercial (CC BY-NC 4.0) license, which permits others to distribute, remix, adapt, build upon this work non-commercially, and license their derivative works on different terms, provided the original work is properly cited, appropriate credit is given, any changes made indicated, and the use is non-commercial. See: http://creativecommons.org/licenses/by-nc/4.0/.
Statistics from Altmetric.com
Strengths and limitations of this study
This is the first study to introduce Bayesian network (BN) analysis to characterise the aetiological role of hepatitis C virus (HCV) infection in cardiovascular disease (CVD) risk in a Canadian adult population.
The study examined 10 115 subjects aged 30 to 74 years from the Canadian Health Measures Survey, a cross-sectional survey of the non-institutionalised civilian residents.
Assessment for the 10-year risk of CVD in asymptomatic individuals was carried by estimating the Framingham Risk Score algorithm in both HCV-positive and HCV-negative subjects.
Machine learning algorithms using BNs were used to determine the relationship between HCV and CVD risk in the study population.
The study did not capture the status of HIV or the use of direct-acting antiviral therapy, factors that may have a significant effect on the relationship between HCV infection and CVD risk.
Introduction
The prevalence of hepatitis C virus (HCV) infection is estimated to be around 3% worldwide and 1.3% in North America.1 The infection causes chronic liver diseases in 170 to 200 million people worldwide rendering it a leading factor in the aetiology of progressive liver fibrosis that results in cirrhosis, liver cancer, liver failure and death.2 3 Presently, the rate of mortality among persons living with HIV infection falls behind those living with HCV,3 ranking the latter among the top causes of death globally4 and the leading infection-related cause of mortality in North America.5 While HCV exerts its main effects in the liver, over the past decade several lines of evidence emerged to suggest it as a causative factor in a number of extrahepatic manifestations6 including abnormal endocrine, haematological, neurological and renal functions.7–9 Although yet to be fully substantiated,10 11 evidence suggest that patients with chronic HCV infection exhibit elevated rates of cause-specific mortality from cardiovascular disease (CVD).12–15 The role of HCV in the manifestation of CVD was thought to be related to the interference of infection with glucose and lipid metabolism and the subsequent risk of type 2 diabetes and CVD.16 Recently, in addition to this altered profile of cardiometabolic risk factors, we reported a distinctive pattern of acute phase reactants (such as C-reactive protein, fibrinogen and homocysteine) in the HCV infected patients compared with non-infected subjects, implicating the status of chronic inflammation in the elevated CVD risk associated with HCV infection.17 Furthermore, vascular endothelial dysfunction resulting in carotid atherosclerotic plaques has been proposed to play a role in CVD risk among HCV-infected individuals.18–20
Despite proposing a number of mechanisms and an array of causative factors, the aetiological relationship between HCV infection and risk of CVD is still speculative as described above. Together with experimental work, and clinical studies, the potential causal links between HCV infection and CVD risk can be further explored, predicted and ascertained using population-based data sets. This direction represents the first step towards identification of disease-causing mechanisms, treatment and control.21 A fundamental step in analysing big data or large population-based data sets is to identify relations among a large number of variables in a data set.22 Bayesian networks (BN) are a widely-used class of probabilistic graphical models that represent a set of variables and their conditional dependencies, permitting the identification of relationships that may highlight causality.22 These relationships are represented by a graphical structure, whereas the quantitative dependencies between individual variables is expressed by conditional probability.23
A BN is defined by a graph structure of nodes (variables) connected by directed edges and a set of conditional probabilities. The generated model is dynamic where the probability of all variables changes by changing the state of one variable and reveals the influences and interactions between the depicted variables.23 The model has been used for intelligent information processing in many scientific fields, ranging from biomedical to social sciences, for example, risk prediction, diagnosis and assessment,24 25 clinical decision-making,26 inference of causation27 and social network analysis.28 Over the past few years, BNs have been extensively used to model clinical problems in CVD for the purposes of diagnosis, risk assessment and disease prediction.29–33 In the present study, we introduced a BN analysis to evaulate the aetiological role of HCV infection in CVD risk. Our objective is to characterise the multivariable probabilistic connection between the two diseases and identify factors that mediate and influence this relationship in a population of Canadian adults.
Methods
Study population
Data were collected from the Canadian Health Measures Survey (CHMS), a cross-sectional survey of the non-institutionalised civilian Canadian residents aged 3 to 79 years, designed to collect information on the health and wellness as well as nutrition status of the population. The CHMS covers approximately 96.3% of the Canadian population at the selected age group. The current study uses a cohort that we previously described.17 Briefly, participants in this study were obtained from CHMS cycles 1 to 4, collected between March 2007 and December 2015 (n=5604, 6395, 5785 and 5794 for cycles 1, 2, 3 and 4, respectively, n=23 578). The multistage sampling design, participation and data collection methods have been comprehensively mentioned elsewhere.34–36 Participation was voluntary and was through a household interview that included general sociodemographic questions as well as an in-depth health questionnaire. Participants subsequently visited a mobile examination centre (MEC) where physical and biological measurements were collected.37
Assessment for the 10-year risk of cardiovascular disease
The 10-year CVD risk was estimated in subjects who were asymptomatic at baseline and aged 30 to 74 years, using the Framingham Risk Score (FRS) algorithm in both HCV-positive (HCV+) and HCV-negative (HCV−) cases as previously described.17 38 39 As per the conditions of the FRS algorithm, we excluded subjects under the age of 30 years or over the age of 74 years (n=12 348). History of CVD was assessed via self-report as the participants were asked if they have or had heart disease and if they have ever been told by health professional that they have or had heart attack. Patients with confirmed or a history of heart diseases (n=888) were excluded. We also excluded participants with missing data for any of the components used in the FRS algorithm that included age, gender, blood pressure, total cholesterol (T-Chol), high-density lipoprotein cholesterol (HDL-C), smoking status, diabetes and anti-hypertensive medication (n=51). Furthermore, we did not include participants missing information on HCV status or with an indeterminate HCV infection (n=176). The total number of participants included in the present study was 10 115 subjects (male:female ratio of 1:1.12). This group was further divided to HCV-positive (HCV+, n=87) and HCV-negative (HCV–, n=10 028) subgroups. In both subgroups, we calculated the FRS score for each participant. The points assigned for each risk factor are based on the value for the β-coefficient of the proportional hazard regressions.38 39 The 10-year risk score was then derived as a percentage. As previously described,39 the 10-year CVD risk is categorised into low (FRS <10%), moderate (10% to 19%) or high (≥20%) based on the derived estimate.
Assessment of hepatitis C infection
Infection with HCV was determined using serum specimens screened for anti-HCV antibodies or HCV-RNA. HCV-positive status was considered if HCV-RNA was present in the serum and/or a confirmed antibody test yielded positive results. Participants with indeterminate anti-HCV and without RNA testing were considered ‘unknown’ and were excluded as HCV status could not be determined with certainty. HCV infection was detected using VITROS Anti-HCV Assay (Ortho Clinical Diagnostics, Raritan, New Jersey, USA). All samples positive on initial screening for anti-HCV were confirmed by INNO-LIA HCV Score immunoblot assay (Innogenetics, Fujirebio Inc, Georgia, USA). All HCV-positive patients (n=87) had anti-HCV testing performed. Among those, 21 subjects were also examined for HCV-RNA, 14 of which were positive for HCV-RNA. Data on genotypes and sub-genotypes was previously described.17 Information on the use of the recent direct-acting antivirals or the length of stay in prison in HCV positive or negative groups (if any) were not captured.
Metabolic markers, sociodemographic factors and other covariates
A number of metabolic markers were measured in the study including cardiometabolic disease markers (apolipoprotein (Apo) A1 (g/L), ApoB (g/L), low-density lipoprotein cholesterol (LDL-C) (mmol/L), HDL-C (mmol/L), T-Chol (mmol/L), T-Chol:HDL-C ratio, triglycerides (mmol/L) and glycosylated haemoglobin (HbA1c) (%)); inflammatory biomarkers (C-reactive protein (mg/L), fibrinogen (g/L) and homocysteine (μmol/L)); systolic and diastolic blood pressure and plasma 25-hydroxyvitamin D (25(OH)D) (nmol/L) as well as factors related to obesity such as body mass index (kg/m2), waist circumference (cm) and waist-to-hip ratio were all assessed as described previously.40 Diabetes status was defined as a self-reported or HbA1c ≥6.5%0.41 Assessing metabolic syndrome was carried out as previously described.42 Individuals who have been diagnosed as hypertensive, diabetic or those who were using antihypertensive drugs were included.40 43 44 Insulin resistance (IR) was approximated using the homoeostatic model assessment (HOMA-IR) formula ((glucose (mmol/L) x insulin (μIU/mL)) ÷ 22.5) as described.17 Liver functions were evaluated in the study subjects using serum enzyme markers of alanine aminotransferase, alkaline phosphatase, aspartate aminotransferase, lactate dehydrogenase and γ-glutamyl transferase (U/L). Furthermore, a number of serum micronutrients including vitamins B12 (pmol/L) and D (nmol/L) were measured and captured in the present study. Sociodemographic information such as age, gender, ethnicity, education, marital status, history of injection drug use and household income was assessed through responses to questionnaires given during the structured interview portion of the survey. Ethnicity was categorised into four main subgroups: White, African-Americans, Asian (ie, Korean, Filipino, Japanese, Chinese, South Asian, Southeast Asian, Arab and West Asian) and Other (ie, Latin American or mixed racial origins). Household income was dichotomised according to self-reported income below or above $20 000 per annum. Self-reported smoking status was categorised into smokers (daily/occasional) and non-smokers. A comprehensive list of all metabolic markers, sociodemographic factors and other covariates assessed in the present study are listed in online supplementary table S1.
Supplemental material
Bayesian network analysis and statistical methods
Machine learning algorithms using BNs were used to determine the associations between HCV infection and CVD risk in the study population.
Bayesian network formalism
According to the chain rule of probability, for any set of N categorical variables {X1, X2,…, XN}, the joint probability distribution (JPD) was:

Given a directed acyclic graph (DAG) over the variables, the parents of any variable  denoted by
  is the set of variables in the DAG that have a directed edge (→) to
  . For a BN induced by a DAG, the JPD factorises as follows:

For example, given the two node BN with the configuration X1→X2, the JPD is P(X1,X2)=P(X2|X1) P(X1). In a BN, any variable Xi is independent of all other variables conditioned on its Markov blanket MB(Xi), which is the set containing Pa( ), the children of
  (ie, have a directed edge from
  ) and parents of children of Xi.MB(Xi), if fully observed, provides all the information about
  in a BN. Detailed statistical description of BNs can be found elsewhere.45 46 The property stating that any node X is conditionally independent of any other node, given its Markov blanket, is the global Markov property. Another property that has been taken into account is the local Markov condition, that is, a node X is conditionally independent of those of all its non-descendants given the set of all its parents. The flow of influence has been taken into consideration, when two variables (nodes) are d-separated for different types of connections.45 46
Learning Bayesian network structure from missing data
We excluded variables containing >20% missing values from our analysis and assumed that missingness was at random. To learn BN structures from missing data, we used structural expectation maximisation (EM). EM is an algorithm for finding maximum likelihood estimates of models with latent parameters by iteratively calculating the expectation of the model with respect to the parameter estimates (usually initialised randomly) at the current EM step, and then finding parameters that maximise this expectation.
For initialising EM, we sampled 20 DAGs from a uniform distribution over the space of connected DAGs with a maximum degree of 3 using the method by Ide and Cozman47 implemented in the R package bnlearn.48 These DAGs were parametrised on the data set (see Bayesian network parametrisation) and used to initialise 20 independent EM runs. Convergence for EM was assessed using the structural Hamming distance (SHD)49 of the DAG at the current EM step relative to the previous EM step. An SHD, which is the number of edge additions, deletions or reversals required to transform one graph to another, of <20 was assumed to signify convergence because SHD did not reliably decrease if additional EM steps were allowed. Following convergence, the resulting 20 structures were averaged to retain oriented edges that occurred in at least 50% of the structures. This was the highest decile that did not render the three outcomes of interest independent.
For the maximisation step of EM, we used the score-based hill climbing structure learning algorithm46 to search the space of DAGs that maximise the Bayesian information criterion (BIC), a commonly used penalised maximum likelihood-based model score. Hill climbing is a greedy local search algorithm that performs sequential edge modifications (edge additions, reversals and deletions) to find a DAG that maximises a given network score. No constraints on edge orientations or presence/absence were placed during training. The validity of the recovered final structure was assessed visually by comparing it to known/expected relationships, such as between correlated variables (eg, diabetes and obesity) and causally related variables (eg, having hypertension and taking blood pressure medicine). Model averaging over 20 structures from EM was done to reduce uncertainty in model learning to select a robust model structure.
Learning Bayesian network parameters
Network parameters were learnt using Bayesian estimation, which calculates the expected value of the posterior distribution over the parameters. A Dirichlet prior with an equivalent sample size of 1 was used as a weak prior over the parameters.
Approximate inference using likelihood weighting
To calculate the probability of a given query from the BN, we used a form of importance sampling called likelihood weighting implemented in bnlearn. Briefly, given a BN and an ordering over variables induced by the DAG underlying the BN, we can sample from the network (with or without conditioning) from a proposal distribution (usually the uniform distribution) along with weights that represents the probability of acceptance of the sample from the target distribution (represented by the trained BN). The probability of the query is computed by dividing the sum of the weights of all samples that were equal to the query of interest by the total weight of all samples.
Calculating predictiveness of variable for an outcome
We used conditional entropy H(Y|X) as the measure of predictiveness of an outcome Y by a predictor X, H(Y|X) quantifies the averaged reduction in uncertainty about the outcome Y conditioned on having observed the variable X. Conditional entropy is defined as follows:

If X is perfectly predictive of Y, the conditional entropy H(Y|X)=0 since there is no uncertainty about Y given X. The maximum value of conditional entropy is achieved when X and Y are independent and is equal to the entropy of Y which is:

Therefore, conditional entropy is bounded by 0 ≤H(Y|X) ≤H(Y). For the predictive index (PI) reported in the paper, we normalised H(Y|X) by dividing it by H(Y) and inverted the values such that a value of 0 represents independence and 1 representing perfect prediction using the following transformation:

Effect modification
A variable X was defined to be an effect modifier of outcomes Y and Z if the joint probability distribution of Y and Z conditioned on X, that is, P(Y,Z|X=x), was not constant for x ∈X. The strength of effect modification was calculated as the median Kullback-Leibler (KL) divergence (DKL)—also known as relative entropy50—for Qx=P(Y,Z|X=x) ∀x ∈X. For example, for a variable X, we calculated DKL(Qi ||Qj) where i ≠ j for all i, j ∈X. The KL divergence is an asymmetric measure of how similar a candidate probability distribution B(x) is to some reference distribution A(x), and is equal to:

In all cases, DKL(A|B)≥0,with it being 0 if the two distributions are identical. Effect modification refers to the scaled and inverted KL divergence calculated using the following transformation:

A scaled KL divergence of zero for a variable X implies that the joint distribution of the outcomes was identical for different values of X, that is, X was not an effect modifier. A scaled KL divergence of 1 implies the highest effect modification observed among survey variable.
Guidelines and principles published by CHMS were used to combine survey data over multiple cycles.51 Data from each cycle were treated as a completely random population sample and survey weights were excluded from all analyses. All analyses were performed on untransformed, unadjusted and unweighted data. To describe baseline characteristics, frequency distributions and proportions were reported for categorical data whereas means (±SD) were reported for continuous data.
Patient and public involvement
No patient involved.
Results
Respondents who were eligible for this study (n=10 115) had an average age of 49.2±12.5 years and an approximately 1:1 male:female ratio (table 1). Among study participants, HCV infection was prevalent in 1% of the population. As shown in table 1, approximately 73% of the study subjects had a low 10-year CVD risk (ie, FRS <10%), 17% had a moderate risk (10% to 19%) and 11% were at high risk (FRS ≥20%). HCV-positive (HCV+) cases, had a FRS of 10.5%±8.8%, which was significantly higher (p=0.008) than their HCV-negative (HCV−) counterparts (8.0%±6.6%). Furthermore, subjects with HCV infection had a 1.6-fold higher prevalence of high-CVD risk (ie, FRS ≥20%) compared with non-infected individuals (p=0.038). Marital status, level of education, household income, use of intravenous drug and smoking status were all significantly different between HCV− and HCV+ cases (table 1). Diabetes (assessed as self-reported or with HbA1c ≥6.5%) was found in 8% of the participants with a higher prevalence in the HCV+ cases. Total cholesterol levels and total cholesterol:HDL-C ratio were significantly higher in HCV+ cases whereas fasting triglycerides, LDL-C and apolipoprotein B levels were significantly lower in this group compared with their levels in non-HCV-infected individuals. Furthermore, liver enzyme markers were—as expected—all significantly increased in those who were HCV+.
Sociodemographic and clinical characteristics in the study populations stratified by the hepatitis C virus infection
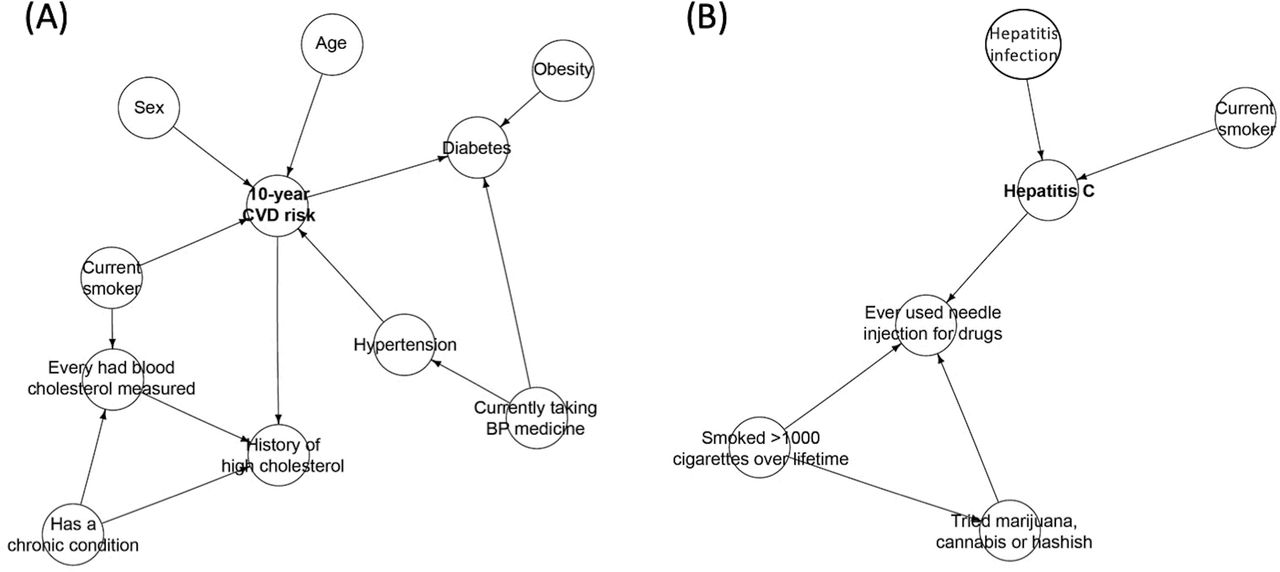
The BN structures of the Markov blankets for HCV and CVD is shown in figure 1. The Markov blanket of CVD risk network structure included traditional CVD risk variables such as age, sex, obesity, diabetes, smoking status, hypertension and high levels of cholesterol (figure 1A). However, the HCV infection network structure primarily included factors such as smoking status and past illicit drug injections (figure 1B). Full BN structure for the entire set of variables examined here is provided in online supplementary figure S1. It clearly demonstrates diabetes as a primary risk modifier that influences the interaction between HCV infection and CVD risk.

Markov blankets of the Bayesian network structures learnt in Canadian adults. Markov blanket of hepatitis C virus infection (A) and Markov blanket for cardiovascular disease (B) in the Bayesian network. BP, blood pressure; CVD, cardiovascular disease.
As shown in figure 2, age and blood pressure were the most predictive variables for CVD risk (figure 2A) whereas injection drug use, alcohol use, smoking status and a number of diet-related factors were most predictive of HCV infection (figure 2B). The top 30 survey variables that were used to generate figure 2 to predict CVD risk in HCV infection are provided in online supplementary table S2. The conditional probabilities of CVD risk in the presence and absence of HCV infection, as estimated from the BN model, are shown in table 2. The presence of HCV infection resulted in an increased probability of CVD risk. The probabilities of medium (16.4%±0.28% vs 21.5±1.5%) and high (8.6%±0.16% vs 13.9±1.55%) risk of CVD were significantly elevated in individuals infected with HCV. In contrast, the probability of low-CVD risk was decreased (75.0%±0.29% vs 64.2±1.78%) in the presence of HCV infection. Since age was a significant variable that had an effect modifier on the joint probability distribution of HCV and CVD, we estimated the variation in the conditional probabilities through the different age intervals (table 3). The conditional probability of being infected with HCV was increased from 0.66±0.11 at age group 30 to 40 years to 0.87±0.21 at >70 whereas that of CVD was increased from 0.07±0.05 to 33.8±1.37 within the same age groups.

Outcome prediction of 10-year cardiovascular disease risk and hepatitis C infection in Canadian adults. BMI, body mass index; BP, blood pressure; BPM_131A, diastolic blood pressure - first set (3); BPMD161, average systolic blood pressure (mm Hg) first; BPMDPBPS, final previous average systolic blood pressure; C2_MTH, month of household interview; C2_YEAR, year of household interview; CCC_32, past medication for high blood pressure; CCC_51, has diabetes; CCC_93, has liver disease or gallbladder problem; CCC_95, has hepatitis; CCCF1, has a chronic condition; CLC_AGE, age at clinic visit; CLC_MOB, month of birth; CVD, cardiovascular disease; DHH_AGE, age at household interview; DHH_BED, dwelling - number of bedrooms; DHH_MOB, month of birth; DHH_PRN, province of residence; DHH_YOB, year of birth; DHHD611, number of persons 6 to 11 years in household; DHHDDWE, type of dwelling; DHHDECF, household type; DHHDHSZ, household size; DHHDL12, number of persons <12 years old in household; DHHDLE5, number of persons ≤5 years old in household; DHHDLVG, living arrangements for selected respondents; DHHDYKD, number of persons ≤15 years old in household; EDUDH10, highest level of education; FMH_19, immediate family had diabetes; GC_AGE_GROUP, age groups (10 year age groupings); GC_age10ygrps, 10 year age groups 30 to 74 years; GC_ATP3_HYPERTENSION, high blood pressure (BP ≥130/85 or HTN medication); GC_ATP3_OVERALL, number of ATPIII syndromes; GC_ATP3_OVERALL_GR, ATP-III group (groups of 0, 1, 2 and 3+); GC_BMI, body mass index; GC_BMI_OBESE, obesity (BMI ≥30 kg/m2); GC_CVDRISKGRP_P, 10-year CVD risk group (Framingham risk score); GC_DIABETES, self-reported diabetes (any type) based on fasting glucose; GC_DRUG_INJ, ever used needle injections for drugs; GC_ETHNICITY, ethnicity; GC_HTN_MED_CURRENT, current medication for high blood pressure (past month); GC_HX_HIGHCHOL, history of high cholesterol; GC_SMOKE_CURRENT, current smoker; GC_WAIST_CIRCUM, waist circumference (cm); GEN_16, employment; GFV_16, number of eats of instant/seasoned/wild rice; GSMD52, grip strength norms for respondents; HTN, hypertension; HWM_15 CM, hip circumference (cm); HWMD14IN, waist circumference (in); HWMD15IN, hip circumference (in); HWMDBMI, body mass index; HWMDWSTA, waist circumference norm for respondents 15 to 69 years; HWMDWTH, waist-to-hip ratio; HWTDBMI, body mass index, self-reported; LAB_HBA1, hepatitis B virus surface antigen; LAB_HBC, hepatitis B virus core antibody; SACDTOT, total hours of sedentary activity over the last 3 months; SMK_11, smoked 100 or more cigarettes in lifetime; SMK_12, type of smoker; SMKDSTY, type of smoker in dwelling; SPMDB1FP, predicted body mass index; V2_YEAR, year of clinic visit.
Conditional probabilities (%) of low, medium and high 10-year CVD risk in the presence and absence of hepatitis C virus infection in adult Canadians
Variation in the conditional probabilities for hepatitis C virus infection and cardiovascular disease risk at different age intervals in Canadian adults
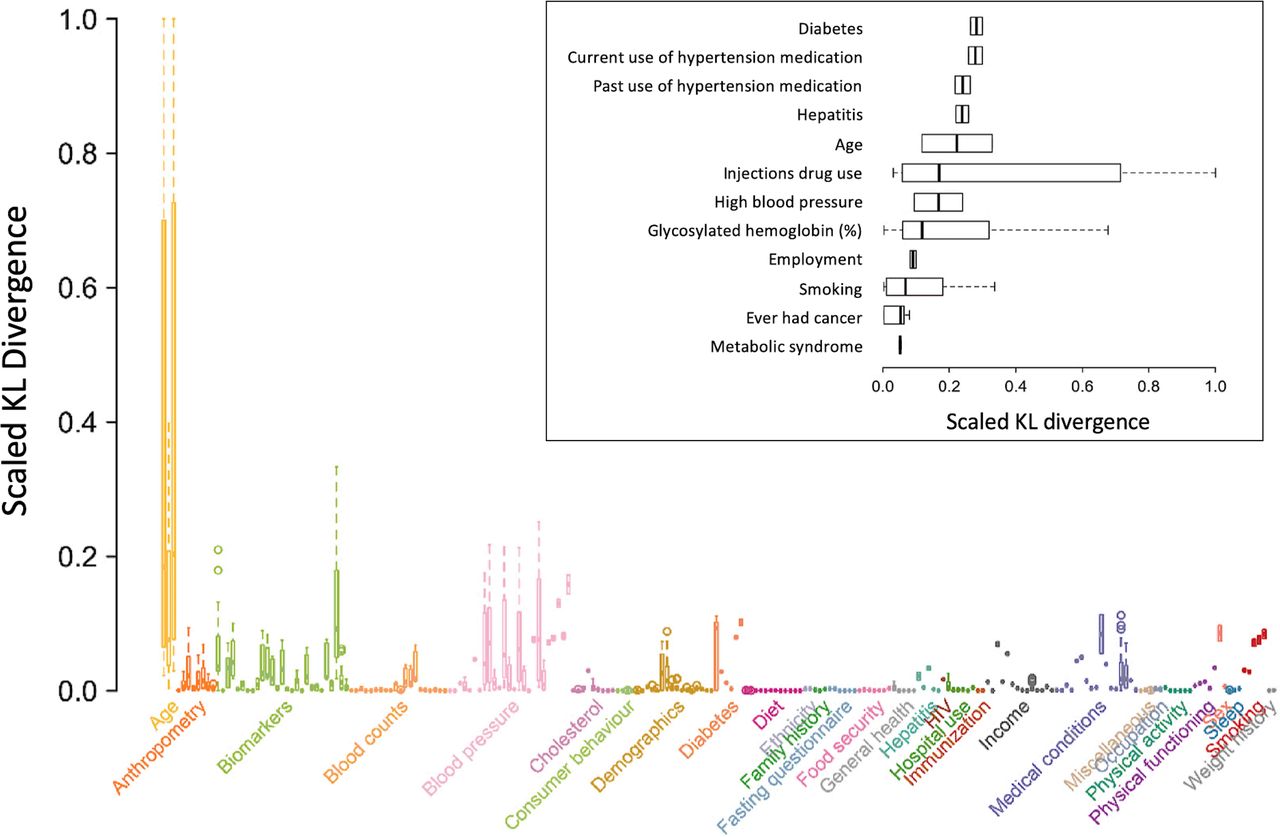
The extent to which the joint distribution of HCV infection and CVD risk varies in the presence of a given effect modifier was quantified using the KL divergence (DKL). Figure 3 shows the full set of modifiers of the joint probability distributions between HCV infection and CVD risk. The insert in figure 3 highlights the top factors modifying the HCV-CVD association. Diabetes (any type) had the largest divergence, that is, the top effect modifier of the pairwise joint probability distribution between HCV infection and CVD risk (median scaled DKL of 0.27; IQR, 0.26 - 0.27). This was followed by hypertension (DKL=0.24; IQR, 0.23 - 0.25), age (DKL=0.21; IQR, 0.10 - 0.38) and injection drug use (DKL=0.19; IQR, 0.06 - 0.59). Median scaled DKL values ranging from 0.03 to 0.06 were observed for other factors such as HbA1C, smoking, history of cancer and metabolic syndrome.
Median Kullback-Leibler (KL) divergence effect modification on the joint probability distributional relationship of hepatitis C infection and cardiovascular disease risk. The survey variables with the largest effect modification for Markov blanket of hepatitis C virus infection and Markov blanket for cardiovascular disease in the Bayesian network. The insert highlights the top factors modifying the association.
Discussion
The present study applies a BN analysis and machine learning techniques to explore the probabilistic relationship between HCV infection and CVD risk in Canadian adults. HCV infection was associated with an increased probability of CVD risk of 5.3% (table 2). Diabetes was the most prominent effect modifier of this relationship (figure 3) in our analysis, suggesting the disruption of pathways involved in glucose metabolism, insulin resistance and liver function as the leading factors in CVD comorbidities related to HCV infection.
BN analysis was both informative (figure 1A) and predictive (figure 2A) in implicating a number of conventional risk factors, for example, age, sex, obesity, diabetes, smoking status, hypertension and serum lipid profiles52 in CVD risk. In addition, lifestyle factors, for example, illicit drug use, smoking and alcohol consumption, were predictive of CVD risk in HCV infection (figures 1B and 2B). The findings demonstrating that injecting drug use is highly associated with HCV infection are well supported by previous studies showing that injection drug use may result in more cases of HCV than HIV.53 Furthermore, a recent study using data from the National Health and Nutrition Examination Survey cohort reported that, among smokers, those with HCV infection are more likely to be daily smokers and had smoked for longer.54 Additionally, alcohol abuse was found to hinder the processes of hepatic spontaneous clearance of HCV.55 Overall, conventional risk factors for CVD and HCV infection were highlighted by the Markov blankets and BN models demonstrating the abilities of the graphical elements in BN—irrespective of expert opinion—to generate and build convenient models structuring and detecting probabilistic relationships between the examined variables.
In line with observations from a number of earlier reports,4 17 56 we noted a significant increase in the conditional probability of CVD risk (from 8.6% to 13.9%) in presence of HCV infection (table 2). As we reported previously,17 a number of hepatic and extrahepatic processes related to HCV infection may explain the observed increased CVD risk. For example, the development of hepatic steatosis and the later manifestation of insulin sensitivity, metabolic abnormalities and visceral obesity19 57 together with altered LDL-C,58 ,59triglycerides and ApoB60 were all noted at progressive stages of chronic HCV infection and deteriorating liver functions. This altered profile of serum lipids indicates that HCV infection may result in the imbalance of serum lipoproteins/apolipoproteins, a known risk factor in atherosclerosis and the later development of CVD.61 Additional evidence for the role of viraemia on cardiometabolic risk markers and CVD risk is that HCV cases positive for the viral DNA had lower total cholesterol, LDL-C and total cholesterol:HDL-C ratio than the RNA-negative HCV infected cases.17 Another explanation for the role of HCV infection in CVD risk might be due to the alteration in the levels of proinflammatory cytokines and the downstream acute phase reactants (APR), for example, fibrinogen, in chronic infection as liver cirrhosis worsened.17 62 It is possible, therefore, that the severity of cirrhosis and alteration in the haemostatic regulation of the fibrinolytic system (that is linked to control of inflammation) are interrelated to play a role in CVD risk.8 As such, activation of inflammatory processes, disruption of cytokine synthesis and imbalance in APR homoeostasis all are well-known risk factors in the increased CVD risk.63–65
Diabetes status (any) was the largest effect modifier of the joint probability distribution between HCV infection and CVD risk with 0.274 median DKL. Chronic HCV impairs hepatocyte insulin signalling pathways leading to insulin resistance and the subsequent risk of diabetes via increasing the synthesis of tumour necrosis factor alpha, mediating the phosphorylation of insulin receptors and causing an over expression of suppressor cytokines.66 67 Several previous reports have demonstrated that patients with HCV infection exhibit elevated HOMA-IR,68 higher burden of cardiometabolic comorbidities68 and increased diabetes-related mortality rates68 compared to healthy controls. Our results confirm previous reports demonstrating lower levels ApoB60 in chronic HCV infection. This lower level of lipoprotein, together with the lower levels of triglycerides and LDL-C (table 2) reflect a disrupted pattern of serum lipids and can lead to the deterioration of liver functions during HCV infection. It may also indicate that the virus itself can be involved in the imbalance of serum lipoproteins/apolipoproteins.60 Alterations in hepatic lipid metabolism is known to be responsible for the acceleration of atherogenesis, a significant risk factor in the development of cardiovascular diseases.69
Given the role of insulin resistance in diabetes and the subsequent risk of CVD, it is reasonable to suggest diabetes as a modifier for the HCV-associated CVD risk through extrahepatic insulin resistance related pathways (online supplementary table S2).69 In support to this assumption, an increased risk of diabetes was observed in the HCV-infected subjects examined here (data not shown). Although not well-defined in some studies,70 several reports and meta-analyses revealed an association between HCV infection and diabetes risk.71–75 Furthermore, liver cirrhosis, a common manifestation of HCV infection2 3 is a known risk factor in diabetes.76–78 The results of our machine-learnt BNs have identified age, ethnicity and gender as risk modifiers of the joint probability distribution between HCV infection and CVD risk. These factors are known to increase the risk of diabetes in HCV cases at high risk of cirrhosis due to concurrent non-alcoholic fatty liver.78 As expected, the conditional probability of having CVD has been increased with age together with that of being infected with HCV (although to a much lesser extent, table 3). Such differences in the prevalence of HCV and CVD risk in relation to age were previously noted.17
Modelling the statistical relationships between covariates without the assumption of independence of variables that is involved in linear regression approaches is a key strength of applying a machine-learnt BNs.22 23 Linking multiple covariates and outcomes into a single transparent modelling assumption, generating an intuitive graphical representation of a complex system and the ability to handle missing data and multicollinearity has led to the increasing use of BNs in medicine and healthcare systems.25–27 Our introduction of BN analysis into a nationally-representative and population-based surveys has provided—without prior assumptions—a number of sociodemographic and biological variables that may influence the effect of HCV infection of CVD risk. The significance of this approach can be highlighted by the fact that several of the variants characterised here were previously recognised as risk factors for HCV and CVD risk. Additionally, novel aetiologies for the HCV-related CVD risk can be substantiated from a set of risk modifiers that were identified in the present study, such as diabetes, hypertension, age, injection drug use, smoking status, levels of glycosylated haemoglobin, history of cancer and metabolic syndrome.
The present study has several limitations. The status of HIV was not captured in the study participants as this factor was self-reported and deemed unreliable.We realise that coinfection of HCV and HIV can have a synergistic effect on increasing the risk of CVD as reported elsewhere.79 Furthermore,detailed clinical features of participants, such as the degree of liver fibrosis, cirrhosis or non-alcoholic fatty liver disease were not evaluated in the study population. These factors would have been valuable for classifying the extent of liver functions and damage and could have further emphasised on other modifiers for the relationship between HCV infection and CVD risk. For example, information on fatty liver would have added more weight to the role of diabetes in modifying the risk of CVD in HCV infection as it is a known risk factor for both diabetes and CVD.78 80 Furthermore, only approximately 25% of the anti-HCV positive patients had been tested for HCV-RNA and only ~60% of the tested patients were HCV-RNA positive. Although previously reported,17 data on genotypes and sub-genotypes were not considered in this study. Additionally, the study did not consider the use of direct-acting antiviral (DAA) therapy. Viral eradication by DAA therapy has been associated with decreased risk of CVD events among cirrhotic HCV individuals.81 82 Also, DAA treatment in diabetic patients has resulted in a significant improvement of the related CVD events.83 Information on the treatment for HCV infection would have shed insight into the sustained viraemia of the HCV-infected subjects assessed here and may have provided a detailed clinical response to the infection and the affected metabolic pathways. These limitations warrant further studies to consider the status of HIV, a detailed liver function profile and the use of DAA into understanding the relationship between HCV infection and CVD risk.
In conclusion, we have introduced a novel approach—applying BN modelling and machine learning algorithms—to investigate the relationship between HCV infection and CVD risk in a population-based survey data set. Our results provide evidence that increased CVD risk is likely to arise from HCV infection. Several factors, to varying degrees, were identified to play a role in the increased HCV-related CVD risk including diabetes, hypertension, age, injection drug use, smoking, levels of glycosylated haemoglobin, history of cancer and metabolic syndrome. It may be reasonable, therefore, to suggest that if these factors are targeted during the course of HCV infection, the risk of CVD could be reduced. However, before any such interventions are proposed, further research needs to be conducted to study the direct effect of DAA therapy on HCV infected individuals with and without chronic sequelae of infection to enable a reliable evaluation for the CVD risk in this population.
Acknowledgments
We thank Statistics Canada and the Canadian Institute for Health Information (CIHI) for granting the permission to access the Canadian Health Measures Survey data.
References
Footnotes
Contributors AB conceived the study idea and design and contributed to manuscript writing. GDG contributed to data analysis. AG performed the data analysis and interpretation and contributed to manuscript writing. AP assisted in data analysis and manuscript writing. PA contributed to results interpretation and manuscript writing. All authors critically reviewed the manuscript, approved the final draft and agreed to be accountable for all aspects of the work.
Funding This work was supported by the Public Health Agency of Canada (AB).
Competing interests None declared.
Patient consent for publication Not required.
Ethics approval The study was reviewed and approved by the Health Canada Research Ethics Board.
Provenance and peer review Not commissioned; externally peer reviewed.
Data availability statement All data relevant to the study are included in the article or uploaded as supplementary information. To obtain the Canadian Health Measures Survey (CHMS) data, the Principal Investigator (AB) had to sign a Data Use Agreement (DUA) to be able to access data files containing protected information. This DUA is signed between the Public Health Agency of Canada (PHAC) and the Data Providers (Statistics Canada and the Canadian Institute of Health Information) and is disseminated by the Data Coordination and Access Program (DCAP). This DUA obligates the data user to protect the confidentiality of the information, not to disclose it or distribute it improperly and to comply with all relevant laws, federal government policies and practices. Any information received under this DUA is to be treated as ‘Protected Data’. This includes, among others, personal information (ie, as defined by the Privacy Act). Furthermore, according to the DUA, the Data User is required to comply with the Agency’s specific contractual obligations, in particular those related to access and confidentiality. Also, the DUA states that ‘Protected Data’ may not be shared with individuals or organisations within or outside the signed Agency. Individual permissions to access the CHMS data may, however, be requested from Statistics Canada (https://www.statcan.gc.ca) or the Canadian Institute of Health Information (https://www.cihi.ca) through DCAP (contact information, email: ac.cg.cpsa-cahp@dcap-pacd).