Article Text

Abstract
Objectives Amyotrophic lateral sclerosis (ALS) is a rare neurodegenerative disease that is characterised by the rapid degeneration of upper and lower motor neurons and has a fatal trajectory 3–4 years from symptom onset. Due to the nature of the condition patients with ALS require the assistance of informal caregivers whose task is demanding and can lead to high feelings of burden. This study aims to predict caregiver burden and identify related features using machine learning techniques.
Design This included demographic and socioeconomic information, quality of life, anxiety and depression questionnaires, for patients and carers, resource use of patients and clinical information. The method used for prediction was the Random forest algorithm.
Setting and participants This study investigates a cohort of 90 patients and their primary caregiver at three different time-points. The patients were attending the National ALS/Motor Neuron Disease Multidisciplinary Clinic at Beaumont Hospital, Dublin.
Results The caregiver’s quality of life and psychological distress were the most predictive features of burden (0.92 sensitivity and 0.78 specificity). The most predictive features for Clinical Decision Support model were associated with the weekly caregiving duties of the primary caregiver as well as their age and health and also the patient’s physical functioning and age of onset. However, this model had a lower sensitivity and specificity score (0.84 and 0.72, respectively). The ability of patients without gastrostomy to cut food and handle utensils was also highly predictive of burden in this study. Generally, our models are better in predicting the high-risk category, and we suggest that information related to the caregiver’s quality of life and psychological distress is required.
Conclusion This work demonstrates a proof of concept of an informatics solution to identifying caregivers at risk of burden that could be incorporated into future care pathways.
- health informatics
- motor neurone disease
- neurology
- biotechnology & bioinformatics
This is an open access article distributed in accordance with the Creative Commons Attribution Non Commercial (CC BY-NC 4.0) license, which permits others to distribute, remix, adapt, build upon this work non-commercially, and license their derivative works on different terms, provided the original work is properly cited, appropriate credit is given, any changes made indicated, and the use is non-commercial. See: http://creativecommons.org/licenses/by-nc/4.0/.
Statistics from Altmetric.com
Strengths and limitations of this study
Use of a machine learning technique with an embedded feature selection routine allowed the inclusion of all the available information in the analysis to discover any feature that could be predictive and present it according to feature importance, which can provide some insight into the models’ decisions.
We built models that predict the caregivers’ burden with 0.92 sensitivity and 0.78 specificity, identifying those at high risk, using the Random Forest algorithm evaluated with a 10-fold cross-validation.
As it is common with medical data, our dataset had high dimensionality and missing data.
We have treated the patient–caregiver pairs at different time-points as independent and identically distributed random variables due to the small sample size.
Introduction
Amyotrophic lateral sclerosis (ALS), also known as motor neuron disease (MND), is a rare neurodegenerative disease of multiple, yet usually unknown, aetiologies. In Europe, there are 2–3 new cases out of 100 000 individuals per year.1 Although rare, the condition causes great disability and has a fatal trajectory, usually within 3–4 years from symptom onset.2 It is characterised by the progressive degeneration of upper and lower motor neurons, leading to atrophy of muscles and paralysis. The most common cause of death is respiratory failure due to gradual respiratory weakness. The symptoms are motor, such as muscle weakness, spasticity, dysphagia (difficulty in swallowing), dysarthria (difficulty in speaking) and muscle cramps and extra-motor, such as cognitive and behavioural impairment. Limb onset is the most common and accounts for about 60% of all cases, while bulbar onset accounts for 30% of cases, and the remaining rare cases present with respiratory onset.1 Regarding diagnosis, there is no one specific test to identify ALS; rather, it is a long process of medical examinations aiming to exclude the possibility of presence of any other condition with the same symptoms. A study had found that the median time interval between the first symptom and diagnosis is 12 months.3
As the condition progresses, patients require constant physical and moral support by a caregiver. As a result, the patients and their caregivers may need regular assessment and support. The nature of the disease as well as the increased responsibilities of the caregiver can result in high levels of burden; it was found that, due to the long journey from symptom onset to diagnosis, caregiver burden may appear prior to diagnosis.4 The term ‘caregiver burden’ represents the decline of the caregiver’s emotional or physical health, social life and financial status.5
The aim of this work is to determine risk factors for caregiver burden by classifying caregivers into a high or low burden group with the use of machine learning. Additionally, building a clinical decision support system (CDSS) that predicts caregiver burden can facilitate the provision of faster and more effective assistance to caregivers and more efficient resource management. A CDSS is a piece of software that incorporates available knowledge about patients to provide support to the healthcare practitioners towards better, faster and more personalised decision-making about their treatment. In this case, the CDSS would use patient and caregiver characteristics to indicate if a caregiver requires additional support for the alleviation of their burden. Moreover, the identification of risk factors of burden may help in addressing them.
A systematic review of papers that investigated patient and caregiver factors that are associated with caregiver burden found evidence of correlation between caregiver burden and the patient’s physical functioning and behavioural impairment, as well as the caregiver’s feelings of depression.6 Previous studies in Ireland to identify drivers of burden using statistical tests and linear regression models7–10 had indicated that hours of care provided per week, quality of life and psychological distress were related to burden. Here, we use machine learning techniques that investigate more complex interactions between variables to reveal additional factors that are associated with burden and at the same time accurately predict those at risk of high burden.
Methods
Study participants
This is a cohort study of ALS patients and their primary caregiver to provide insight to the effects that demographical, medical, socioeconomic and psychological factors have on the primary caregiver. Ninety dyads of people with ALS and their primary caregiver were recruited for this study and were interviewed at their residence. The patients were attending the National ALS/MND multidisciplinary Clinic (MDC) at Beaumont Hospital, Dublin. The primary caregiver was the adult (over 18 years old) who took main responsibility for the patient by offering unpaid assistance. The patients and caregivers were identified through the MDC and were asked to consider participating in the study. Informed consent was obtained after follow-up interviews for their participation in the study as well as the retrieval of the patients’ clinical information through the National ALS/MND Register. The patient and caregiver information was pseudonymised after collection and before any data analytics was performed for this current work.
Data collection
Patients and caregivers were interviewed at 3 different time-points at 4–6-month intervals between May 2013 and June 2015 (T1, T2 and T3). Some patient–caregiver pairs were lost to follow-up and there might be 1 or 2, instead of 3 interview instances for them in the dataset. Each of the interviews that a patient–carer pair participated in included the same questions and was treated as an individual instance in our dataset. The questionnaires for the caregiver–patient pairs included demographic (gender, education, relationship between them, marital status, area of living and so on) and socioeconomic questions (car ownership, accommodation, health insurance, income and so on) as well as quality of life and anxiety and depression. Additionally, the patients were asked about their use of resources (number and duration of visits to general practitioner (GP)/therapists, use of different care services, counselling, medications, costs of services and so on), and the caregivers answered questions related to their level of burden. Finally, the information collected through the National ALS/MND Register included details of diagnosis (first symptom, onset, stage and so on) and information recorded in the clinic visit form (current stage, disease progression, interventions and so on). The patient’s cognitive and behavioural status was added to the set of input variables after the imputation of these two variables according to the last recorded status. More information on the methods of data collection can be found in online supplementary data.
Supplemental material
Data preprocessing
This study was performed in R Studio, using R V.3.5.1.11 Before creating the predictive models, the data were preprocessed and transformed in such a manner that would be useful for analysis and for the creation of the training and independent test datasets that the machine learning algorithms would use. The main issues with these data were their high dimensionality and missing values. Therefore, the variables with more than 30% of missing data were discarded due to concerns about introducing bias into the models. The instances with a missing Zarit Burden Interview (ZBI) score (the outcome) were removed too.
After this step, there were two categories of missing data in the remaining dataset: the case of ‘non-applicable’ answer to a question and the case where an answer was not given or the information was unavailable. The first type was replaced with the value 0 and the second type was imputed. We used two methods to impute the missing data. The first method that we used, replaced the missing data in each feature by the median value of that feature. The second technique used a machine learning algorithm, the Random Forest12 method, to predict the missing values. The R packages that were used for these tasks were ‘imputeMissings’13 and ‘missForest’ (using the default values),14 respectively. For the analysis of the data, open-ended questions were excluded or transformed into binary/numeric variables. To further reduce the number of redundant variables, the linear correlation between them was measured and the ones with the largest mean absolute correlation (higher than 0.8) were discarded (using method ‘findCorrelation’ from R package ‘caret’15). Finally, to account for all the changes that patients and caregivers went through in the different time-points, and due to the small sample size, each patient–caregiver dyad for each time-point was treated as an independent entry.
Data analysis
The outcome of interest in the study was caregiver burden. Previous work identified the presence of burden when the ZBI score was ≥24,16 which has been used in a similar study to identify burden predictors using simple statistics and linear regression.7 So, we also created a classification problem that would identify all those affected caregivers and what it is that reveals their difference to the non-affected ones. The caregiver burden was split in two categories to create a new binary variable with values ‘low burden’ (or ‘0’) if the ZBI score was less than 24 (103 caregivers) and ‘high burden’ (or ‘1’) otherwise (74 caregivers). Machine learning algorithms were trained to learn how to autonomously make this classification based on the predictive variables, that is, variables other than burden scores, for a new (previously ‘unseen’) combination of the predictive variables.
For this classification problem, the predictive method that was used was the Random Forest algorithm (using ‘randomForest’ R library, V.4.6–1417)—one of the most popular ensemble machine learning algorithms, with easy hyperparameter tuning and good accuracy in classifications in different sizes of data.18 19 This technique creates an ensemble of different decision trees and then uses majority ‘voting’ of all the trees’ outcomes to decide on how to classify each caregiver. It is less biased than using a simple decision tree and can still provide insight on how the decision was made, by looking at which variables were mostly used in the random forest. Its ensemble nature and the fact that each tree is created from a different data sample make the algorithm generalisable and accurate. Random forests have an embedded feature selection method which is useful for high-dimensional datasets like the one in this study, because they can identify variables that are related to the outcome automatically and result in a model with less features. Additionally, they can be used in cases when the number of features exceeds the number of instances in the data and have a very good performance even when most of the features are ‘noisy’ (irrelevant to the outcome).20 21 Finally, random forests can capture non-linear patterns in the data.22 Two other methods (least absolute shrinkage and selection operator and extreme gradient boosting) were benchmarked against the random forest; however, the performance was not as good (see online supplementary data).
Before applying this technique, the dataset was randomly split into a training and a test set. The training set was used to train the machine learning algorithms and consisted of 75% of the full dataset, while the remaining 25% was kept as an independent test set (see online supplementary table S1). We would like to note that all the preprocessing of the data was performed before this split. The data were ordered according to caregiver identification, so their interviews were consecutive in the dataset which was left as-is and randomly split in training and test sets. Furthermore, for the assessment of our selected machine learning algorithm in different subsets of the dataset, the random forest was trained in 10-fold cross-validation (CV), with one-tenth of the training dataset reserved for testing and each of the remaining nine-tenths used in turn for training. This results in 10 separate models of the training data. The 10-fold CV was performed on the training set, and the final model was also built using the training set and it was tested on the independent test set. The overall 10-fold CV results are the average of the results on each of the 10 folds. The results on the independent test set are obtained by ensembling all 10 models.
The measures that were used for the evaluation process were sensitivity, specificity and Matthews correlation coefficient (MCC),23 (see online supplementary data for the formulas). MCC is a number that describes the confusion matrix of true and false positives and negatives, and it takes into account if the two classes have different sizes. This number ranges from −1 to 1, with 1 meaning completely correct classifications, −1 completely false classifications and 0 would be equal to chance (50% of correct classifications). Finally, a receiver operating characteristic (ROC) curve analysis was performed to assess the results (using function “roc” from R package ‘pROC’, V.1.15.3,24). The ROC curve is a plot of the true positive rate (TPR), or sensitivity, against the false positive rate (FPR), which is equivalent to 1-specificity, for each different decision threshold. The closer the curve is to the upper left corner the better the balance between the TPR and FPR. In cases where the model can perfectly distinguish between the classes, the TPR is equal to 1 and the FPR is equal to 0. For all the measurements, the probability threshold that was used to distinguish between the two classes was 0.5.
Feature importance is measured according to the mean decrease of the Gini Index. The Gini Index is an indication of the purity of the partition of a dataset S. The weighted sum of the Gini indices is used to assess a split of S on a particular feature into k subsets Si. In the random forest, each of the trees uses a specific variable V to split a node, the decreases in the Gini Index are then averaged and the variables with the highest mean decrease are considered the most important. Variable importance was calculated based on the training set.
No patient and public involvement
This research was done without patient involvement. Patients were not invited to comment on the study design and were not consulted to develop patient relevant outcomes or interpret the results. Patients were not invited to contribute to the writing or editing of this document for readability or accuracy.
Results
Demographics
There were 90 patient–caregiver pairs that took part in the first interview (T1), 58 in the second (T2) and 41 in the third (T3) presented in a flowchart in the (see online supplementary figure S1). The following section presents a summary of the demographic information for each category of participants.
Patients
ALS patients had a mean age of 64.8 (SD=10.7, min=39.2 max=87.2). The percentage of male patients was 59% (53M, 37F). Sixty-four patients had spinal onset (71%) and the mean age of disease onset was 64.8 years, (median=65.1 years, SD=10.7 years, min=39.2, max=87.2 years). The average time from diagnosis to the baseline interview was 1.3 years (22.7 months), but the median value was 0.6 years (min=0.1 years, max=11.3 years). The distribution of time from diagnosis to the first interview is skewed right, and the mean is greatly affected by the extreme values like the maximum. Taking into consideration the fact that some of the patients (11 out of 90) had been diagnosed with different subtypes of ALS (primary lateral sclerosis (PLS), monomelic ALS, upper motor neuron predominant ALS) that would commonly cause a slower progression of the disease, the clinical demographics of the two separate groups are presented in table 1. This group is referred to as ‘Slower Variant ALS group’, while the rest of the patients (n=79) belong to the ‘ALS’ group. The average ALSFRS-R scores of the 73 patients that had a score recorded in the ALS Registry (17 missing) can be found in online supplementary table S2. Online supplementary table S3 shows the distribution of patients in different stages of ALS across time.
Comparison of demographic characteristics between the group of patients (n=79) with an ALS diagnosis and the group of patients (n=11) with a PLS diagnosis or a distinct phenotype (upper motor neuron predominant ALS, monomelic ALS)
Caregivers
The majority of caregivers were female (63 female carers, 70%) and the average caregiver age was 55.5 years of age (SD=13.2 years, min=25.3, max=80.3). At the first interview 63 caregivers were spouses/partners (70%), 19 caregivers were sons/daughters (21%), 2 caregivers were parents (2.2%), 4 caregivers were siblings (4.4%) and 1 caregiver was a friend (1.1%). Caregiving hours per week at baseline ranged from 0 to 168, with a mean value of 45.6 hours (median=28, SD=47.3). The level of burden according to the ZBI can range from 0 to 88. In this cohort, the ZBI score at baseline ranged between 1 and 65, with a mean value of 26.9.
Machine learning
Following the initial preprocessing to remove non-informative features and entries, 177 observations (that had a recorded burden score) and 232 predictive features (out of 529) remained when missForest was used and 234 when the median value was used to impute missing data. The 177 observations include caregiver–patient dyads from all 3 interviews.
After the two different methods of imputation were applied to these data, a random forest process was used, creating model M1 from the missForest-imputed data and model M4 from the median-imputed data. The 25 most important features of M1 and M4 were selected and were used as the predictive features to create models M2 and M5, respectively. Finally, the 15 most important features of M1 and M4 were used as the predictive features to create models M3 and M6. This method identified the important predictors of caregiver burden based on available data.
The results from all the random forests are presented in table 2. In the ‘parameters’ field, ‘trees’ represent the number of trees in the random forest, and ‘mtry’ is the number of variables available for splitting at each tree node. We experimented using a few different values for the ntree and mtry hyperparameters to choose the ones that performed better. In the small (15-variable datasets) we experimented with 60, 80 and 100 trees, and in the rest with 100, 150 and 200 trees. For mtry, we experimented with the default value and a value close to the default to see if there was a change, and selected the one with the better performance. ‘Sen’ and ‘Spec’ are the sensitivity and specificity, respectively, ‘MCC’ is Matthews Correlation Coefficient, and ‘AUC’ is the area under the ROC curve. The metrics that resulted from the 10-fold CV are represented by their average values. M2 (highlighted in the table) is the best model as it has the highest values in all the metrics in the independent test set while only using 25 variables, and while performing well in the 10-fold CV (almost equally to M6). The ROC curves for all the test data can be found in the online supplementary figure S2.
Validation of predictive models M1–M6
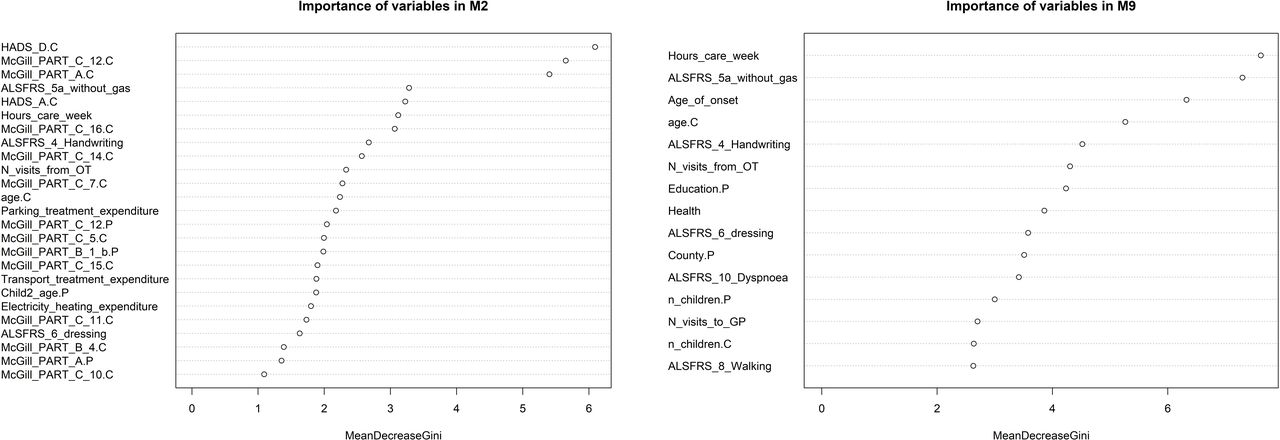
The model’s features in order of importance according to the mean decrease of the Gini Index are presented in figure 1. The importance of variables for the remaining models are shown in the online supplementary figure S3. Variable importance was calculated based on the training set. The suffix ‘.C’ represents caregiver features and the suffix ‘.P’ represents patient features. They are used to distinguish features that existed in both groups.
Most important variables of best models: M2 and M9 according to mean decrease of the Gini Index.
Subset of variables
In addition to exploring the data and building models using all the available information, a smaller dataset that would only use information that can be routinely collected at the point of care was used. This way, a CDSS embedded in the ALS Register could retrieve that information and alert about a high-risk caregiver. The clinical information of the patient, such as their level of disability or the visits to the accident and emergency (A&E) department due to a fall (which was the most common reason of a visit to the A&E) could have an effect on the levels of caregiver burden, as assisting them may be more challenging for the caregiver in some cases. Support that is given to the patient or caregiver in the form of a grant or a medical card could also have an effect on the caregiver’s burden, as per the definition of the term. Finally, other demographic information such as the number of children they have, their county of residence (and as a result, how hard travelling for medical purposes is), level of education, financial support and employment status could contribute to psychological distress and burden. A list of the subset of 76 variables that were selected is presented in the online supplementary data.
A similar process as before was performed on both missForest-imputed and median-imputed datasets. Table 3 shows the results of these models and we can see a reduction in the predictive power. Although the models’ results are very similar, we suggest that M9 is the best model as it has high metrics in the independent test set and the 10-fold CV and uses fewer variables with very small ‘sacrifices’ in accuracy. By looking at the ROC plots in online supplementary figure S4 and S5, it is clear that to increase the specificity score, one would need to sacrifice the high sensitivity value, as the curve markedly deviates from the upper left corner. Variables in order of importance for the model are shown in figure 1, while for the remaining models they can be found in the online supplementary figure S5.
Validation of predictive models M7–M12
Discussion
The aim of this study was first to determine the caregiver and patient characteristics that are associated with caregiver burden in ALS and second to model these associations in a manner that would allow a system to alert healthcare professionals about a caregiver’s risk of high burden. We used the random forest algorithm to model the data using all the available information (features) for the first task and using a selected subset of the features for the second task.
Regarding the set of models to achieve the first aim, we observed small differences in the performance of the random forest between the two types of imputation methods used. Considering the small size of our independent test dataset, the differences in the correctly classified caregivers in the ‘high’ and ‘low burden’ classes are very small, despite the fact that the metrics look quite different. Model M2, which used 25 variables, had the best performance, as all its evaluation metrics were higher. The high burden class was predicted with a high degree of accuracy (92% correct classifications on the independent test dataset), while for the low burden class, 78% of the caregivers were correctly classified.
The random forest is an algorithm that provides a degree of transparency which allows for the identification of the most predictive features and how much they contributed to the final result. The three factors that were identified by the best model as the most important according to the mean decrease of the Gini Index are: the caregivers’ total score of depression (HADS (Hospital Anxiety and Depression Scale) Depression score), the amount of control they feel they have over their lives (McGill Part C Question 12) and their overall perception of their quality of life (McGill Part A). Other important factors were: the patients’ ability to cut food and handle utensils if they have not had a gastrostomy (ALSFRS-R Score on 5a), the caregivers’ total score of anxiety (HADS Anxiety score), the hours that they need to provide care to the patient per week, the level of support that they feel (McGill Part C Question 16), the patients’ handwriting capability (ALSFRS-R Score on 4), the level of burden the caregivers express in McGill Part C Question 14, the number of visits from the occupational therapist (OT) to the patient, the amount of time the caregivers feel sad (McGill Part C Question 7), the caregivers’ age, the patient’s expenditure on parking and transportation to access treatment (for 6 months), the amount of control the patients feel they have over their lives (McGill Part C Question 12), the caregivers’ level of depression in McGill Part C Question 5, the most troublesome symptom or problem the patients express in McGill Part B Question 1, the age of the patient’s second child, the patients’ expenses on electricity for heating, how worthwhile the caregivers find their life to be (McGill Part C Question 11), how they feel physically (McGill Part B Question 4), the level of progress they feel they have in achieving life goals (McGill Part C Question 10), the patients’ independence in performing their dressing and hygiene routine (ALSFRS-R Score on 6) and their overall perception of their quality of life (McGill Part A).
In the current work, we identified the specific attributes of the caregiver’s quality of life assessment and patient’s physical dysfunctions that are predictive of caregiver burden. These findings are in agreement with previous studies6–10 that had found an association between the caregiver’s burden and the hours of weekly care they provide, their quality of life and psychological distress, as well as the patient’s physical functioning (ALSFRS-R score). It is worthwhile noting at this point that association between the predictive variables and the outcome does not necessarily show a cause-and-effect relationship between them. The age of the patient’s second child likely reflects the existence of competing responsibilities that could affect the level of burden the caregiver experiences. Another newly found factor was the number of visits from the OT, and the way this relates to the burden is unclear. However, as the OT is responsible for helping the patient with their everyday activities, and some of the significant factors that the model found were measures of the patient’s capability of performing such tasks, we can see some form of association. Also, the expenditure on parking to access treatment could signify the number and duration of visits to the health practitioners according to the level of severity of the patient’s condition, hence the association with the caregiver’s burden. The primary caregiver will probably be present at all of these visits as well, so, this feature, along with the transportation expenses, could represent something other than a financial issue. Additionally, this study has shown, using a novel approach to the area, a heretofore unreported significant predictor of caregiver burden which previous work including our own detailed qualitative study did not display.8 While we accept that this result would need to be replicated in another similar dataset, we think it shows that this novel methodology could be useful in uncovering clinically meaningful predictors which are not easily revealed by the more standard approaches in the field. If this particular predictor was shown to be significant in a replication study, this would have clinical implications in terms of advice and recommendations around feeding in consultations with certain patient subgroups that was previously unidentified. Such an implication is indeed meaningful in a condition where the main treatment remains symptom management. It also points to the potential usefulness of the methodology being applied to similar datasets in other cohort studies of neurodegenerative diseases. We identified some of the patient’s self-reported quality of life information to also be predictive of caregiver burden. We might expect this type of connection here as low quality of life or independence in the patient’s life could mean higher responsibilities or psychological decline for the caregiver and vice versa. Finally, although the patient’s cognitive and behavioural status was included in the set of input variables, we found no correlation with the outcome in this study, although previous work by de Wit et al6 has shown a correlation between the caregiver’s burden and the patient’s behavioural impairment. The fact that this finding is at variance with that of previous work, possibly reflects the relatively low proportion of patients in this cohort with significant behavioural impairment and a relative insensitivity of the machine learning model to segregate patients with different types of cognitive/behavioural change.
Based on the outcomes of the current study, we suggest that the provision of psychologically adjusted assistance10 or additional formal or informal social support is likely to be of benefit to caregivers.25 Another recommendation is to introduce a telehealth-based intervention that will allow patients and caregivers to have remote appointments with the specialists instead of visits, as this is shown to have a positive effect on chronic disease care.26
We explored the development of a CDSS that could alert when a caregiver is at high burden risk, using data that could be routinely collected as part of the ALS register. Therefore, information about the caregiver’s quality of life, as well as the anxiety and depression scores, that had been identified as the most important features for predicting the level of burden, were excluded from this reduced feature set as this information would not be in the Register. As expected, the predictive models that were built based on this reduced feature set performed worse than the ones that used the full set of features. However, this model may still prove useful in the absence of more detailed caregiver data. Caregivers with low burden will be misclassified as having high burden in almost 30% of cases, however, the algorithms can capture most of the caregivers that truly belong to the high burden category (84%).
The features with the highest importance according to the mean decrease of the Gini Index in the best model were the weekly caregiving duties of the primary caregivers (in hours), the patients’ ability to cut food and handle utensils if they have not had a gastrostomy (ALSFRS-R Score on 5a), the patients’ age of onset and the caregivers’ age. Other important factors include: the patient’s handwriting capability (ALSFRS-R Score on 4), number of visits to the GP and from the OT, county of residence, level of education, independence in performing their dressing and hygiene routine (ALSFRS-R Score on 6), independence in walking (ALSFRS-R Score on 8), level of dyspnoia (ALSFRS-R Score on 10), the number of children the patient and caregiver have and the caregiver’s health condition (self-assessed in a scale of 0—poor to 5—excellet).
It can be noted that all models predict the high burden class (positives) better than the low burden class (negatives). The main challenge of this work has been the small sample size combined with the high dimensionality of the dataset and the missing data, thus, we suggest that further work is required to validate the models we have developed on larger independent test sets. However, the Random Forest algorithm has been shown to perform well even on datasets of this size18 19 as well as on datasets where the number of features is bigger than that of the samples or when there are many ‘noisy’ features.20 21 Despite of the challenges and limitations in the study design, the data show that machine learning can reliably identify caregivers who are likely to experience high levels of burden. Future work could focus on different approaches that would account for the relatedness and time dependency within the data, as the different interviews of the same patient–carer pair were treated as independent entries in this study. While additional work will be required to refine the model, the work demonstrates a proof of concept of an informatics solution to identifying caregivers at risk that can be incorporated into future care pathways.
References
Footnotes
Twitter @anna_antoniadi
Author contributions statement AMA and CM designed and developed the study, analysed and interpreted the data, and drafted the initial manuscript. MG, MH and OH were involved in the acquisition of data, the development of the research question and assisted with analysis and interpretation of data. All authors revised the drafts for intellectual content and edited the manuscript. All authors reviewed and approved the final draft.
Funding This publication has emanated from research supported in part by a research grant from Science Foundation Ireland (SFI) under Grant Number 16/RC/3948 and co-funded under the European Regional Development Fund and by FutureNeuro industry partners. It was also made possible through funding from the Irish Health Research Board Dublin (http://www.hrb.ie), as part of the HRB Interdisciplinary Capacity Enhancement Awards (ICE/2012/6) and HRB-JPND/2013/1 as well as by funding through the Clinical Management Grant from the American ALS Association (17 CM-324) (http://www.alsa.org).
Competing interests OH is the Editor in Chief of the Amyotrophic Lateral Sclerosis and the Frontotemporal Degenerations journal and is a member of the editorial board of the Journal of Neurology, Neurosurgery and Psychiatry.
Patient consent for publication Not required.
Ethics approval This study was granted ethical approval from Beaumont Hospital Medical Research Ethics Committee, and all participants provided informed written consent.
Provenance and peer review Not commissioned; externally peer reviewed.
Data availability statement Data are available upon reasonable request. No additional data are available. The material generated and analysed during the current study cannot be made publicly available for reasons of privacy and confidentiality (Beaumont Hospital Medical Research Ethics Committee). However, access to deidentified data sets can be made on request to Hospital Mr Mark Medical Heverin Research (mark.heverin@tcd.ie).