Article Text

Abstract
Objective The aim was to compare multimorbidity patterns identified with the two most commonly used methods: hierarchical cluster analysis (HCA) and exploratory factor analysis (EFA) in a large primary care database. Specific objectives were: (1) to determine whether choice of method affects the composition of these patterns and (2) to consider the potential application of each method in the clinical setting.
Design Cross-sectional study. Diagnoses were based on the 263 corresponding blocks of the International Classification of Diseases version 10. Multimorbidity patterns were identified using HCA and EFA. Analysis was stratified by sex, and results compared for each method.
Setting and participants Electronic health records for 408 994 patients with multimorbidity aged 45–64 years in 274 primary health care teams from 2010 in Catalonia, Spain.
Results HCA identified 53 clusters for women, with just 12 clusters including at least 2 diagnoses, and 15 clusters for men, all of them including at least two diagnoses. EFA showed 9 factors for women and 10 factors for men. We observed differences by sex and method of analysis, although some patterns were consistent. Three combinations of diseases were observed consistently across sex groups and across both methods: hypertension and obesity, spondylopathies and deforming dorsopathies, and dermatitis eczema and mycosis.
Conclusions This study showed that multimorbidity patterns vary depending on the method of analysis used (HCA vs EFA) and provided new evidence about the known limitations of attempts to compare multimorbidity patterns in real-world data studies. We found that EFA was useful in describing comorbidity relationships and HCA could be useful for in-depth study of multimorbidity. Our results suggest possible applications for each of these methods in clinical and research settings, and add information about some aspects that must be considered in standardisation of future studies: spectrum of diseases, data usage and methods of analysis.
- multimorbidity
- cluster analysis
- factor analysis
- primary health care
- electronic health records
- diseases
This is an Open Access article distributed in accordance with the Creative Commons Attribution Non Commercial (CC BY-NC 4.0) license, which permits others to distribute, remix, adapt, build upon this work non-commercially, and license their derivative works on different terms, provided the original work is properly cited and the use is non-commercial. See: http://creativecommons.org/licenses/by-nc/4.0/
Statistics from Altmetric.com
Strengths and limitations of this study
This is one of the first studies to compare the two methodologies most commonly used to obtain patterns of multimorbidity, hierarchical cluster analysis and exploratory factor analysis.
The dual analysis was performed in a large, high-quality database of primary care electronic health records that have been shown to be representative of a much larger population, stratified by sex.
Internal validation with bootstrap methods provided more robust evidence for the cluster analysis.
The agglomerative hierarchical clustering forces every unit into a single cluster, is exploratory in nature and different clustering algorithms may produce different results.
The study is cross-sectional and further studies are needed to analyse the patterns that develop longitudinally as individual patients acquire subsequent comorbidities.
Introduction
The reliable identification of patterns of multimorbidity is a critical step in developing healthcare services sensitive to the health needs of these patients.1 Recent reviews of multimorbidity patterns have shown that individual studies differ widely in their design and choice of epidemiological and statistical methods, including sampling frameworks and selection criteria, coding systems, eligible diseases and definition of disease clustering patterns.2–4 These studies highlight the lack of consensus to measure patterns of comorbidity and multimorbidity. In recent years, the number of studies based on real-world data (RWD)5 has increased significantly, which makes it even more difficult to establish a consensus on how to measure comorbidity and multimorbidity patterns. Although much more information is available, the different databases may not be comparable, making it difficult to arrive at observations and draw firm conclusions. It also limits our ability to compare analyses using RWD and to evaluate whether one approach may be better suited to the purpose. Therefore, it is difficult to identify multimorbidity patterns and provide adequate health services according to the population needs.
The most frequent methods used to date have been hierarchical cluster analysis (HCA) and exploratory factor analysis (EFA), which offer very different approaches and solutions.2 3 Both are descriptive methods to identify association of diagnoses and determine patterns of multimorbidity. HCA obtains the patterns of multimorbidity from the dissimilarities between diseases, while EFA is based on correlations between diagnoses to identify the patterns. The HCA clusters tend to contain diagnoses that are similar to each other (in terms of Euclidean distances), but dissimilar from the diagnoses in other clusters; no diagnosis can be included in more than one cluster. In contrast, EFA along with confirmatory factor analysis are primarily used to test hypothesised relationships between observed measures and latent constructs. In addition, EFA allows for inclusion of any diagnosis in multiple factors as they can present significant correlations with more than one factor.6–9
For all these reasons, the aim was to compare multimorbidity patterns identified with the two most commonly used methods: HCA and EFA in a large primary care database. Specific objectives were (1) to determine whether choice of method affects the composition of these patterns and (2) to consider the potential application of each method in the clinical setting.
Methods
Design, setting and study population
A cross-sectional study was conducted in Catalonia (Spain), a Mediterranean region with 7 434 632 inhabitants, 81% of which live in urban municipalities (2010 Census). The Spanish National Health Service provides universal coverage, financed mainly by tax revenue. The Catalan Health Institute (CHI) manages primary health care teams (PHCTs) that serve 5 501 784 patients (274 PHCT) or 74% of the population; the remaining PHCTs are managed by other providers. The CHI’s Information System for Research in Primary Care (SIDIAP) contains the coded clinical information recorded in electronic health records (EHR) by its 274 PHCTs since 2006. A subset of records meeting the highest quality criteria for clinical data (SIDIAP-Q) includes 40% of the SIDIAP population (1 833 125 individuals), attended by the 1365 general practitioners whose data recording scores contain information on the majority of the population of Catalonia, and is highly representative for the whole region in terms of geography, age, gender and diseases.10–12
Prevalence of individual conditions varies with age and so does multimorbidity and their patterns. In order to obtain a more homogeneous sample in terms of multimorbidity, we focused on individuals aged 45–64 years.13–16 We identified 408 944 individuals aged 45–64 years on 31 December 2010 with two or more diagnoses (online supplementary appendix 1).
Supplementary file 1
Coding and selection of diseases
Diseases are coded in SIDIAP using International Classification of Diseases version 10 (ICD-10). For this study, we selected all active diagnoses recorded in EHR as of 31 December 2010, except for R codes (symptoms, signs, and abnormal clinical and laboratory findings, not elsewhere classified) and Z codes (factors influencing health status and contact with health services).17 Non-active diagnoses were excluded, based on the presence of an end date in the EHR. These diagnoses cover a broad list of acute diseases for which the system automatically assigns an end date (eg, 60 days after the initial diagnosis).
To facilitate management of the diagnostic information, the diagnoses were extracted using the 263 blocks (disease categories) in the ICD-10 structure. These are homogeneous categories of very closely related specific diagnoses. For example, hypertensive diseases include essential (primary) hypertension, hypertensive heart disease, hypertensive renal disease, hypertensive heart and renal disease and secondary hypertension. To obtain consistent and clinically interpretable patterns of association, and to avoid spurious relationships that could bias the results, we considered only diagnoses with greater than 1% prevalence in each sex. All patients with multimorbidity (two or more coexisting diagnoses recorded in the EHR on 31 December 2010) were included.
Variables
The variables considered were: diagnosis (values: 1 for present, 0 for absent), number of diseases (2, 3, 4 and 5 or more) and sex (women, men) were also recorded for each patient.
Statistical analysis
Data access: data were obtained from SIDIAP after the study was authorised. All the project’s authors could access the database. Cleaning methods: the analysis was limited to SIDIAP-Q, as the sample was representative of the population.10–12 No missing values were handled as sex and age were recorded for all population. Wrong sex-specific diagnoses codes and diagnoses with inconsistent dates were excluded. An individual with no disease diagnoses record was considered as disease free.
Analyses were stratified by sex. Descriptive statistics were used to summarise overall information. Categorical variables were expressed as frequencies (percentage) and continuous as mean (SD) or median (IQR). Two sample test of proportions and Mann-Whitney U test were used to test differences by sex.
We identified disease patterns using two approaches: (1) HCA and (2) EFA. Clinical criteria were used to evaluate the consistency and utility of the final HCA and EFA solutions, based on previously described patterns in the literature and a consensus opinion drawn from the clinical experience of the research team (four family physicians, one epidemiologist). Clusters and factors in these analyses were considered as two sets of grouping solutions, which were then assigned to each individual patient. We considered patients to be associated with a given grouping solution if they had ≥1 diagnoses in that solution, allowing for the calculation of the prevalence of each solution in the sample. Patients could be associated with more than one solution in the same set. We also calculated prevalence, restricting the assignment of patients to those with ≥2 diagnoses in the same solution.
Hierarchical cluster analysis
The HCA approach assigns diagnoses to groups or clusters, so that diagnoses in the same cluster are more similar, based on a given measure, to one another than to diagnoses from different clusters. The Jaccard coefficient was used to measure similarity. This coefficient considers only the diagnoses that any two patients have and ignores the diagnoses that neither of them has.6 As we do not know a priori the number of clusters to retain from the data, we used agglomerative hierarchical methods to identify possible clustering solutions: average linkage, Ward, flexible beta and other methods with less bias, based on non-parametric estimates, such as single linkage and density linkage. All but Ward method and the flexible-beta methods successively chained the observations into one cluster. Therefore, the Ward method, which minimises the variance within clusters and produces clusters of similar sizes, was chosen as the primary method based on analysis.6 Data were randomly split into test and training datasets, equal in size and analysed separately. We ran the Ward method on both samples. The semipartial R2, Calinski-Harabasz pseudo-F statistic and pseudo-T2 statistic criteria for different numbers of clusters were examined.6 Clustering solutions were compared between the test and training datasets, taking into account the number of clusters, Adjusted Rand Index and clinical criteria. After checking algorithm stability, Ward method was run on the full data set, applying the same criteria to different numbers of clusters. Results were compared with flexible-beta results, with beta values set at −0.25 and −0.5. The criteria for selecting the number of clusters were the highest adjusted Rand index with a high number of clusters and a high pseudo T2 statistic.6 To assess internal cluster quality, we applied multiscale bootstrap resampling to obtain an approximately unbiased (AU) probability. This probability (‘P value’) is the proportion of bootstrapped samples that contain the cluster; larger P values indicate more support for the cluster.18
Multidimensional scaling (MDS) considering two dimensions was used to discover the underlying structure of distance measures between diseases in the cluster analysis. Essentially, MDS assigns observations to specific locations in a conceptual space such that the distances between points in the space match the given dissimilarities as closely as possible. We carried out classical MDS using the distance matrix obtained in the cluster analysis that considered the Jaccard coefficient as a dissimilarity measure. The conceptual map of the diseases distinguishes between the intradisease cluster and the interdisease cluster. Taking into account the final cluster’s solution and the obtained groups, conceptual maps of the diseases were created. For a better interpretation of the conceptual map, prevalence of the disease was represented as the radius of the circle.19
Exploratory factor analysis
EFA reduces the observed set of diagnoses to a smaller number of latent factors that account for the correlations between them. As the study variables were dichotomous, the correlation matrix between the diagnoses was computed using tetrachoric correlations. The factorability of the matrix was tested using Bartlett test of sphericity and Kaiser-Meyer-Olkin (KMO) Measure of Sampling Adequacy. The extraction of the initial solution was carried out using the principal factors method with squared multiple correlations for the prior communality estimates. The optimal number of extracted factors for the final solution was determined with the Scree plot using the ‘elbow’ rule and setting the percentage of variance equal to 100%. Factor loadings were analysed to identify factor patterns. An oblique rotation, Oblimin, was performed to clarify the factor pattern in order to better interpret the nature of the factors, as we assumed that factors were allowed to be associated with each other. As a rule of thumb, factor loadings greater than or equal to 0.30 in absolute value were considered to be significant.7
Comparing multimorbidity patterns
We compared every cluster and factor solutions across sex groups agreement and the diagnoses included in it.
We considered grouping solutions (HCA vs EFA) from different sets (women vs men) to have the following degrees of similarity: (1) perfect, when the solution included exactly the same diseases as another solution in the other comparison group (sex or statistical approach); (2) partial, when the solution included a subset of diseases present in a solution in the other comparison group and (3) none, when each and every disease in the solution was part of a different solution in the other group and none was part of the same solution. These groups were named using the abbreviation of sex, method and number (eg, MC1: men cluster 1).
We further extracted the common subsets of diseases within partially similar solutions, which together with completely similar solutions gave a comprehensive picture of overlapping cluster and factor analysis solutions.
The analyses were performed using SPSS for Windows, V.18, SAS V.9.2 for Windows and R V.3.1.2 (R Foundation for Statistical Computing, Vienna, Austria).
Results
Of 523 656 patients, 408 994 (78.1%) met the multimorbidity criteria; women had a higher multimorbidity prevalence than men (82.2% vs 73.9%, respectively; P<0.001) (table 1). Both cluster and factor analyses included 79 diagnoses for women and 73 for men.
Number of diseases, clusters and factors identified in cluster and factorial analysis for patients agec 45–64 years, stratified by sex (n=523 656)
Hierarchical cluster analysis
Using HCA with the Ward method, we obtained 53 clusters, with just 12 clusters grouping at least 2 diagnoses for women and 15 clusters for men (table 1). We describe only the four most prevalent clusters (table 2). For a complete description of the clusters and dendrograms, see online supplementary appendices 2–5.
Four most prevalent clusters, by sex group (N (women)=217 823; N (men)=191 171)
Twelve clusters with at least two diseases were identified for women, with prevalences ranging from 6.6% to 82.1% (median: 15.5%), (WC3; WC10). The clusters identified in men had prevalences ranging from 3.2% to 83.8% (median 10.1%). The most prevalent cluster included eight diseases in women (WC1: musculoskeletal, psychiatric, circulatory, gynaecological and neoplasms) and six in men (MC1: metabolic and circulatory); about half of all patients had at least two diagnoses (52.9% of women and 50.4% of men).
Two clusters were common to men and women, ‘spondylopathies’ and ‘deforming dorsopathies’ (WC11, MC13) and ‘urolithiasis’ and ‘other diseases of the urinary systems’ (WC9, MC12) (box 1). The remaining clusters showed partial similarity in men and women, based on six subsets (box 2), except for three clusters found only in women (WC3, WC7, WC10) and six only in men (MC4, MC5, MC8, MC10, MC14, MC15) (online supplementary appendices 4–5).
Combinations of diseases consistent in both men and women*
Clusters
Complete (whole) clusters
M45–M49: spondylopathies†
M40–M43: deforming dorsopathies (WC11; MC13)‡
N20–N23: urolithiasis
N30–N39: other diseases of urinary system (WC9; MC12)
Subsets within clusters
E65–E68: obesity and other hyperalimentation
I10–I15: hypertensive diseases
E10–E14: diabetes mellitus (WC2; MC1)
M15–M19: arthrosis
M20–M25: other joint disorders
I80–I89: diseases of veins, lymphatic vessels and lymph nodes, not elsewhere classified
M70–M79: other soft tissue disorders
D10–D36: Bbenign neoplasms (WC1; MC2)
L20–L30: dermatitis and eczema
B35–B49: mycoses
K00–K14: diseases of oral cavity, salivary glands and jaws
J00–J06: acute upper respiratory infections (WC4; MC3)
K70–K77: diseases of liver
K80–K87: disorders of gallbladder, biliary tract and pancreas (WC12; MC7)
J30–J39: other diseases of upper respiratory tract
J40–J47: chronic lower respiratory diseases (WC6; MC3)
K20–K31: diseases of oesophagus, stomach and duodenum
K40–K46: hernia (WC5; MC2)
G50–G59: nerve, nerve root and plexus disorders
M65–M68: disorders of synovium and tendon (WC8; MC6)
Factors*
Subgroups within factors
I10–I15: hypertensive diseases
I20–I25: Iischaemic heart diseases
I30–I52: other forms of heart disease
I70–I79: diseases of arteries, arterioles and capillaries (WF3; MF2)
I10–I15: hypertensive diseases
E65–E68: obesity and other hyperalimentation (WF2; MF1)
J00–J06: acute upper respiratory infections
J20–J22: other acute lower respiratory infections
J09–J18: influenza and pneumonia
B25–B34: other viral diseases
A00–A09: intestinal infectious diseases (WF4; MF6)
M15–M19: arthrosis
M45–M49: spondylopathies
M40–M43: deforming dorsopathies
M50–M54: other dorsopathies (WF1; MF4)
K20–K31: diseases of oesophagus, stomach and duodenum
Q38–Q45: other congenital malformations of the digestive system (WF6; MF8)
L20–L30: dermatitis and eczema
B35–B49: mycoses
H53–H54: visual disturbances and blindness
H10–H13: disorders of conjunctiva
L80–L99: other disorders of the skin and subcutaneous tissue (WF5; MF5)
H25–H28: ddisorders of lens
H30–H36: disorders of choroid and retina (WF3; MF7)
Underlined blocks of diagnosis represent coincident diseases in pattern.
*No two full factors were exactly the same for both sexes.
†Coincident disease in both sexes.
‡Abbreviation of sSex (W,: wWomen; M:, mMen), method (C:, hHierarchical Ccluster aAnalysis; F:, Ffactor Aanalysis) and number (eg,.q, WC1: wWomen Ccluster 1).
Combinations of diseases consistent across statistical methods (cluster and factor analysis)*
Women
I10–I15: hypertensive diseases†
E65–E68: obesity and other hyperalimentation
E10–E14: diabetes mellitus (WC2; WF2)‡
M15–M19: arthrosis
M50–M54: other dorsopathies
M70–M79: other soft-tissue disorders (WC1; WF1)
L20–L30: dermatitis and eczema
B35–B49: mycoses (WC4; WF5)
M45–M49: spondylopathies
M40–M43: deforming dorsopathies (WC11; WF1)
K20–K31: diseases of oesophagus, stomach and duodenum
K40–K46: hernia (WC5; WF6)
K70–K77: diseases of liver
K80–K87: disorders of gallbladder, biliary tract and pancreas (WC12; WF6)
Men
I10–I15: hypertensive diseases
E65–E68: obesity and other hyperalimentation
E70–E90: metabolic disorders (MC1; MF1)
I20–I25: ischaemic heart diseases
I30–I52: other forms of heart disease
I60–I69: cerebrovascular diseases
I70–I79: diseases of arteries, arterioles and capillaries
N17–N19: renal failure (MC5; MF2)
J09–J18: influenza and pneumonia
J20–J22: other acute lower respiratory infections
B25–B34: other viral diseases
A00–A09: intestinal infectious diseases (MC10; MF6)
H10–H13: disorders of conjunctiva
H53–H54: visual disturbances and blindness
L80–L99: other disorders of the skin and subcutaneous tissue (MC4; MF5)
M45–M49: spondylopathies
M40–M43: deforming dorsopathies (MC13; MF4)
L20–L30: dermatitis and eczema
B35–B49: mycoses (MC3; MF5)
K70–K77: diseases of liver
B15–B19: viral hepatitis (MC7; MF3)
T08–T14: injuries to unspecified part of trunk, limb or body region
S90–S99: injuries to the ankle and foot (MC8; MF9)
H25–H28: disorders of lens
H40–H42: glaucoma (MC14; MF7)
Underlined blocks of diagnosis represent coincident diseases in pattern.
*All subgroups of factors or clusters, no single cluster exactly the same as a factor.
†Coincident disease in both methods.
‡Abbreviation of sex (W, women; M, men), method (C, hierarchical cluster analysis; F, factor analysis) and number (eg, WC1: women cluster 1).
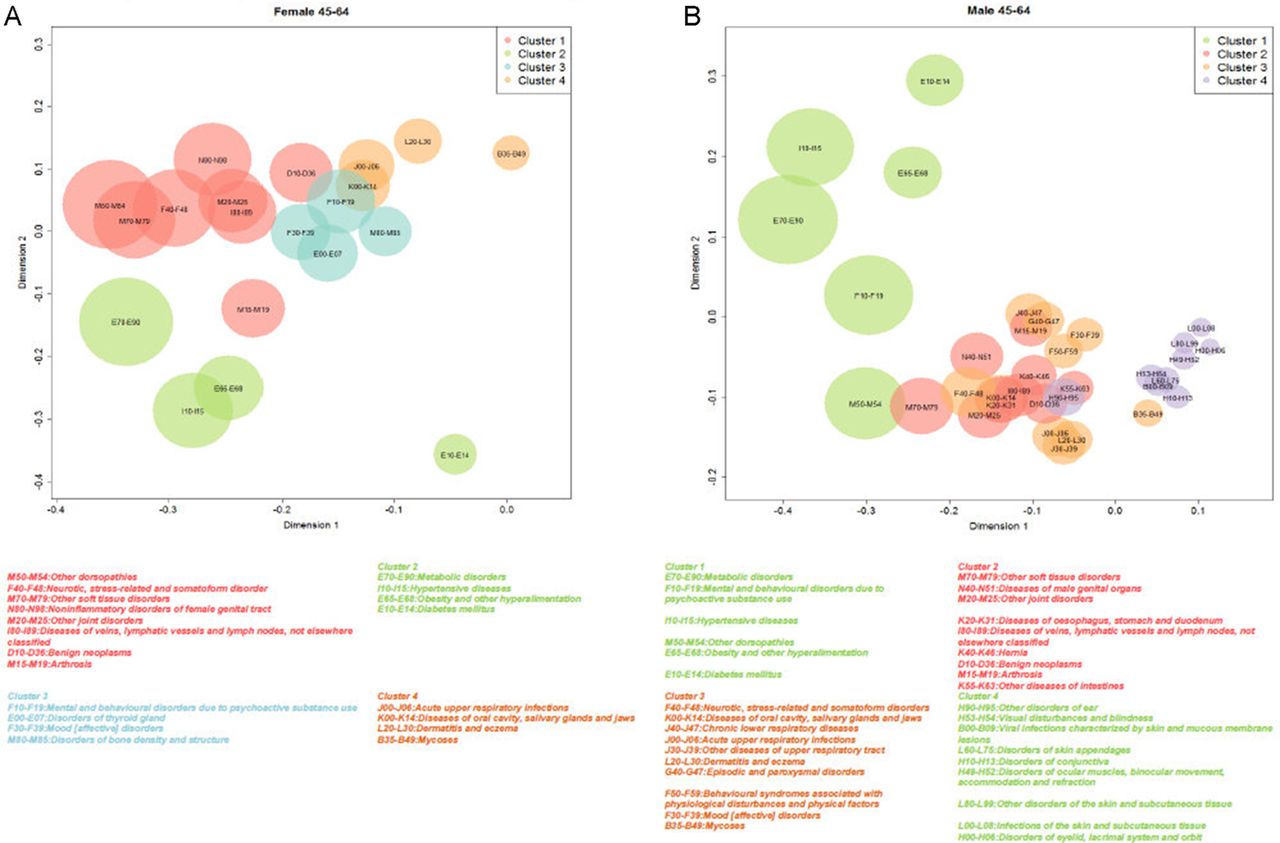
The top four clusters were reproduced in the graphical representation of coordinates using MDS. The most prevalent disease clusters were more clearly separated in women than they were in men, mostly due to the overlap of MC2 and MC3 (figure 1).

(A) Top four clusters in women (n=217 823) aged 45–64 years, analysed with multidimensional scaling (MDS). (B) Top four clusters in men (n=191 171) aged 45–64 years, analysed with MDS.
Exploratory factor analysis
Using EFA, we obtained 9 factors for women and 10 factors for men. In this analysis, the median number of diagnoses per factor was higher in women (table 1). Two factors explained more than 50% of total variance (58.5% for women (WF2; WF3) and 50.7% for men (MF1; MF2)). All diseases were assigned to single factors except for three diseases, two in women only (J20–J22: other acute lower respiratory infections and E10–E14: diabetes mellitus) and one in both women and men (I10–I15: hypertensive diseases); all three were assigned to two factors. The first four factors are described in table 3; full factor solutions are shown in online supplementary appendices 6–7.
Four most prevalent factors, by sex (N (women)=217 823; N (men)=191 171)
Although no factor-based groupings were identical in men and women, almost all showed partial similarity by sex, based on seven subsets (), except for two groups found only in women (WF7, WF9) and one found only in men (MF9).
Multimorbidity patterns comparison across statistical approaches
The EFA multimorbidity patterns were more easily interpreted than the HCA groups, either because they made more sense from a clinical perspective or because of greater homogeneity in the diagnoses: about half of the factors containing at least three diagnoses corresponded to a maximum of two ICD-10 blocks, compared with about one-fifth of the HCA clusters with at least three diseases (1/5 for women and 2/11 for men). No grouping solution for women or for men contained exactly the same set of diseases as a cluster and as a factor. Six clusters (WC3, WC6, WC7, WC8, WC9, WC10) and two factors (WF7, WF9) were only observed in women. However, six subsets of diseases were part of the same grouping in both a cluster and a factor (box 2); all included two or three diagnoses, usually from the same ICD chapter. Five clusters and one factor were observed only in men (MC6, MC9, MC11, MC12, MC15 and MF6). Nine subsets of diseases were observed as part of the same grouping in both a cluster and a factor (box 2). They included a range of diseases (2–5) and most frequently included diseases from different ICD chapters.
Three paired diseases were observed consistently in both men and women using both methods of analysis: (1) hypertensive diseases and obesity/other hyperalimentation; (2) spondylopathies and deforming dorsopathies and (3) dermatitis/eczema and mycoses.
Discussion
In this study have observed differences in the groupings identified with the two most frequently used methods (HCA and EFA). No grouping solution contained exactly the same set of diseases as a cluster and as a factor, although some overlap was observed in both groups. Internal quality validation with AU P values showed strong evidence of the multimorbidity patterns in the data.
The multimorbidity patterns obtained by HCA were identified graphically with MDS, allowing us to observe a given hierarchical structure. Nevertheless, internal quality validation with AU P values showed strong evidence of the multimorbidity patterns in the data.
EFA, based on tetrachoric correlations where the dichotomous diseases were assumed to come from an underlying mechanism with a continuous variable, produced a wide range of multimorbidity patterns with several levels of correlations. Most of them seem to be highly consistent from a clinical perspective. The multimorbidity patterns obtained with EFA show a main factor (a disease) that has a correlation with another disease, either coexisting or that may occur during the patient’s clinical course.20 Thus, EFA could be more useful for analysing comorbidity and for describing the correlation between diseases that have a pathophysiological relationship. This approach also may help to answer the question of which condition should be considered the main disease and which the comorbidity.
The HCA results would be useful in generating new hypotheses for intercluster and intracluster associations between diseases that could be applied to the analysis of multimorbidity, defined as the random coexistence of diseases or clusters that indicates significant associations between diseases without a causal explanation. In future studies, other non-HCA techniques will improve measurement of the observed distances and multiple interrelationships between different diseases in a given individual.21 On the other hand, EFA could be more useful for analysing multimorbidity patterns in the absence of causal comorbidity and for describing visual representation of diseases correlation with a pathophysiological relationship between them.
We obtained two perfect clusters that were common to both men and women: ‘spondylopathies and deforming dorsopathies’ and ‘urolithiasis and other diseases of the urinary system’. In the first cluster, spondylosis is a degenerative disorder that may cause loss of normal spinal structure and function and lead to scoliosis. Nevertheless, many individuals with untreated scoliosis will develop spondylosis; this may be one reason why these diseases were associated.22 The second cluster can be explained by the complications produced by urolithiasis (such as urinary tract infection, persistent proteinuria, stress incontinence or other unspecified urinary incontinence) and those that have a pathophysiological explanation.23 EFA showed that the most frequent pattern in women was infectious diseases. This previously unreported pattern suggests that the multimorbidity patterns obtained in other studies are affected by the type of diseases included in each study.
Although the patterns obtained with both methods did not match exactly, finding matching pairs of diseases by both methods reinforces the idea that patterns of multimorbidity have a dominant disease that associates in some way with other diseases.
In general, it is difficult to compare our results with other studies because of variations in methods, data sources and structures, and populations and diseases studied. Six studies have been performed with HCA8 21 24–27 and three using EFA.28–30 Until now, very few analyses of multimorbidity patterns have used multiple methods to compare the same population.21 The latter study included people aged 50 years and older, considering 11 diseases and using two different cluster methods, hierarchical (average linkage) and non-hierarchical (k-medoids), and one method for EFA (principal component analysis). The observed differences between this study and our results can be explained by differences in the underlying statistical formulae and diseases considered in both studies.
The major strength of this study is the dual analysis (HCA and EFA) of a large, high-quality database of primary care records that have been shown to be representative of a much larger population, stratified by sex. Admittedly, this analysis of almost all potential diagnoses may have added a complexity that will hinder interpretation of findings and comparison with other studies, particularly because the boundaries between chronic and acute disease are not always clear.31 32 Whatever consistency (or discrepancy) we observed was validated by the findings of two different approaches, which helps to identify the most appropriate use of each method in analysing multimorbidity. We emphasise that the inclusion of chronic and acute diseases is a strength and not a weakness. Because, as we have shown, there are many chronic and acute diseases that coexist at a set time and this has implications for healthcare.
Internal validation with bootstrap methods, AU P values and MDS techniques provided more robust evidence for the cluster analysis. The KMO values obtained show the adequacy of fit of the factor analysis. These values were similar or higher than previous studies.28 29
A limitation of this study is our use of agglomerative hierarchical clustering, which forces every unit (ie, diagnosis) into a single cluster. HCA is exploratory in nature, and different clustering algorithms may produce different results.33 The final clustering solution presented here was obtained through a systematic and rigorous process: comparing the results from a randomly split dataset, testing different clustering algorithms, and using different objective numeric criteria to decide the number of clusters, internal validation and graphical representation. In addition, a panel of experts applied subjective clinical criteria to assess the interpretability of the groupings in everyday practice. In addition, EFA is problematic for binary data, which can be grouped because of having similar distributions rather than any common underlying feature. On the other hand, in factor analysis the measure of association incorporates information on both positive and negative concordances.9 In contrast, the analysis of clusters allows us to show that the occurrence of one or more health conditions can be conditioned by their co-occurrence, without considering negative concordances.8 Due to the absence of a standard methodology to compare method solutions, we have used ad hoc methodology. Finally, another limitation is our use of ICD-10 3-character codes as the unit of analysis, rather than the more specific individual diagnosis, but its use is justified to avoid spurious relationships that more than 10 000 individual codes of the ICD-10 could produce.
This is a cross-sectional study, based on EHR of The CHI and SIDIAP-Q is highly representative for the whole region in terms of both geography, age, gender and diseases, that avoid selection bias.
Multimorbidity can present a problem for health services delivery, affecting patients, health professionals and managers who are attempting to improve service delivery. Our study offers two methodological approaches to understanding the relationships between specific diseases, which is an essential step in improving our approach to this problem. Although we demonstrated that different analytical methods can yield different results, we also showed that some associations were consistent in both analyses. This study illustrates the need to pay careful attention to the methods used to support policies and decision-making. Clinical guidelines tend to focus on a single disease rather than on multimorbidity, which includes diseases and drug interactions and polypharmacy. The present study confirmed that multimorbidity patterns are a reality in the adult population, and do not apply only to chronic diseases. New guidelines are needed that incorporate multimorbidity into clinical recommendations.
This study was one of the first to compare the two most commonly used methodologies, HCA and EFA, in a large database that includes a large number of diseases. The findings reveal another limitation to be taken into account in comparing multimorbidity patterns between studies: in addition to the spectrum, number and type of diseases included, these patterns vary depending on the method of analysis used. Nevertheless, it would be necessary to carry out a simulation study to determine how the choice of method may affect the patterns, as it allows us to test the obtained patterns in all kinds of situations.
The results suggest that HCA can be useful to detect multimorbidity patterns and identify different associations between diseases, as the method allows for the possibility that one or more health problems can occur conditionally. On the other hand, EFA seems more applicable to clinical practice because places less restrictions in the diseases grouping, so may be better for identifying clinical associations. Our results suggest that these aspects must be considered in planning of future studies, including selection of diseases and methods of analysis.
Finally, our analysis of multimorbidity patterns only considered associations between diseases. Further studies are needed to analyse the patterns that develop longitudinally as individual patients acquire subsequent comorbidities.
Conclusions
The multimorbidity patterns obtained with EFA show a main factor (ie, a disease) that has some correlation with the additional diseases in the pattern, suggesting a comorbidity relationship. Meanwhile, the HCA would be useful for in-depth study of multimorbidity pattern. We introduced new evidence about the known limitations of attempts to compare multimorbidity or comorbidity patterns between RWD studies, as our results add information about aspects that must be considered in standardisation of future studies: spectrum of diseases, data usage and methods of analysis.
Supplementary file 2
Supplementary file 3
Supplementary file 4
Supplementary file 5
Supplementary file 6
Supplementary file 7
Acknowledgments
We thank the Catalan Health Institute and especially the SIDIAP Unit, which provided the database for the study. The authors also appreciate the English language review by Elaine Lilly, PhD, and are grateful to Carmen Ibáñez for administrative work.
References
Footnotes
Contributors All authors contributed to the design of the study, revised the article and approved the final version. CV-F and QF-B obtained the funding. AR-L and CV-F drafted the article. AR-L, CV-F, QF-B, TR-B, MP-V, EP-R and JMV contributed to the analysis and interpretation of data. AR-L and CV-F wrote the first draft, and all authors (AR-L, CV-F, QF-B, TR-B, MP-V, EP-R and JMV) contributed ideas, interpreted the findings and reviewed rough drafts of the manuscript. All authors read and approved the final manuscript.
Funding The project has been funded by the Instituto de Salud Carlos III of the Ministry of Economy and Competitiveness (Spain) through the Network for Prevention and Health Promotion in Primary Health Care (redIAPP, RD12/0005/0001; RD16/0007/001) and by European Union ERDF funds. Also, by a grant for research projects on health from ISCiii (PI12/00427) and co-financed with European Union ERDF funds). JMV was supported by the National Institute for Health Research Clinician Scientist Award NIHR/CS/010/024.
Disclaimer The views expressed in this publication are those of the author(s) and not necessarily those of the National Health Service, the National Institute for Health Research or the National Department of Health.
Competing interests None declared.
Patient consent Detail has been removed from this case description/these case descriptions to ensure anonymity. The editors and reviewers have seen the detailed information available and are satisfied that the information backs up the case the authors are making.
Ethics approval The study protocol was approved by the Committee on the Ethics of Clinical Research, IDIAP Jordi Gol (Protocol No: P12/28). All data were anonymised and EHR confidentiality was respected in accordance with national and international law.
Provenance and peer review Not commissioned; externally peer reviewed.
Data sharing statement The datasets are not available because researchers have signed an agreement with the Information System for the Development of Research in Primary Care (SIDIAP) concerning confidentiality and security of the dataset that forbids providing data to third parties. This organisation is subject to periodic audits to ensure the validity and quality of the data.