Article Text

Abstract
Background and objectives Intermittent vital signs measurements are the current standard on hospital wards, typically recorded once every 8 hours. Early signs of deterioration may therefore be missed. Recent innovations have resulted in ‘wearable’ sensors, which may capture patient deterioration at an earlier stage. The objective of this study was to determine whether a wireless ‘patch’ sensor is able to reliably measure respiratory and heart rate continuously in high-risk surgical patients. The secondary objective was to explore the potential of the wireless sensor to serve as a safety monitor.
Design In an observational methods comparisons study, patients were measured with both the wireless sensor and bedside routine standard for at least 24 hours.
Setting University teaching hospital, single centre.
Participants Twenty-five postoperative surgical patients admitted to a step-down unit.
Outcome measures Primary outcome measures were limits of agreement and bias of heart rate and respiratory rate. Secondary outcome measures were sensor reliability, defined as time until first occurrence of data loss.
Results 1568 hours of vital signs data were analysed. Bias and 95% limits of agreement for heart rate were −1.1 (−8.8 to 6.5) beats per minute. For respiration rate, bias was −2.3 breaths per minute with wide limits of agreement (−15.8 to 11.2 breaths per minute). Median filtering over a 15 min period improved limits of agreement of both respiration and heart rate. 63% of the measurements were performed without data loss greater than 2 min. Overall data loss was limited (6% of time).
Conclusions The wireless sensor is capable of accurately measuring heart rate, but accuracy for respiratory rate was outside acceptable limits. Remote monitoring has the potential to contribute to early recognition of physiological decline in high-risk patients. Future studies should focus on the ability to detect patient deterioration on low care environments and at home after discharge.
- telemedicine
- vital signs
- wireless technology
- remote monitoring
- continuous monitoring
This is an Open Access article distributed in accordance with the Creative Commons Attribution Non Commercial (CC BY-NC 4.0) license, which permits others to distribute, remix, adapt, build upon this work non-commercially, and license their derivative works on different terms, provided the original work is properly cited and the use is non-commercial. See: http://creativecommons.org/licenses/by-nc/4.0/
Statistics from Altmetric.com
Strengths and limitations of this study
We validated the accuracy of a wireless patch sensor to measure heart and respiratory rate in the intended target population for remote wireless monitoring: postsurgical patients at high risk for complications.
Monitoring was continued for several days.
The reference standard was an ‘intensive care unit-grade’ patient monitoring system.
Although used in clinical practice, the accuracy of the respiratory rate from the reference standard (thoracic impedance pneumography) has known limitations.
The Bland and Altman methods comparison approach is not ideal for time series data; a test for ‘trending ability’ is desirable.
Introduction
While technological advances have resulted in numerous new diagnostic tools and therapeutic innovations, we are still not able to timely recognise patient deterioration on general hospital wards.1 2 This contributes to avoidable cardiopulmonary arrest, unplanned admission to the intensive care unit (ICU), an increase in hospitalisation costs and detrimental effects on quality of life.3–7 To timely detect patient deterioration, we may benefit from technical solutions that can track patients’ vital signs continuously.
Intermittent vital signs measurements, typically once every nurse shift of 8 hours, are the current routine monitoring practice on general hospital wards. As a result, patient deterioration in between measurements can be easily missed. In an attempt to improve the detection of patient deterioration, early warning scoring (EWS) protocols and medical emergency teams have been implemented in most hospitals around the globe. However, failure-to-rescue events continue to occur even with these systems in place.8 9 This phenomenon is also known as failure of the ‘afferent limb’ of the EWS system.10–12 Alongside the attempts to improve detection of patient deterioration on the ward, there is a trend to reduce the duration of hospitalisation by discharging patients home early, for example, in ‘enhanced recovery after surgery’ programmes.13–15 Once a patient is back home, EWS protocols and vital signs monitoring are no longer available. Recovery within the patient’s own home environment has many advantages, but unavoidably some surgical complications will now become first manifest in the home setting. This increases the risk that patient deterioration will be recognised too late.
The majority of adverse events are preceded by a significant period of change in vital signs.16–20 Early recognition of the deteriorating patient might be improved if continuous remote monitoring would become available for at-risk patients in ‘low care’ environments such as the regular hospital ward or in the first few ‘critical’ days at home after hospital discharge.21 22 Recent technological innovations have resulted in lightweight ‘wearable’ wireless sensors capable of recording and transmitting several vital signs such as heart rate (HR), respiration rate (RR), temperature and patient movement. While the majority of the wearable sensors is strictly ‘consumer-grade’, some manufacturers have obtained European Conformity (CE) and/or Food and Drug Administration (FDA) approval for use in clinical environments. However, validity and accuracy of these so called ‘medical-grade’ wearables has not been extensive assessed in real clinical environments. Two studies reported satisfactory agreement between HR, RR of a wearable patch sensor and their respective reference devices. However, these measurements were obtained from healthy participants in controlled conditions. Another study showed reliable HRs and RRs with a wearable patch sensor in the majority of patients, but these data were limited to short periods of measurements in patients with comorbid conditions.23–25 As such, we cannot translate these findings accordingly to patients in a clinical environment at risk for complications.
The objective of this study was to determine whether a wireless adhesive ‘patch’ sensor is able to reliably measure RR and HR continuously in patients after high-risk surgery. We aimed to verify whether wireless sensor technology is robust and capable of detecting physiological trend patterns in high-risk patients before introducing wireless vital signs monitoring into clinical practice. A secondary objective was to explore the potential of the wireless sensor to serve as a safety monitor in clinical practice.
Materials and methods
Study design and setting
We performed a methods comparisons study with an observational design in which patients were continuously monitored after high-risk surgery during the initial days of recovery at the surgical step-down unit (SDU) of the University Medical Center Utrecht, the Netherlands, a large academic hospital. Formal approval for this study was obtained from the local ethical committee (no: 15/550).
Study participants
Postoperative patients were asked to participate on admission to the SDU if their expected stay was at least 24 hours. These patients were considered for enrolment because they represent a high-risk subset of surgical patients that is more prone to experience deterioration compared with patients on the general ward. Exclusion criteria were patients with an implantable cardiac device, an allergy to adhesives, wound or skin lesion near the application site or inability to give informed consent. After written informed consent was obtained, researchers applied the sensor to the patient’s chest to start recording vital signs for 1–3 days using the wearable sensor and the routine monitoring system described hereafter.
Description of the wireless wearable sensor
The HealthPatch MD (VitalConnect, San Jose, California, USA) is a medical-grade lightweight, wireless and wearable adhesive biosensor that measures a number of vital signs continuously: single-lead ECG, HR, HR variability, RR, skin temperature, body posture and step count. It was designed to facilitate long-term remote monitoring of vital signs and activity metrics within the hospital environment as well as in the postdischarge period at home. The sensor consists of a disposable adhesive patch that houses two ECG electrodes, a thermistor and a zinc–air coin-cell battery. The reusable sensor module contains a triaxial accelerometer and Bluetooth Low-Energy (BLE) transceiver (see online supplementary appendix 1). The patch can be applied on the patient’s chest and measures vital signs continuously up to 3 days (4 days if continuous transmission of its single-lead ECG waveform is disabled). The module processes the incoming signals and transmits the data via BLE to a relay device (for this study we used an iPad mini (Apple, Cupertino, California, USA) with the ‘Healthwatch’ mobile application. This application can display vital signs data in real time for research purposes, but was not designed to be used as clinical monitoring system. Also, near real-time data can be viewed on the Healthwatch web cloud-based server, to monitor long-term trends. Quality of the sensor data was verified several times by the researchers during data collection. Patient identification information was not entered on the mobile device to ensure privacy protection.
Supplementary appendix 1
Although the wireless sensor can also measure position, in this study we only focused on assessing the accuracy and reliability of RR and HR monitoring. The sensor calculates HR using analysis of the single-lead ECG. The algorithm is based on automated detection of QRS complexes from the ECG waveforms. RR is derived from the combined information from three sources: an embedded algorithm uses a weighted average of two characteristics of the ECG signal: (1) QRS amplitude modulation and (2) respiratory sinus arrhythmia ; both ECG-derived signals change during inspiration and expiration,26 and the algorithm uses (3) accelerometer data produced by chest movement during respiration.27 Both HR and RR are updated every 4 s and the manufacturer states an accuracy of ±3 breaths per minute (breaths/min), in the range of 4 to 42 breaths for RR. The stated accuracy of HR is ±5 beats per minute (beats/min or 10% (whichever is greater), in the range of 30–200 beats/min.
Description of the bedside routine standard
HR and RR of patients were continuously monitored with the wearable sensor and simultaneously with a multiparameter bedside monitoring system designed for use in ICUs and operating rooms (XPREZZON, Spacelabs Healthcare, Snoqualmie, Washington DC, USA) which served as the reference monitor. This reference uses ECG for HR detection and measures RR by thoracic impedance pneumography.
Signal analysis
The raw data transmitted by the sensor containing the measurements and their associated time stamps were retrieved in CSV format. Data were stored and processed using Matlab (The MathWorks, Natick, Massachusetts, USA). Empty or invalid data (not-a-number) were removed to obtain continuous 2D vectors of vital sign samples with their corresponding time stamps. Data reports were automatically retrieved from the reference monitor. These contained vital signs data sampled once per minute (ie, one measurement was saved and transmitted every minute). The sensor data, originally transmitted once every 4 s was therefore resampled to once per minute (ie, one sample per minute of the sensor was retained corresponding to the nearest time point of the reference monitor) to produce paired data points with the reference monitor. Furthermore, sensor data and reference data were synchronised to ensure alignment of their respective time stamps. No artefact removal was applied to the data before analysis.
Besides the analysis on vital signs data transmitted every minute, a median filter over a 15 min period was applied to study the effect on HR and RR outliers and to further explore the potential of the wireless sensor in clinical practice. This filtering was calculated as a median over subsequent epochs of 15 min.
Outcomes
The primary outcome was bias and precision (95% limits of agreement (LoA)) of HR and RR of the wireless sensor compared with the bedside monitor. This reference standard reports an accuracy for HR of ±1% or 3 beats/min (whichever is greater) and an accuracy of ±5% or 1 breaths/min (whichever is greater) for RR.28 We considered HR and RR to be acceptable for clinical purposes if within ±10% of the reference monitor or ±3 breaths/min or ±5 beats/min.29 A secondary endpoint was the reliability of detecting true critical clinical conditions such as bradycardia (HR <50 beats/min), tachycardia (HR >100 beats/min), bradypnoea (RR <12 breaths/min) and tachypnoea (RR >20 breaths/min).30 Another secondary outcome was the reliability defined as time until the first occurrence of data loss (defined as a duration of a gap within the data of 2 min, 15 min, 1 hour or 4 hours) and the overall amount of data loss from various causes.
Statistical analysis
The series of observation pairs of HR and RR measurements (one data point every minute) derived from the wireless sensor and the reference monitor were compared using the Bland and Altman Method for repeated measurements.31 This method was used to account for within-subject variation by correcting for the variance of differences between the average differences across patients and the number of measurements per patient. The mean difference (bias) between the wireless sensor and reference monitor and the 95% LoA (±1.96 SD) was determined for both the HR and RR data. In addition, a Clarke error grid analysis was conducted to specify the clinical accuracy and the consequences for clinical decision-making.32 The time (hours) to first occurrence of data loss was analysed with Kaplan-Meier survival plots.
A power calculation was not feasible due to the lack of preliminary data with these continuous monitoring systems. Therefore, we aimed to analyse data of at least 25 patients—each with multiple hours of continuous data—which is sufficient to evaluate the validity of the wireless patch sensor.
Results
From September 2015 to September 2016, a total of 33 postoperative patients entered the study. Data from the reference monitor were missing for eight patients due to technical issues with retrieving the data from the monitor’s on-board memory, resulting in a total of 1568 hours of monitoring time with the reference monitor and 1702 hours of vital signs monitoring from the wireless sensor. Therefore, measurement pairs of 25 patients were available for agreement analysis. On average, 62 hours remained per patient for further analysis. The range of total monitoring time per patient varied from 12 to 124 hours. Table 1 summarises patient characteristics and surgical procedures.
Patient characteristics (N=25)
Example of a patient measurement
Figure 1 shows the HR and RR trend during the first four postoperative days of a 60-year-old male patient with extensive cardiac and vascular comorbidities, after an open nephrectomy procedure for a suspected carcinoma in situ. Three events can be recognised: (1) a sudden HR increase on Thursday evening; later diagnosed as atrial fibrillation, (2) an episode of bradycardia on Saturday afternoon and (3) mild tachycardia and a subtle increase in RR starting Sunday afternoon, caused by bleeding from an aortic branch artery. After coil embolisation, the patient was readmitted to the ICU. This example illustrates agreement between HR and RR measurements recorded with the wireless sensor and the reference standard. Note that RR derived from the reference monitor was highly variable compared with RR from the wireless sensor (figure 1).

Example of a patient that is being measured for 4 days continuously with the wireless sensor (red) and reference standard (blue). The upper panel shows heart rate in beats per minute, the lower shows respiratory rate in breaths per minute.
Heart rate
Table 2 shows bias and precision (95% LoA) from comparisons between the wireless sensor and the reference standard. For analysis, 55 565 min (926 hours) of HR measurement pairs were available. The mean difference (bias) in HR was −1.1 beats/min (reference standard minus sensor) with a 95% LoA of −8.8 to 6.5 beats/min. Applying a 15 min median filter resulted in a narrower 95% LoA of −5.7 beats/min to 3.2 beats/min (3986 min available for analysis). Bland and Altman plots for the complete and filtered HR datasets are shown in figure 2A and B, respectively.
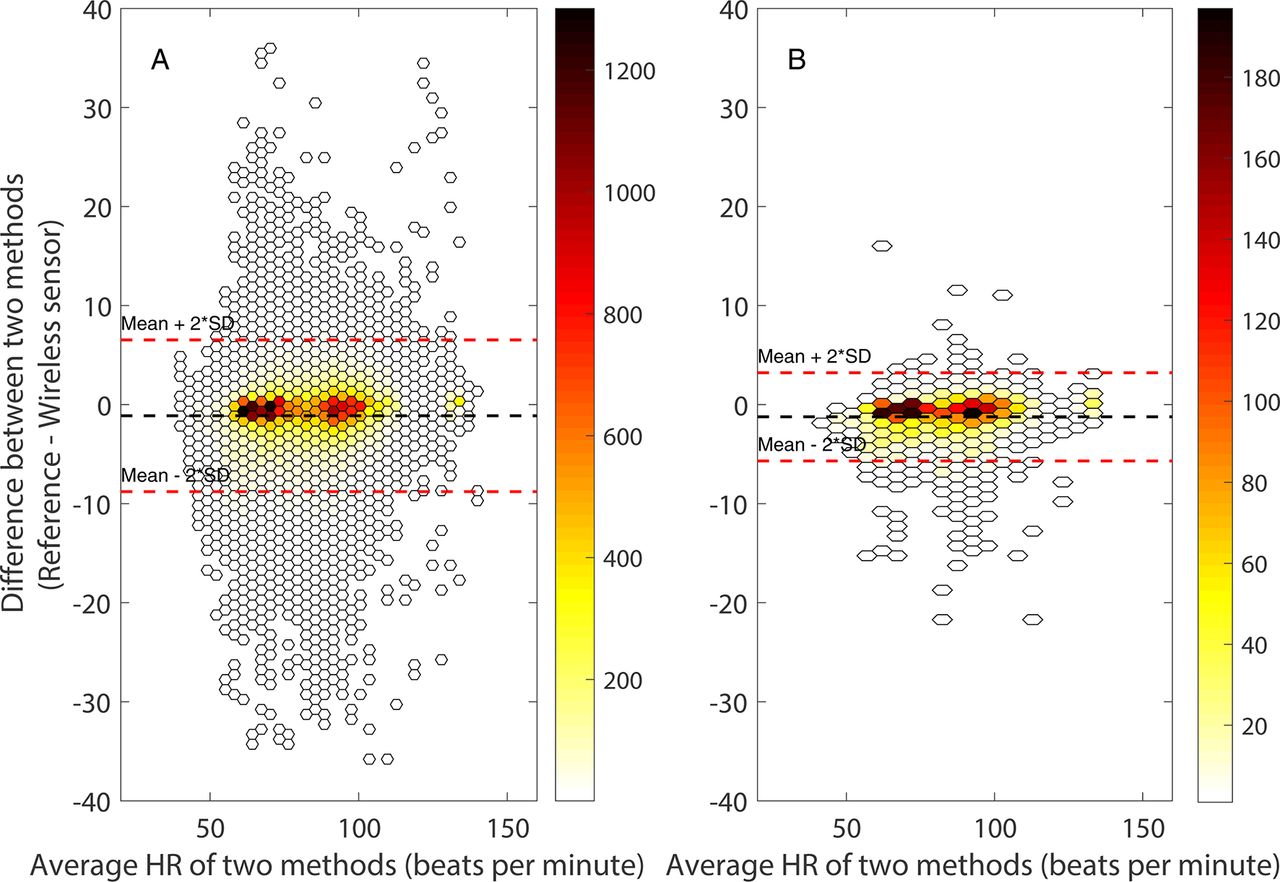
Bland and Altman plots for complete (A) and filtered (A) datasets for heart rate (HR) during admission at the surgical step-down unit with few (white) to many (dark red) measurement pairs.
Bland and Altman analysis of wireless heart rate (HR) and respiratory rate (RR) versus reference monitor in postoperative patients
Respiratory rate
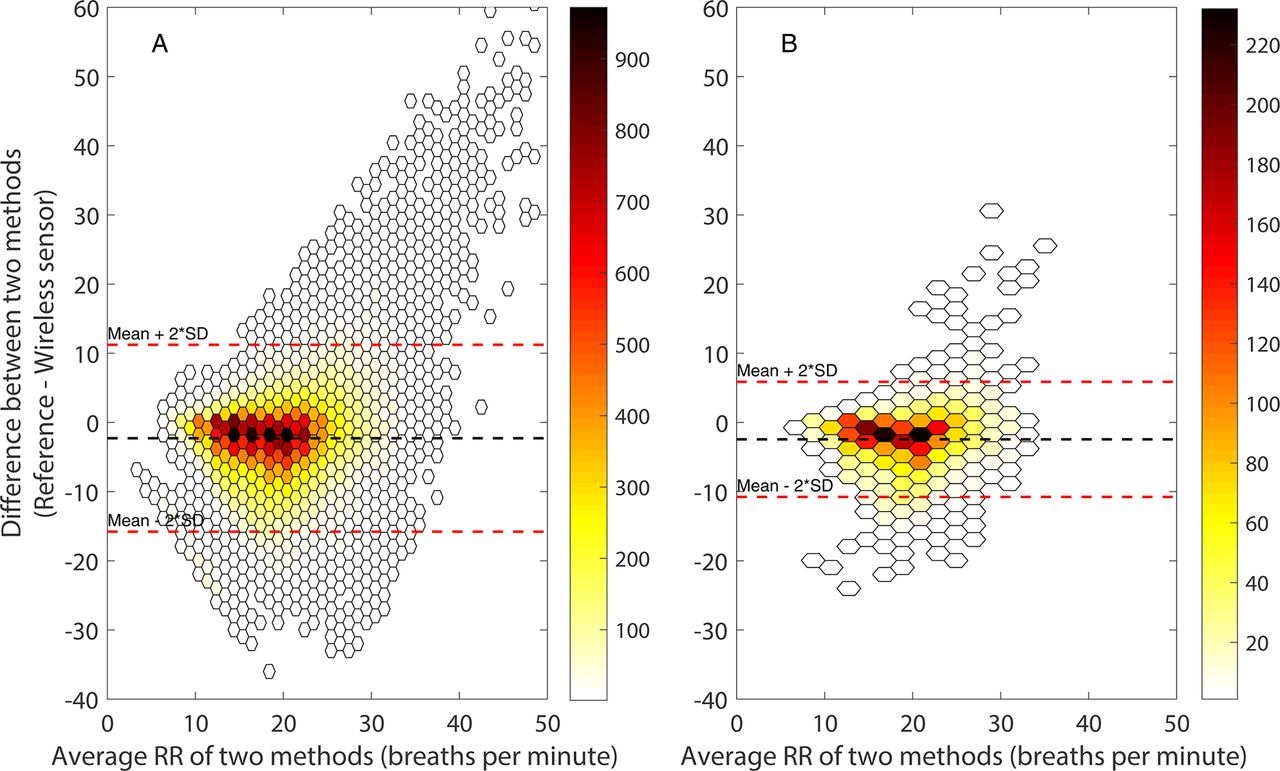
The mean difference between the reference monitor and the wireless sensor was −2.3 breaths/min with wide levels of agreement (95% LoA: −15.8 to 11.2 breaths/min). The agreement between both methods improved after applying a 15 min median filter, resulting in a 95% LoA of −10.8 to 5.9 breaths/min. Bland and Altman plots for the complete and filtered RR dataset are displayed in figure 3A, B. Most ‘high RR’ outliers originated from the reference monitor and were observed in the higher RR range. This is also shown in figure 1 where RR measurements derived from the reference monitor showed a higher variation compared with RR derived from the wireless sensor. This high variation reduced after applying a median filter over 15 min.

Bland and Altman plots for complete (A) and filtered (B) datasets for respiratory rate (RR) during admission at the surgical step-down unit with few (white) to many (dark red) measurement pairs.
Diagnostic accuracy of the wireless sensor
Because of the relatively long monitoring time per patient and the high-risk population, we were able to capture several instances of bradycardia, tachycardia, bradypnoea and tachypnoea. The incidence of bradycardia was rare, a HR below 50 was present in only 2% of all HR measurements in the complete dataset. Tachycardia, bradypnoea and tachypnoea occurred more frequently in 14%, 15% and 34% of cases, respectively. Sensitivity, specificity, positive predictive value and negative predictive value are shown in table 3. After applying median filtering, sensitivity and specificity of all episodes with abnormal HR and RR improved.
Diagnostic accuracy for bradypnoea, tachypnoea, bradycardia, tachycardia
The Clarke error grid analyses of the filtered datasets are shown in figure 4A, B; it shows that 100% of the HR measurements and 99% of RR measurements are within region A or B, respectively, within 20% of the reference measurement, or outside 20% of the reference but not leading to unnecessary treatment. None of the HR measurements were in region, B, C or E, which means that none of the measurements would lead to failure to treat, unnecessary treatment or confusion between bradycardia and tachycardia. Very few of the RR measurements (≤1%) were within region C, D or E, indicating a potentially dangerous failure to apply the right treatment.

Clark error grid analysis to quantify clinical accuracy of the heart rate (A) and respiration rate (B) measurements with the HealthPatch MD as compared with the reference monitor of the filtered dataset. Region (A) are points within 20% of the reference monitor, region (B) contains points outside 20% of the reference, but not leading to unnecessary treatment, region (C) are points leading to unnecessary treatment, region (D) indicates a potentially dangerous failure to detect bradycardia or tachycardia (A) or bradypnoea or tachypnoea (B), region (E) represents points where events are confused (eg, bradycardia with bradypnoea).
Technical performance
HR and RR data were recorded for the majority of the time (94%), from 36 sensors in 33 patients (table 4). Nineteen (53%) wireless patient monitoring series had complete uninterrupted data, but in 17 patients there was data loss (ranging from 8 s data loss to 60 hours). Most found sensor failure to be caused by a sawtooth pattern of the battery level from inadvertent covering of the air opening for the zinc–air battery resulting in measurement gaps.
Amount of data loss within all wireless sensor measurements
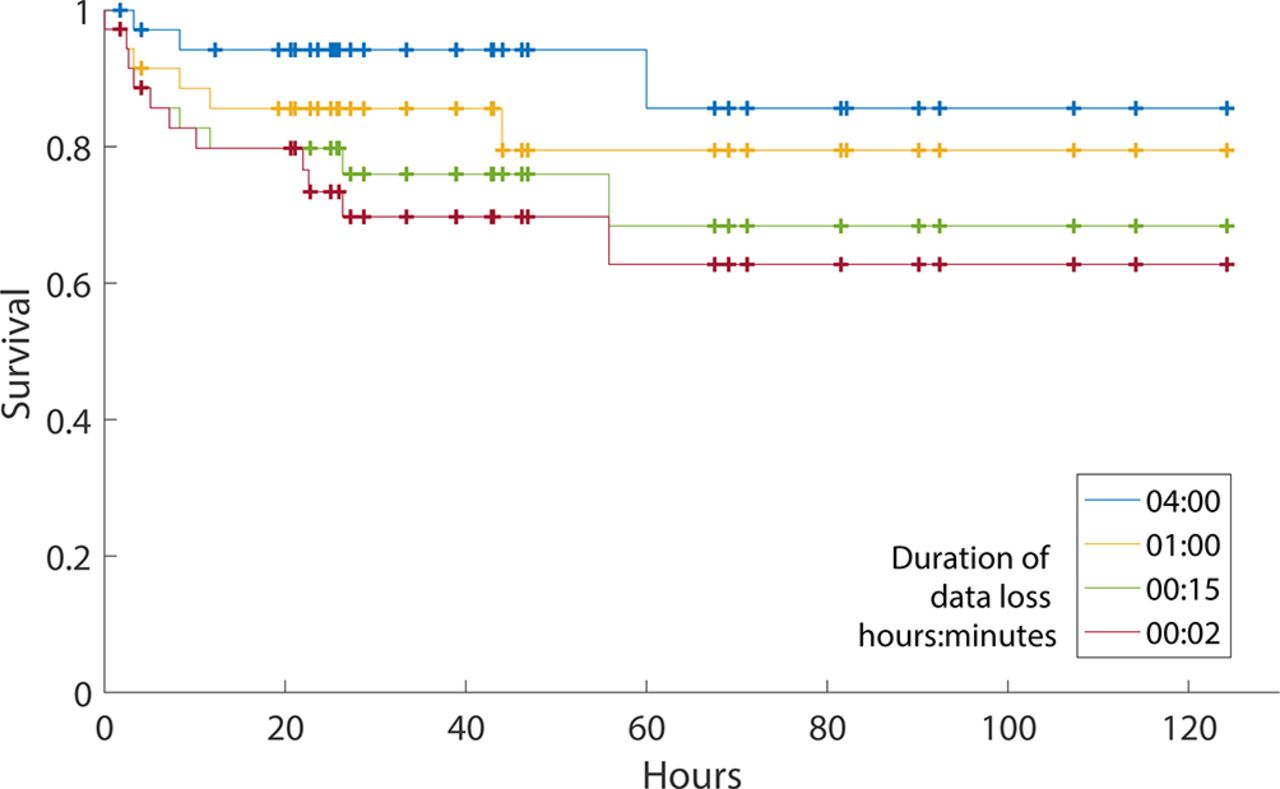
Figure 5 shows the survival analysis for ‘time to first failure’ in data transmission of the sensor. Using a threshold (maximum duration of a gap in the data) of 2 min, this analysis showed that 63% of the wireless sensor measurements in patients were performed without data loss greater than 2 min. A gap duration of 1 hour resulted in 79% of sensor measurements without data loss greater than an hour.

Survival analysis of 36 wireless sensor measurements in 33 patients versus time with various threshold times (maximum duration of a gap in the data). Data loss longer than the threshold counts as failure. The vertical marks indicate the end of a measurement other than failure (ie, when the patient is being discharged to the ward and data transmission stopped).
Discussion
We studied the performance of a wearable wireless sensor to measure HR and RR continuously in high-risk postoperative patients. The results show that this sensor (HealthPatch MD) can accurately measure HR with a deviation within 10% of the reference standard. In contrast, the accuracy for RR was outside the limit range we considered acceptable. However, this finding may be due to frequent outliers and clinically implausible variability of RR values provided by the reference monitor. Median filtering of both signals over a 15 min period resulted in a reduction of the number of RR measurement pairs outside the acceptable LoA and an improvement of LoA. Overall, data loss was limited with HR and RR measurements 94% of the time available.
Strengths
To the best of our knowledge, this is the first clinical study that investigated the reliability and accuracy of continuous vital signs monitoring using a wearable wireless patch sensor for several days in postoperative surgical patients at a SDU. Most studies were actually obtained under controlled laboratory conditions.25 27 33 These studies demonstrated the ability of the HealthPatch sensor to accurately measure HR and RR in adult participants. Hernandez-Silveira et al 24 reported a higher accuracy for HR and RR measurements with the SensiumVitals digital patch in stable patients with comorbid conditions for a limited time period (2 hour) compared with our study. Other studies used intermittent nurse observations on the ward as the only reference. Weenk et al 34 reported that both HR and RR of the HealthPatch were in agreement with nurse measurements, although wide LoA were found. Another study compared RR measurements of nurses with readings from the SensiumVitals digital patch and found inadequate agreement.35 Although these studies showed the feasibility of wireless technology in clinical practice, comparison with nurse readings cannot validate the continuous performance of the wireless devices. Moreover, these wireless monitoring devices are not intended to deliver ‘spot’ readings for EWS, that is, their use was evaluated for a purpose outside the intended scope of use. Consequently, a drawback of these study designs was the inability to validate continuous HR and RR measurements of new remote monitoring devices in between nurse observations. In the current study reference, HR and RR were measured continuously in a clinical setting.
Limitations
The results of the present study confirm the difficulty of accurate continuous RR monitoring. However, we should also consider the limitations of the reference standard36 37; accuracy of thoracic impedance RR measurements can be influenced by many factors independent of breathing, such as patient movement, talking and coughing. Impedance artefacts could explain the high number of false negatives (ie, missed bradypnoea), resulting in low sensitivity. Impedance technique is the current bedside routine standard for continuous measurement of HR and RR in most hospitals today and therefore clinically relevant. However, it cannot be considered a gold standard for RR measurement. While capnography is widely regarded as a ‘true’ gold standard for RR, it has several drawbacks for continuous unsupervised respiratory monitoring in spontaneously breathing patients, since its nasal cannula can be easily dislodged, leading to incomplete data and a high number of false-positive ‘apnoea’ alarms.38 Furthermore, the HealthPatch sensor was not designed to indicate RRs <5 breaths/min. Nonetheless, a progressive slowing of breathing rate may still be identified and used as indicator of vital instability, for example, to recognise life-threatening opioid-induced respiratory depression.
Filtering
Applying a median filter over 15 min data epochs improved reliability of HR and RR by removing outliers, for example, a transient very high RR caused by a movement artefact. This is appropriate since these transient artefacts (ie, RR >45 breaths/min) are extremely unlikely from a physiological perspective. Although filtering effectively eliminates such artefacts, this comes at the expense of reducing the number of available measurements and the reduced ability to detect sudden changes in vital signs (eg, cardiac arrest). An alternative might be to use a ‘moving’ median filter to keep the update rate at once every minute or once every 2 min. On the other hand, improved eliminaton of outliers could result in a higher proportion of epochs with reliable HR and RR resulting in lower false-positive alarms. The latter is extremely important if this remote monitoring system is to be clinically deployed on the ward or at home. Furthermore, continuous remote monitoring on the ward with a reduced frequency (ie, once every 15 min) still provides much more information regarding the patient’s vital signs than the current intermittent monitoring practice, where vital signs are usually only observed once every 8-hour nurse shift.
In case an alarm is generated by the remote monitoring system, a nurse can personally check on the patient and correct if the cause of the alarm was not related to a change in the patient’s medical condition. However, it must be realised that a large number of false alarms is very disruptive on the general ward, especially when there is a low nurse to patient ratio (eg, at night). This may even decrease patient safety by taking away valuable nursing time from patients who are in real need of attention. We suggest that eliminating outliers to improve reliability and eliminate false-positive alerts far outweighs the limited benefits of having ‘continuous’ vital signs data streams.
‘Methods comparison’ methodology and continuous monitoring
The goal of this study was to determine whether the wireless sensor is able to reliably measure RR and HR over time in postoperative patients. Although Bland and Altman analyses can reliably indicate bias and precision of ‘spot measurements’, it does not inform about the ‘trending ability’ of the monitoring system over time, while this is of ultimate importance to timely recognise abnormal vital sign patterns. This was also confirmed in the study of Churpek et al 21 that showed the added value of using trends of vital signs for detecting clinical deterioration on the wards. In our study, the example case in figure 1 clearly demonstrates the ability of the wireless sensor to detect important physiological changes of a deteriorating patient over time, even while the LoA for detecting bradypnoea as determined by Bland and Altman analyses were deemed not acceptable. Therefore, we wish to emphasise that accurate trend measurements (eg, the ability to detect deterioration over time) is more important than just one accurate single measurement at one specific point in time.
Continuous monitoring on the general ward is still unknown territory. Future studies should therefore focus on the performance of wireless monitoring in patients at the general ward, including validation during periods of mobilisation. Particular emphasis should be on the early detection of critical adverse events. However, the usability and patient perspective on remote monitoring are important to determine when creating the infrastructure of a complete remote monitoring solution.
Conclusion
Wireless continuous monitoring may have the potential to contribute to early recognition of physiological decline in high-risk patients. The tested wireless sensor was able to accurately record HR, but the accuracy of respiratory rate needs further optimisation to reduce the incidence of false alarms and allow timely recognition of altered breathing patterns.
References
Footnotes
Contributors MJMB, CJK, DAJD and TJB were involved in the clinicial trial design and ethics submission. EH was involved in the planning and conduct of the study and drafting of the results. MJMB assisted in the conduct of the study, performed analysis of clinical data and drafted the paper. Throughout the study, LPHL, KvL, CJK and TJB assisted in the conduct of the study. All authors reviewed and approved the final version of the manuscript.
Funding This research was funded solely from institutional funds.
Competing interests At the time of the study, MJMB was part-time employee of FocusCura (Health IT company, Driebergen-Zeist, The Netherlands) and DAJD is founder and CEO of FocusCura. No funding from FocusCura was obtained. To ensure independent analysis, the wearable sensor (HealthPatch MD) was purchased from VitalConnect, the manufacturer of the HealthPatch MD. VitalConnect neither had insight nor influence on the analysis of the data or drafting of the manuscript.
Patient consent Not required.
Ethics approval This study was approved by the Institutional Review Board of the University Medical Center Utrecht.
Provenance and peer review Not commissioned; externally peer reviewed.
Data sharing statement Authors are planning on producing further publications using this dataset. Afterwards, anonymised patient recordings will be available from the corresponding author on request.