Article Text

Abstract
Objectives We aimed to compile and normalise England’s national prescribing data for 1998–2016 to facilitate research on long-term time trends and create an open-data exploration tool for wider use.
Design We compiled data from each individual year’s national statistical publications and normalised them by mapping each drug to its current classification within the national formulary where possible. We created a freely accessible, interactive web tool to allow anyone to interact with the processed data.
Setting and participants We downloaded all available annual prescription cost analysis datasets, which include cost and quantity for all prescription items dispensed in the community in England. Medical devices and appliances were excluded.
Primary and secondary outcome measures We measured the extent of normalisation of data and aimed to produce a functioning accessible analysis tool.
Results All data were imported successfully. 87.5% of drugs were matched exactly on name to the current formulary and a further 6.5% to similar drug names. All drugs in core clinical chapters were reconciled to their current location in the data schema, with only 1.26% of drugs not assigned a current chemical code. We created an openly accessible interactive tool to facilitate wider use of these data.
Conclusions Publicly available data can be made accessible through interactive online tools to help researchers and policy-makers explore time trends in prescribing.
- prescribing
- national health service (nhs)
- primary care
This is an Open Access article distributed in accordance with the Creative Commons Attribution Non Commercial (CC BY-NC 4.0) license, which permits others to distribute, remix, adapt, build upon this work non-commercially, and license their derivative works on different terms, provided the original work is properly cited and the use is non-commercial. See: http://creativecommons.org/licenses/by-nc/4.0/
Statistics from Altmetric.com
Strengths and limitations of this study
We processed publicly available annual data for the whole of England’s community dispensing—not a sample.
We corrected for population size, inflation and (where possible) drugs changing name and/or classification over time.
We produced a free, openly accessible tool for wider use, displaying trends in items, cost, price per item and quantity per item for each product for 1998–2016, which can be updated annually.
The tool is limited to product-level data, not individual presentations, and wide-scale correction for dosage was not possible.
Users can also download our normalised dataset to carry out their own analyses.
Introduction
In 2016, National Health Service (NHS) prescribing in England cost £9.20 billion,1 approximately 9% of the annual NHS budget.2 Prescribing behaviour is expected to respond within the dynamic system of evidence-based medicine through changing patterns of disease, innovation in medical treatments and new evidence. Monitoring long-term time trends in prescribing is therefore useful to observe changes in practice, to provide a form of feedback to ensure there are no unexpected or undesirable changes and to facilitate tracking and forecasting of costs.
NHS Digital publish monthly and annual prescribing datasets from the NHS Business Services Authority , along with static reports on prescribing trends. However, this does not allow readers to interrogate topics of interest in detail, and the large datasets can be complex to manage. We provide a service at OpenPrescribing.net that facilitates exploration of outliers and trends for individual general practices in NHS England, which has provided over 250 000 analyses to 50 000 users over the past year. The detailed dataset that drives this service (running to over 10 m rows a month) is only available from 2010 onwards. The annual prescription cost analysis (PCA) data, aggregated nationally (with no data on individual practice) and by year (with no data on prescribing changes each month) are available back to 1998. These data are freely accessible but consist of individual files for each year of prescribing, which cannot be straightforwardly combined and therefore do not facilitate interrogation of time trends. Additionally, identifiers for individual drugs may change name, or location within the British National Formulary (BNF), over time, making simple compilation of the data impossible.
The value of PCA data is indicated by the numerous previous studies using it to assess prescribing trends3–5 or to detect changes in response to guidelines or safety alerts.6–8 These studies have been focused on data for a small number of drugs, manually aggregated for each bespoke analysis; furthermore, given publishing delays for academic manuscripts, the data are commonly very delayed, and readers cannot easily place the findings in context of current clinical practice or expenditure.
We therefore set out to aggregate all available PCA data into a single data frame for longitudinal analysis of trends, in a service that could be easily updated; to generate an interactive online service where any user can explore and monitor time trends in prescribing using the latest available data and to share all resources for reuse by others as open data.
Methods
Data sources
Every available PCA annual dataset was downloaded from NHS Digital or National Archives, covering calendar years 1998 to 2016.9
Data structure
Each annual PCA dataset includes all items dispensed in England by pharmacy/appliance contractors, dispensing doctors and items personally administered by doctors, whether or not they were prescribed in England or other parts of the UK. Items dispensed in other settings (prisons, hospitals and private prescriptions) are excluded. Prior to 2010, the data were rounded to the nearest 100 and excluded drugs with fewer than 50 items prescribed, accounting for 0.01% of total items.10 Definitions of key terms used in the PCA data (and NHS primary care prescribing data more generally) are given in box 1, and a full glossary of terms is available.11
Glossary of prescribing data terminology
| Example presentation: Tradorec XL tablets 300 mg | ||||||
| Drug name | BNF chemical name | BNF Section name | BNF Subparagraph name | Items | Quantity | NIC |
| Tradorec XL_Tab 300mg | Tramadol Hydrochloride | Analgesics | Opioid Analgesics | 6374 | 324 167 | £152 358 |
The drug name describes the full presentation of the drug, that is, the formulation and strength as well as the drug’s brand or generic (product) name.
The chemical name is the standard registered name for the active constituent of the medicine. It is not always an individual chemical: examples include ‘paracetamol combined preparations’ and ‘paracetamol and caffeine’.
Numerical codes representing Chapter, Section, Paragraph and Subparagraph are also supplied. These represent only the first seven characters of each drug’s unique 15-character British National Formulary (BNF) code (see box 2).
Items are functionally equivalent to prescriptions; they do not take into account the quantity (number of boxes/bottles, etc) dispensed to the same person. Items may vary in the quantity prescribed.
Quantity represents the quantity of a drug dispensed, with units of measurement (units/tablets/grams/millilitres, etc) dependent on its formulation.
Net ingredient cost (NIC) represents the basic price of the medicine, that is, the drug tariff price, or, if not listed, the price published by the manufacturer or supplier. NIC may be subject to further charges and/or discounts. Patients who are eligible contribute a fixed fee towards each prescription charge, but this only applies to a minority of items and it is not possible to identify which items in this dataset.
Every drug presentation (ie, each formulation, dose and product combination) is described by a unique drug name and has a unique 15-digit structured British National Formulary (BNF) code, an example of which is given in box 2. The BNF contains an entry for every product available to be prescribed in Britain, including medicinal products, dietary supplements, complementary therapies and physical appliances such as bandages. The hierarchical BNF codes imply a data schema as follows: each presentation of a drug has a product name, which may be either a brand name or the generic chemical name; as such, each product can be mapped to a chemical. Each chemical is a member of a Paragraph in the BNF (some of which are divided into Subparagraphs, which themselves often approximate to a class of drugs). Each Paragraph belongs to a Section, which is in turn a member of a Chapter (often approximating to a system of the body, such as ‘cardiovascular’).
British National Formulary code structure.
| Example presentation: Tradorec XL tablets 300 mg | |||||||
| Chapter | Section | Paragraph | Subparagraph | Chemical | Product | Presentation | Generic equivalent |
| 04 | 07 | 02 | 0 | 40 | BI | AC | AM |
| Central Nervous System | Analgesics | Opioid Analgesics | Opioid Analgesics | Tramadol Hydrochloride | Tradorec | Tradorec XL_Tab 300mg | * |
*Generic equivalent allows matching with the strength and formulation (presentation) of the generic product (which will always have product code ‘AA’).
For generic presentations, the product name will match the chemical name (but sometimes with a different abbreviation, for example, ‘Tramadol HCl’).
In the PCA data, only the first seven characters of the BNF code for each drug are supplied rather than the full BNF code. Therefore, the ‘drug name’ is the only source of information on the formulation and dose; however, from this, the BNF code can usually be imputed, but this becomes increasingly difficult for older drugs no longer listed in the BNF. Although each drug’s chemical name is also supplied, chemicals are not all unique (eg, ‘other preparations’); names may change their spelling over time; and chemicals may move between Paragraphs, Sections and Chapters. Indeed, classifications at any level of the hierarchy can be subject to renaming, spelling change, subdivision, reorganisation and removal.
Data management, aggregation and cleaning
All data were grouped by drug name, combining any available in multiple formulations (despite having identical names). Ultimately, following cleaning, data were grouped to product level. Medical devices/appliances and any other items, Chapter numbers above 15 were excluded.
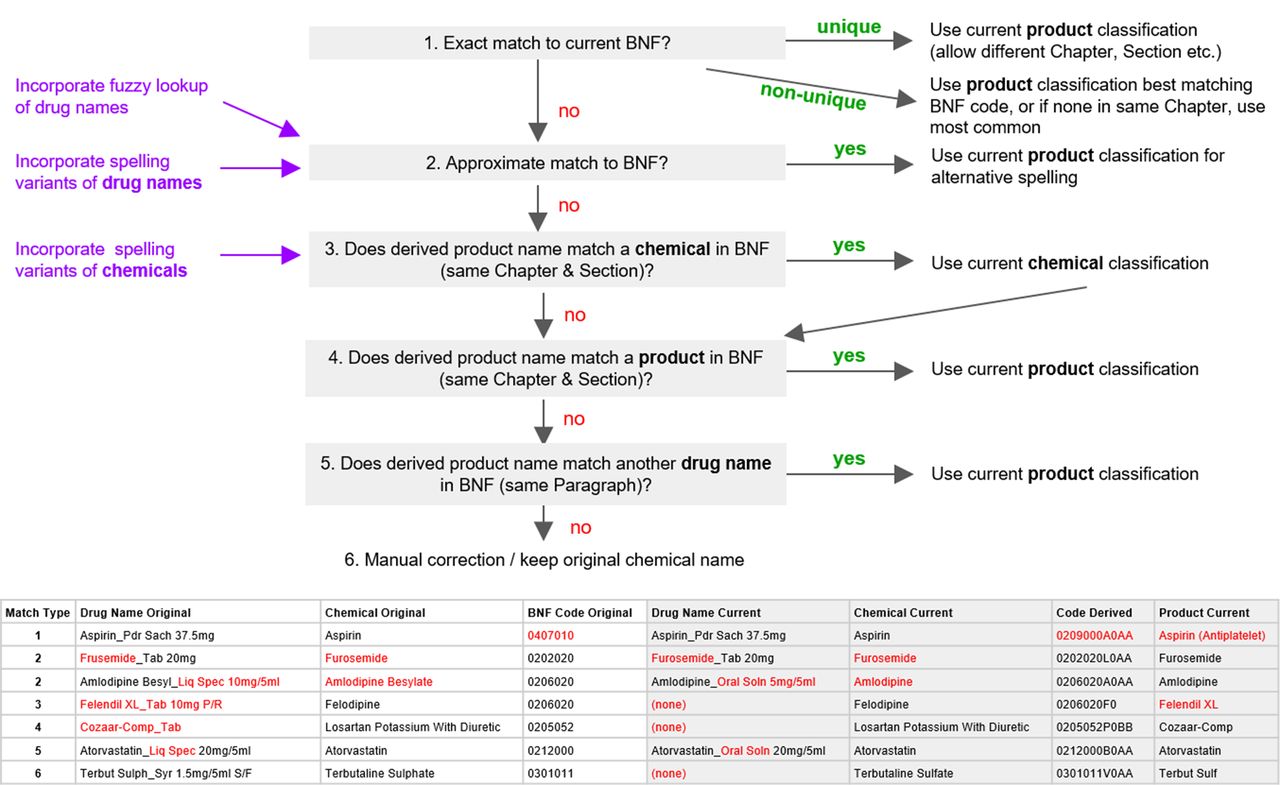
A key user need was to explore prescribing trends for individual members of a class of drugs over time. This required all data to be normalised, with each individual drug consistently appearing in the correct location in the data schema; that is, all individual presentations of a chemical all mapped under that chemical and all chemicals mapped under the correct Subparagraph/Paragraph (often similar to drug class) of the BNF. To achieve this consistency, we aimed to map each drug to its current position in the latest BNF dictionary up to the level of its 11-character ‘product’ code through an incremental process. This is summarised below and in figure 1.

BNF code normalisation process flow chart describing how drug names were matched to the current BNF. Examples of matches at each numerated stage are given in table (bottom), with code/name changes in red. The first example demonstrates a drug which was matched to the current BNF through an exact match by name but had moved from Chapter 4 to Chapter 2. For other types of matching, care was taken to avoid mistakenly matching to similar (but distinctly different) drugs across chapters/sections. BNF, British National Formulary.
Lacking the full BNF code, we attempted to match each drug name to a current BNF presentation. Those without an exact match (eg, formulation variants no longer available) could sometimes be matched to a similar BNF presentation name, for example, by finding a similar formulation or using the ‘fuzzy’ lookup add-on for Excel and validated manually.12 Other drug names could only be matched up to current BNF codes by using their product or chemical names. Matching at each stage was improved by disregarding capitalisation or spacing and spelling changes (eg, Sulphur/Sulfur); these include changes identified within the data and those occurring when many old British spellings (the ‘British Approved Name’) were replaced with international standard names (the ‘Recommended International Non-Proprietary Name’).13 Remaining drug names in the most-prescribed Chapters (1–6 and 10) were matched to current drug names manually (eg, resolving non-matches due to rearrangement of word order); any others kept their original chemical name and a proxy product name was derived from the drug name field. Full methodology for this matching process is available in our technical documentation online14 and in online supplementary material.
Supplementary file 1
We measured the extent of normalisation of drug names and classifications and present summary statistics on these.
Normalisation for inflation and population
Prescribing costs were corrected for inflation using the UK’s annual consumer price index figures normalised to 2016.15 Number of items prescribed and costs were divided by the population each year to calculate values per thousand population based on midyear population estimates for England only.16 We also supply the original number of items and cost in our output.
Interactive analysis tool
Having generated a normalised dataset and a method for updating it, we then set out to implement a free, interactive online data analysis tool where any user can visually explore time trends in prescribing. This was built using Tableau Public, a freely accessible interactive data presentation platform which permits rapid prototyping; however, other front ends onto the same underlying datasets could also be implemented using open-source tools such as Shiny17 or in Python libraries such as d318 with more software engineer resource. Our user needs for the tool were as follows: the ability to display trends in items and cost, normalised for total population change and inflation and also to calculate the average cost per item and quantity per item for each product.
Having delivered the tool, we used it to generate trends data and graphs for a range of clinical areas where prescribing trends have been previously studied and published to demonstrate the ability of our tool to replicate and extend these works.
Data and code
The full compiled and processed PCA datasets are available online via FigShare,19 SQL code is in online supplementary appendix, and the Trends tool (Tableau workbook) is available to use via https://OpenPrescribing.net/pca.
Results
Data compilation and overall prescribing trends
All data were successfully imported. There were 169 100 lines of data in the compiled 1998–2016 dataset (Chapters 1–15) and 169 038 in the processed data, the reduction caused by aggregation of a small number of drugs available in multiple formulations despite having identical names. Total items (14.8 billion), cost (£136.9 billion) and distinct drug names (22 496) remained consistent before and after data processing (table 1, see online supplementary table S1). The inclusion of low volume prescribing in the published datasets from 2010 caused a substantial rise in the number of distinct drugs per year but not items or cost (table 1). As can be seen from table 1, the inflation-corrected cost in 2016 UK sterling equivalent for all prescribing in NHS England primary care rose from £6.3 billion in 1998 to £10.1 billion in 2004 but then decreased to £8.3 billion in 2016. Items per 1000 population (correcting for crude population growth) has grown from 10 180 in 1998 to 19 196 in 2016, on average increasing by 3.6% per year. The discrepancy between items and cost is caused by variation in the choice of drugs being prescribed and their individual prices, for example, switching from branded drugs to cheaper generic versions after patent expiry.
Summary of processed PCA data by year (drugs in Chapters 1–15 only)
Data normalisation
Data were normalised using the methods described above. Of the distinct drug names in the data, 87.5% were matched exactly to a current BNF name, and a further 6.5% matched approximately (table 2). Name changes are particularly prevalent in Chapter 3 (Respiratory) due mainly to the addition in 2004 of a space when a number of doses is given, as is common for inhalers, for example, ‘Salbutamol_Inha 100 mcg (200D)’ became ‘Salbutamol_Inha 100 mcg (200 D)’.
Number and percentage of drug names subject to changes within 1998–2016 PCA data when compared with the current BNF by Chapter
Of the distinct drug names (23 275, taking into account some drugs having multiple BNF classifications), over 91% could be matched to a current product in the BNF, with no change in code (table 3). Less than 5% could not be matched to a current product and/or chemical code, under 1% of items prescribed. These drugs were assigned proxy product names (derived from their drug name) so that all data could be presented visually, and for those not matched to a current chemical, the original chemical name was used (mostly ‘Other Preparations’). However, normalisation was focused on seven of the most prescribed Chapters with the greatest medical interest (1–6 and 10). The normalisation of drugs in other Chapters could therefore potentially be improved. In particular, Chapters 9 (Nutrition) and 13 (Skin) have substantial levels of prescribing, but are complex, containing many different drug names and non-drug products such as topical applications and dietary supplements. Other groups with a particular interest in nutrition or dermatology may wish to expand our work on manual matching: we would be happy to incorporate such amendments into our dataset. Many of the code changes and non-matches have diminished over time, as expected (online supplementary table S2).
Summary of drug code changes within the 1998–2016 prescribing datasets, also separated by (current) chapter. Chapter names can be found in table 2
Code changes and normalisation outputs are described in table 3. Headers indicate the highest level in the BNF hierarchy at which drugs have been subject to code changes, for example, ‘Section’ indicates drug names which have not changed Chapter but have moved Section. ‘No product match’ indicates drug names matched to a chemical (9-character BNF code) but with no current matching product (11 characters). ‘No chemical match’ indicates drug names matched neither to a chemical nor product. The total count of drug names increases when separated by Chapter because four drug names currently exist in two different Chapters.
Interactive data analysis tool
We created a tool which allows anyone to explore the prescribing data, available directly at https://openprescribing.net/pca. Users can search by chemical, Paragraph, Section or Chapter to view time trends in items and costs on stacked charts, where both the overall trends and the relative contribution from each product/chemical can be seen. The cost per item and quantity per item for each product are also shown, which can assist in interpretation of trends in some cases. However, these calculations carry a ‘use with caution’ note, as items may represent different pack sizes and quantities cannot be reliably summed across preparations because of different strengths and formulations. The page features an accompanying video walk through demonstrating the tool.
The tool can be used to facilitate novel research into time trends and factors associated with changes in practice such as publication of guidelines or evidence landmarks or changes in price. It can replicate and extend the main findings of previous papers which researched trends for different clinical areas using PCA data. For example, the antipsychotic drug switches which occurred in England following a licence restriction20 can be replicated in the tool and the trends extended to the latest data (figure 2A). This also shows the dramatic reductions in cost that followed the expiry of patents for risperidone and olanzapine. We also replicate antidepressant prescribing trends, previously reported up to 20105 and show that how the overall use of these antidepressants has continued to rise, in particular sertraline (figure 2B). We also replicate findings on the rise of thyroid hormones3 and testosterone,4 where we show that prescribing of these drugs continued to rise, with a disproportionate increase in cost (see online supplementary figure S1a,b). We are using this dataset and tool in our academic papers on trends and variation in NHS prescribing; we encourage others to use our dataset and tool in their own work.

Screen shots from Trends tool, showing items per 1000 population and inflation-corrected costs per 1000 population for selected drugs. Product names are in parentheses. (A) Prescribing trends for four selected antipsychotic chemicals following the safety alert on thioridazine.20 Full dashboard available at https://public.tableau.com/shared/XX7DTWSG2?:display_count=yes. (B) Prescribing trends for selected antidepressant chemicals.5 Full dashboard available at https://public.tableau.com/shared/72SJGGP89?:display_count=yes. (C) Prescribing trends for all chemicals within the Paragraph of Nicotine Dependence (smoking cessation medications). Full dashboard available at https://public.tableau.com/shared/6BW9J5RJB?:display_count=yes.
The tool can also be used to complement studies performed in more detailed prescribing data such as the Clinical Practice Research Datalink (CPRD), by giving the full national picture, and giving more longitudinal data that updates with new data releases. For example, several previous publications have reported on patterns of prescribing of smoking cessation medication in The Health Improvement Network database.21–23 This included reporting of a possible decline in prescribing despite increased incentives for general practitioners introduced in 2012. We can confirm this decline and show that it continued beyond 2013 (figure 2C). We also show that the slow decline in quinine usage following safety alerts in 201024 has continued at a similar pace (online supplementary figure S1c). CPRD data contain individual patient records and can therefore be used to assess detailed questions about treatments in specific cohorts of patients. However many labour-intensive CPRD analyses have been conducted to interrogate simple broad prescribing trends which could more straightforwardly be conducted using aggregated and normalised national data, with greater coverage of years and total population. Furthermore, for analyses interrogating national trends and responses to guidelines, in many cases a prescribing change which can only be detected in individual patients’ records, and cannot be detected in national data, may not be relevant in terms of population health or the health service.
Additional tabs in the tool allow discovery of higher-level trends, including Chapter and Section trends, Sections ranked by items/cost for any selected year, calculation of the change in items/cost for each Section between any selected year to the latest year, and the top 20 Paragraphs by items and cost. The Chapter trends page, for example, shows that much of the decline in prescribing costs since the peak in 2004 (table 1) is attributable to a drop in the cost of cardiovascular drugs (figure 3A), and the Section trends page further shows that lipid-regulating drugs (Section 2.12) and Drugs for Hypertension and Heart Failure (Section 2.5) experienced the largest cost reductions at that time (figure 3B).

Screenshots from Trends tool, showing inflation-corrected costs per 1000 population (A) by Chapter, and (B) by Section for Chapter 2 (Cardiovascular System).
Discussion
Summary
It was possible to aggregate all PCA data from 1998 to 2016 and normalise for most changes in drug names and classifications. Only 87.5% of drug names matched exactly to a current BNF name and 8.7% had undergone some change in classification; however, all drugs in core clinical chapters were reconciled to their current location in the data schema. We generated an interactive online service where any user can explore time trends in prescribing broken down by product, chemical, Paragraph, Section and Chapter; this openly accessible interactive data analysis tool provides overviews and insights comparable to previous labour-intensive bespoke data analysis research projects.
Strengths and weaknesses of this study
Our tool covers the data for the whole of England’s community dispensing, not a sample. We are surprised to note that this is the first project aiming to aggregate long-term trends across the entire prescribing dataset and provide an openly accessible tool for wider use. Many drugs changed name and/or classification over time, but valid chemicals were successfully assigned to all items in Chapters 1–6 and 10, and product names were derived for every drug, allowing maximum consistency in trends analysis. The tool is limited to product-level data due to the wide number of different presentations available.
We used items to measure prescribing volume. Quantity is generally more complex for making comparisons as there is wide variation caused by the units, which may be the number of pills or millilitres, units (eg, inhalers containing multiple doses) or other unit measure. Converting quantities to approximate daily dose sizes (such as defined daily doses) is possible, but the conversion tables available are not sufficiently comprehensive to allow this across the entire dataset, and this would be even more difficult for discontinued drugs. We therefore rejected this option in favour of being able to publish a complete dataset. However, users wishing to analyse data by daily doses can download our BNF-normalised dataset to apply these calculations. Using items also has limitations, as it does not take into account number of packs prescribed per prescription, pack size or dosage. We are launching this tool publicly and will monitor user volume and user feedback: if appropriate we will improve the tool by replicating and expanding it using bespoke software as per our other data analysis tools on OpenPrescribing.net for exploring variation in prescribing at Clinical Commissioning Group (CCG) and individual practice level. We will update the tool annually, dependent on continuing funds for the OpenPrescribing project.
Findings in context of other research
Long-term trends in prescribing have previously been reported on a wide variety of clinical areas, using PCA data as well as other sources.3–5 20 22 23 These are static, not updated and rapidly out of date. Although using CPRD allows a more detailed analysis and investigation of patient factors associated with prescribing, it takes a great deal of preparation and time to complete. Our tool can replicate some trends found in CPRD and so may provide a useful tool for preliminary investigation of trends. It can also help to confirm whether findings from regional datasets of rich individual patient data (IPD) from electronic health records sources are representative of the national picture, while avoiding repeated work and replication in new IPD datasets. In our related publications on variation and trends in specific disease areas, we report comparisons between trends in PCA data and trends from other more labour-intensive sources such as CPRD in more detail.
The UK government produces a 10-year trends document following the annual PCA data release, containing an overall summary of high-level trends and a brief breakdown of six interesting topics with the greatest level or change in prescribed items and cost.25 However, the reported topics are few in number, chosen by NHS Digital, restricted to 10 years of data, do not correct for inflation or population growth, are not easily discoverable by subject specialists and readers are not able to interrogate their own topics of interest in detail. From 2016, the compiled datasets were also made available so users may conduct their own exploration of the data, but, without drug names or categories being normalised, this is little better than the raw data, which we have processed into a normalised longitudinal dataset.
Policy implications and future research
Published papers can provide a useful and detailed insight into prescribing trends,3–5 but give a single snapshot which may quickly become out of date. Our tool facilitates ongoing monitoring by researchers and policy-makers to assess prescribing changes in any area of concern or clinical interest they have identified and permits interactive exploration of detailed issues in the data, such as individual presentations of chemicals by any interested user. As part of our OpenPrescribing work, we are using prescribing data to investigate adherence to guidelines and changes in practice in various clinical areas to detect anomalous changes in individual practices relative to national trends to send practices alerts and to identify cost-saving opportunities. We have produced various manuscripts using the longitudinal data presented here as part of a range of data sources to describe variation in prescribing in primary care. We are happy to collaborate with other teams of clinicians and academics; we also release our underlying dataset and code as open data for reuse with citation.
Conclusions
Long-term trends in prescribing are interesting for a number of applications. While previous work on prescribing data has focused on static, manual analysis of a small number of drugs, modern data science approaches make it possible to create interactive services that allow clinicians, healthcare commissioners, policy-makers, academics and any other interested party to interrogate and monitor prescribing trends for any combination of chemicals to identify anomalies or signals of concern and predict spending. We have delivered this using a combination of open-data and freely accessible online tools.
Acknowledgments
We are grateful to Seb Bacon for maintaining databases and general assistance and to Richard Croker for pharmaceutical advice and fuzzy matching in Excel.
References
Footnotes
Twitter @OpenPrescribing
Contributors BG conceived and supervised the project, HJC designed the methods, conducted the analysis, interpreted the findings, extracted and processed the data in BigQuery, Excel and Tableau with input from BG. HJC and BG wrote the paper. All authors contributed to and approved the final manuscript. BG is the guarantor.
Funding OpenPrescribing is funded by National Institute for Health Research (NIHR) Biomedical Research Centre Oxford, Health Foundation (Ref 7599), NIHR School for Primary Care Research (Ref 327).
Competing interests BG has received research funding from the Laura and John Arnold Foundation, the Wellcome Trust, the NHS NIHR School of Primary Care, the Health Foundation, NHS England, NIHR Biomedical Research Centre Oxford and the WHO; he also receives personal income from speaking and writing for lay audiences on the misuse of science. HC is employed on BG’s OpenPrescribing grants.
Patient consent Not required.
Provenance and peer review Not commissioned; externally peer reviewed.
Data sharing statement The full compiled and processed PCA datasets are available online via Figshare (DOI 10.6084/m9.figshare.5447194.v1), SQL code is in supplementary file and the Trends tool (Tableau workbook) is available to use via https://OpenPrescribing.net/pca