Article Text

Abstract
Objective Emergency department (ED) overcrowding is acknowledged as an increasingly important issue worldwide. Hospital managers are increasingly paying attention to ED crowding in order to provide higher quality medical services to patients. One of the crucial elements for a good management strategy is demand forecasting. Our study sought to construct an adequate model and to forecast monthly ED visits.
Methods We retrospectively gathered monthly ED visits from January 2009 to December 2016 to carry out a time series autoregressive integrated moving average (ARIMA) analysis. Initial development of the model was based on past ED visits from 2009 to 2016. A best-fit model was further employed to forecast the monthly data of ED visits for the next year (2016). Finally, we evaluated the predicted accuracy of the identified model with the mean absolute percentage error (MAPE). The software packages SAS/ETS V.9.4 and Office Excel 2016 were used for all statistical analyses.
Results A series of statistical tests showed that six models, including ARIMA (0, 0, 1), ARIMA (1, 0, 0), ARIMA (1, 0, 1), ARIMA (2, 0, 1), ARIMA (3, 0, 1) and ARIMA (5, 0, 1), were candidate models. The model that gave the minimum Akaike information criterion and Schwartz Bayesian criterion and followed the assumptions of residual independence was selected as the adequate model. Finally, a suitable ARIMA (0, 0, 1) structure, yielding a MAPE of 8.91%, was identified and obtained as Visitt=7111.161+(at+0.37462 at−1).
Conclusion The ARIMA (0, 0, 1) model can be considered adequate for predicting future ED visits, and its forecast results can be used to aid decision-making processes.
- arima
- emergency department overcrowding
- time series analysis
- prediction
This is an Open Access article distributed in accordance with the Creative Commons Attribution Non Commercial (CC BY-NC 4.0) license, which permits others to distribute, remix, adapt, build upon this work non-commercially, and license their derivative works on different terms, provided the original work is properly cited and the use is non-commercial. See: http://creativecommons.org/licenses/by-nc/4.0/
Statistics from Altmetric.com
Strengths and limitations of this study
Less than three studies have used the autoregressive integrated moving average (ARIMA) model to forecast emergency department (ED) visits in Taiwan. Our results revealed that ARIMA (0, 0, 1) could predict the upcoming month in 2017 with high accuracy.
Compared to determining the model composition via the plot pattern, we also applied other algorithms to determine the model (eg, minimum information criterion, smallest canonical correlation and extended sample autocorrelation function).
The model did not incorporate possible influencing factors related to ED visits, such as atmosphere changes (eg, humidity and temperature), epidemiological information (eg, epidemics) and political issues, including medical policy, resource allocation and healthcare funding strategies.
Introduction
Emergency department (ED) crowding continues to be a major public health issue. Several studies have demonstrated that ED crowding is harmful to patients, as it leads to delays in treatment, a potential increase in medical errors1–4 and, most importantly, nosocomial infections. Thus, hospital managers are increasingly paying greater attention to ED crowding in order to provide better quality service and treatment environments for patients.
Crowding in the ED is defined as having more patients than treatment rooms or more patients than staff should ideally care for, and overcrowding is defined as being dangerously crowded, with an extreme volume of patients in ED treatment areas that forces the ED to operate beyond its capacity.5–7 The ED literature describes several employed ED crowding metrics, such as the rapid emergency admission to destination initiative, work score, emergency department work index and the national emergency department overcrowding scale. These metrics involve many factors (ie, the total number of patients in the ED occupying beds, the total number of patients on respirators, the total number of patients awaiting admission, the number of beds in the ED and so on). However, these metrics reflect only the real-time situation or the past degree of crowding, and they cannot forecast the future ED visits on the basis of statistical theory. Therefore, in order to adjust appropriate capacity in the ED and to arrange for ED resource deployment, we must forecast future ED visits for the next month or next year.
One of the most important and widely used time series models is the autoregressive integrated moving average (ARIMA) model. This model has been adopted in different research fields (ie, epidemiology,8 economics9 and earth science10). With respect to the topic of ED visits forecast, Milner evaluated a 10-year follow-up ARIMA forecasts of ED attendances in 1986.11 Several years later, researchers tried to estimate the association of ED visitor volume with other variables, such as climate, economic, environmental or demographical factors. For instance, Chen et al showed an application of ARIMA model to the forecasts of monthly patient visits and to investigate the association of ED visits with temperature and stock index fluctuation.12 Sun et al showed that multivariate ARIMA method is applied to forecast of ED attendances and to the relationship between ED attendances and ambient air quality.13 What is more, Mai et al demonstrated that the ED demand is predicted to exceed population growth via multivariate vector-ARIMA technique, especially in patients with complex care needs.14 However, its application in ED visits forecasting in Taiwan’s medical institutions is quite limited. For this reason and because of curiosity, we decided to construct an adequate model to forecast monthly ED visits using ARIMA methodology.
Materials and methods
We retrospectively collected ED visit data from the hospital information system of a medical centre in Southern Taiwan via the WebFOCUS (Information Builders, New York, New York, USA). We gathered monthly ED visit data for the period of January 2009 through December 2016 (96 months) to carry out the ARIMA model analysis. This modelling consisted of two important procedures: (1) identification of the model, in which the initial development of the model was based on the period from January 2009 to December 2015 and (2) validation of the fit model, in which the best-fit model was used to forecast ED visits during the period from January 2016 to December 2016. Forecasting accuracy was evaluated by comparison of the forecasted visits with the actual visits.
It was important to evaluate the stationarity of the series prior to any estimation. The augmented Dickey-Fuller (ADF) unit root test, carried out by IDENTIFY statement of the PROC ARIMA procedure, was used to evaluate the stationarity of series data (ie, the mean and covariance remained constant over a period of 96 months). The Ljung-Box test was used to evaluate whether a series of observations over time were random and independent (also called white noise). The next step in the ARIMA methodology is to examine the patterns of the plot of the autocorrelation function (ACF) and the partial autocorrelation function (PACF) to determine the components of ARIMA (p, d, q), where p represents the order of the AR part, d represents the order of regular differences performed and q represents the order of the MA part.15 Mathematically, the pure ARIMA model was written as follows16: Wt=μ+(θ(B)/ψ(B)) at, where t represents the index time; Wt represents the response series Yt or a difference of the response series (Wt=(1−B)d Yt); μ represents the mean term; B represents the backshift operator; that is, BXt=Xt−1; θ(B) corresponds to the moving-average operator, represented as a polynomial in the backshift operator θ(B)=1−θ1(B)−…−θq(B)q; ψ(B) corresponds to the autoregressive operator, represented as a polynomial in the backshift operator ψ(B)=1−ψ1(B)−…−ψp(B)p and at represents the independent disturbance, also called the random error.
The ACF is a statistical tool that evaluates whether earlier values in the series are associated with later values. PACF captures the amount of correlation between a variable and a lag of the said variable that is not explained by correlation at all low-order lags.17 In addition, we also used tentative order selection algorithms, including the minimum information criterion (MINIC), smallest canonical correlation (SCAN) and the extended sample autocorrelation function (ESACF), to assist us in filtration of the other tentative ARIMA models. Once completing the filtration, we compared the Akaike information criterion (AIC) and Schwartz Bayesian criterion (SBC) values18 among the remaining candidate ARIMA models. The adequate forecast model was accompanied by the minimum values for AIC and SBC. After identification of the fitted model, a normality test and independence for model residuals were evaluated (also called autocorrelation to check for white noise). Subsequently, we estimated the parameters to build the ARIMA formula using the maximum likelihood method algorithm. Finally, the prediction accuracy of the model was verified based on the mean absolute percentage error (MAPE), which was defined as follows19:

where XI denotes the observed ED visits at month I, and  denotes the predicted ED visits at month I. All statistical analyses were conducted using the PROC ARIMA procedure in SAS/ETS V.9.4 and Office Excel 2016.
Results
Temporal analysis
A total of 84 months (from January 2009 to December 2015) of data were imported into the SAS library. An ED visit plot of the original data is shown in figure 1. The mean, SD and number of observations for the undifferenced series were 7108, 547 and 84, respectively. The observational plot showed a severe oscillation period followed by a mild oscillation period. Subsequently, a moderate oscillation period appeared. In addition, a dramatic elevation in ED visits occurred in January 2012.

Time series plot of emergency department (ED) visits from January 2009 to December 2015. The observational plot showed a severe oscillation period followed by a mild oscillation period. Subsequently, a moderate oscillation period appeared. In addition, a dramatic elevation in ED visits occurred in January 2012.
The ADF unit root test revealed that there were no unit roots in the characteristic polynomial of the model fitted to the ED visit data at lag 0, 1 or 2 (all P<0.001 for the single mean test and the trend test, see online supplementary table 1). In addition, the white noise hypothesis was supported (P>0.05), as shown in online supplementary table 2. Since we assumed that the series data were stationary (ie, the mean, variance and autocorrelation were constant through time), the procedure of difference was ignorable, and the d order of ARIMA was equal to zero.
Supplementary file 1
Model fitting
The ACF plot in figure 2A shows a significantly positive spike at lag 1, revealing a non-seasonal MA component of one order (q=1). The PACF plot shown in figure 2B reveals a significantly positive spike at lag 1, suggesting a non-seasonal AR component of one order (p=1). In addition, we found no seasonal lag in the ED visit series data within the period examined. Therefore, the proposed model was ARIMA (1, 0, 1). In addition to relying on the pattern of the ACF and the PACF, we also used the following identification techniques to determine the order of MA and AR. (1) MINIC method: the minimum of this matrix was equal to 12.41575, as highlighted in online supplementary table 3, corresponding to an AR of 0 and an MA of 1 location (0, 1). (2) SCAN method: there were two (maximal) rectangular regions in which all the elements were insignificant with a 95% CI, as shown in online supplementary table 4; this method revealed two vertexes at (0, 1) and (1, 0). (3) ESACF method: there were five triangular regions in which all elements were insignificant at the 5% level; the vertices of the triangles, including (0, 1), (1,1), (2,1), (3,1) and (5,1) are shown in online supplementary table 5. The P values for the Ljung-Box test all exceeded 5% for all lag orders, implying that there was no significant departure from white noise for the residuals in the six candidate models.
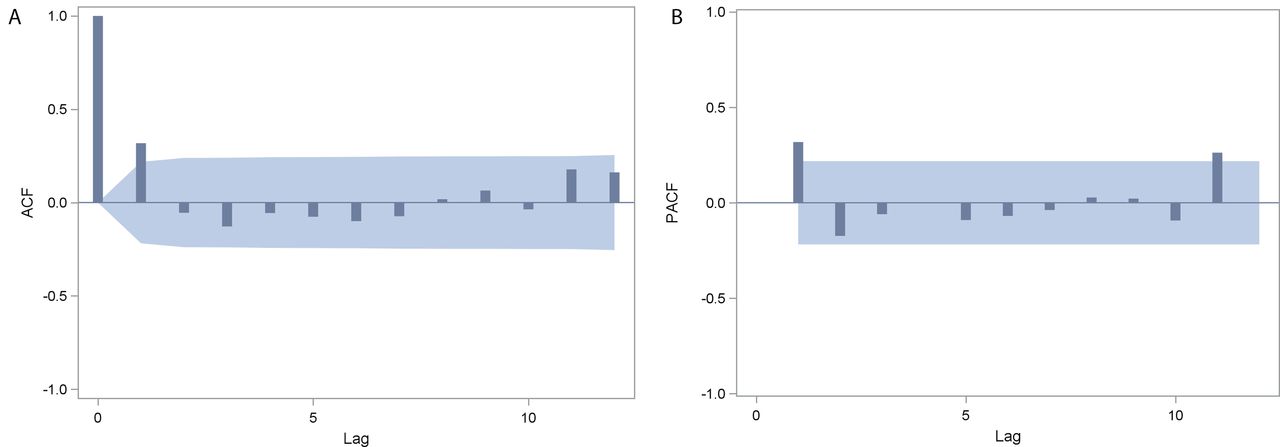
Autocorrelation function (A) and partial autocorrelation function (B) for ED visit time series. The former shows a significantly positive spike at lag 1, revealing a non-seasonal MA component of one order. The latter shown in (B) reveals a significantly positive spike at lag 1, suggesting a non-seasonal AR component of one order (p=1). In addition, we found no seasonal lag in the ED visit series data within the period examined. ACF, autocorrelation function; AR, autoregressive; ED, emergency department; MA, moving average; PACF, partial autocorrelation function.
We then calculated the values of the relative quality measures AIC and SBC for six candidate ARIMA models, as shown in online supplementary table 6. Hence, the final model selected for ED visit data was ARIMA (0, 0, 1). Thus, we next sought to verify the adequacy of this model. Figure 3 shows the residual correlation and white noise test plots; we accepted the null hypothesis that the residuals were uncorrelated. The normality plots also showed no departure from normality. Thus, we concluded that the ARIMA (0, 0, 1) was adequate for the change in ED visit series. The next step was parameter estimation, which made use of the ESTIMATE statement of the PROC ARIMA procedure. The results are reported in table 1. We proceeded in our analysis to check whether all parameters contained in the models were significant. There were two parameters in the model. The mean term was labelled as MU; its estimated value was 7111.2, and the P value for MU indicated that this term significantly contributed to the model (P<0.0001). The moving-average parameter was labelled as MA1, 1; this was the coefficient of the lagged value of the change in ED visits, and its estimate was −0.37462 (P=0.0003). The ARIMA (0, 0, 1) was further selected to forecast ED visits, where the autoregressive term p=0, the difference term d=0 and the moving average term q=1. According to the dataset in table 1, the mathematical formula of the fitted ARIMA (0, 0, 1) model was given by the following:

After transforming the back operator, the equation became


Graphical check of the residuals for the model (0, 0, 1). We accepted the null hypothesis that the residuals were uncorrelated. The normality plots also showed no departure from normality. ACF, autocorrelation function; IACF, interaural cross-correlation function; PACF, partial autocorrelation function.
Parameter estimates for the ARIMA (0, 0, 1) model using the algorithm of maximum likelihood.
We used this equation to produce the values and plot of the forecast from January 2009 to December 2017 using the FORECAST statement of the PROC ARIMA procedure. The trend plot of the forecast performance is shown in figure 4. By comparing the actual visits with the forecasted visits, the MAPE value, a measure of the prediction accuracy of forecasting methods in statistics,20 was approximately 8.91%. Thus, the forecasting power of the model showed highly accurate forecasting. The model forecasted a slight increase in ED visits in the upcoming month in 2017, with constant visits observed based on the fitted model.

The trend plot of the forecast using the ARIMA (0, 0, 1) model. The solid vertical line in the forecast plot corresponds to January 2016, where the model ends and the forecasts begin. The model forecasted a slight increase in ED visits in the upcoming month in 2017, with constant visits observed based on the fitted model. ARIMA, autoregressive integrated moving average; ED, emergency department.
Discussion
This study focused on the process and the results of a time series analysis of ED visits. Our results revealed that an ARIMA (0, 0, 1) model was appropriate for forecasting ED visits in the upcoming years 2016 and 2017. In addition, the model’s fitted amounts and the normality of the model residuals’ distribution confirmed the model’s fitness.
Although this was not the first study to forecast monthly ED visits via ARIMA methodology, it was the first forecasting of ED visits that showed the entire statistical process. Our result paragraphs clearly describe the entire process involved in constructing the model and predicting the data. The process and results of the ARIMA methodology played equally important roles. In addition to determining the model construct via the pattern of ACF and PACF, we employed other identification techniques, such as MINIC, SCAN and ESACF methods. To date, most studies have determined only the p and q terms in an ARIMA model via the plot pattern of ACF and PACF.
Forecasting future ED visits, as an important issue in ED surveillance systems, plays a key role in providing a comfortable medical environment, preventing ED crowding, helping with ED resource deployment and even avoiding nosocomial infections. In spite of highly accurate forecasting, we found that there were still two ED visit months (February 2011 and January 2012) that fell outside the 95% CI. There are two reasons for this result. The major reason is that an influenza-like illness was prevalent at that time; the Taiwan National Infectious Disease Statistics System showed that there were two dramatic increases during the fifth week of 2011 and the fourth week of 2012 (see online supplementary figure 1). The peaks located at these time points are in accordance with the peaks shown in figure 1. The minor reason was that these peaks occurred during the traditional Chinese New Year period. Since most clinics and hospital outpatient departments are closed during this time, ED visits showed an upward trend.
To our knowledge, only two research teams have applied the ARIMA model for studying the variability of monthly ED visitors.12 13 However, our study suffered from a few limitations. First, we employed the univariate ARIMA model to forecast ED visits. However, the Taiwan National Infectious Disease Statistics System demonstrated that epidemics clearly influence the quantity of ED visits. Additionally, the transmission of influenza virus is dependent on relative humidity and temperature,21 and our model did not incorporate certain factors related to ED visits, such as atmosphere changes (eg, humidity and temperature) and epidemiological information (eg, epidemics). Second, several political issues, including medical policy, resource allocation and healthcare funding strategies, were worth a thought. However, our ARIMA model couldn’t reflect the influence of those. Third, this best-fit model with high accurate forecasting took possess of specificity. It can maximise the percentage of variations explained but limit the ability of the results to be generalised.22 This should be considered when generalising the finding of the study to other hospitals. Final limitation was that regardless of the statistical prediction method, unexpected emergencies cannot be forecasted (eg, food poisoning in a community and burn disaster). Once an accident occurs, the medical personnel only depend on the corresponding guidelines of emergency recall. In the future, we will recruit the abovementioned factors to reach more accurate prediction via multiple ARIMA models.
Conclusion
Monthly ED visits were shown to follow the ARIMA model (0, 0, 1). This model can be considered adequate for predicting future ED visits at a hospital and can be employed to aid in decision-making processes. Our findings provide new insights into the reasons for overcrowding in the ED and may be helpful in further development of the ARIMA (0, 0, 1) model to forecast reasons for overcrowding in the ED.
Acknowledgments
The authors gratefully acknowledge the technical assistance and the invaluable input and support of S-JH.
References
Footnotes
Contributors WC-J and SR-W conceived and designed the study. FD-H conducted most of the studies with assistance from PW-C. SJ-H wrote the paper with contributions from PW-C. All authors were involved in the revision of the manuscript for important intellectual content.
Funding This work was supported by grants from the Kaohsiung Veterans General Hospital (VGHKS106-198, VGHKS106-031 and VGHKS106-168) provided to SR-W and WC-J.
Competing interests None declared.
Ethics approval The medical ethics committee of the Institutional Review Board of the Kaohsiung Veterans General Hospital agreed (Kaohsiung, Taiwan; IRB no VGHKS17-CT5-15) that the use of emergency department visits from the Disease Surveillance System did not involve personal private information, and the present study was retrospective without any biological experiments related to humans or animals. The committee therefore waived the need for ethics approval for utilisation of the data.
Provenance and peer review Not commissioned; externally peer reviewed.
Data sharing statement No additional data are available.