Article Text

Abstract
Background No comprehensive study currently exists on the supply of ophthalmologists across Latin America. We explored sociogeographic inequalities in the availability and distribution of ophthalmologists across 14 Latin American countries.
Methods The National Ophthalmologic Societies of Argentina, Bolivia, Brazil, Colombia, Costa Rica, Chile, the Dominican Republic, Ecuador, Guatemala, Mexico, Paraguay, Peru, Uruguay and Venezuela provided data on affiliated ophthalmologists by first-order subnational divisions in 2013. Human Development Index (HDI) estimates at the corresponding subnational division were used as equity stratifiers. Distributional inequality of ophthalmologists within each country was assessed by the health concentration index (HCI) and the index of dissimilarity (ID), along with the mean level of ophthalmologists per population.
Results Across all countries studied, there were 5.2 ophthalmologists per 100 000 population on average (95% CI 5.0 to 5.4) in 2013, with a mean HCI of 0.26 (0.16 to 0.37) and a mean relative ID of 22.7% (20.9% to 24.7%). There was wide inequality in ophthalmologist availability between countries, ranging from 1.2 (1.1 to 1.4) in Ecuador to 8.6 (8.5 to 8.8) in Brazil. All countries had positive (ie, pro-rich) HCI values ranging from 0.68 (0.66 to 0.71) in Guatemala to 0.02 (−0.11 to 0.14) in Venezuela. Correspondingly, redistributive potential to achieve equity was closest in Venezuela (ID: 1.5%) and farthest in Guatemala (ID: 60.3%). Benchmarked against regional averages, most countries had a lower availability of ophthalmologists and higher relative inequality.
Conclusions There is high inequality in the level and distribution of ophthalmologists between and within countries in Latin America, with a disproportionate number concentrated in more developed, socially advantaged areas. More equitable access to ophthalmologists could be achieved by implementing incentivised human resources redistribution programmes and by improving the social determinants of health in underserved areas.
- PUBLIC HEALTH
- OPHTHALMOLOGY
- SOCIAL MEDICINE
This is an Open Access article distributed in accordance with the Creative Commons Attribution Non Commercial (CC BY-NC 4.0) license, which permits others to distribute, remix, adapt, build upon this work non-commercially, and license their derivative works on different terms, provided the original work is properly cited and the use is non-commercial. See: http://creativecommons.org/licenses/by-nc/4.0/
Statistics from Altmetric.com
Strengths and limitations of this study
This study shows sufficient evidence that there are inequities concerning the number and distribution of ophthalmologists across Latin America, demanding action to be taken to provide fairer access to ophthalmologists.
Data collection revealed that national health information systems are not recording the number and distribution of healthcare workers in ophthalmology in most countries.
The majority of acquired data derive from the number of registered ophthalmologists in national societies of ophthalmology only, which is not representative of all working ophthalmologists in a country.
The data acquired from Venezuela were provided by the Ministry of Health, not its respective National Society of Ophthalmology.
Introduction
An estimated 285 million people worldwide suffer some form of visual impairment, many (80%) cases of which are preventable, that is, treatments are both well known and cost-effective.1 Since many of these patients are not in receipt of proper eye care, studies are needed to investigate the reason(s) for existing barriers to such care. In regions of Latin America and Africa, for example, lack of awareness and unmanageable costs appear to be the central barriers to care, while insurance coverage and language are more common in Australia.2–4 For other countries, however, the blame resides in lack of access to services.2–6
In 2014, the Pan American Health Organization's Plan of Action for the Prevention of Blindness and Visual Impairment, approved by the Ministries of Health of Latin America and the Caribbean (LAC), used ‘cataract surgical coverage’ data7 (from epidemiological studies on blindness and visual impairment in Latin America) as an indicator of access to eye care services.2 ,8 Findings from nine different surveys across Latin America showed that the coverage of cataract surgeries was lowest in rural and low socioeconomic areas, indicating inequities in the distribution of eye care services.9 Furthermore, using cross-sectional eye health surveys, a comparative assessment conducted in seven Latin American countries demonstrated that prevalence of blindness and moderate visual impairment were concentrated in the most socially disadvantaged areas, while cataract surgical coverage and optimal outcomes of cataract surgery were concentrated among the wealthiest, socially advantaged areas.10 Such data present a change in questions, that is, from ‘What is causing inaccessibility to services?’ to ‘What is causing inequities in services?’. Thus, the purpose of this study was to investigate the distribution of ophthalmologists at subnational levels as a potential cause for inequities and social inequalities in delivery of eye care services.
Prior investigations in LAC revealed an unequal distribution of ophthalmologists, based on geographic location and subnational gross domestic product (GDP) per capita.11 ,12 For the purpose of the present study, the Human Development Index (HDI) was used. The HDI is considered a more comprehensive measurement of equity stratification, as it captures social and economic dimensions of human capital. In our report, we summarise the distributional inequality in terms of standard measures of disproportionality in the availability of ophthalmologists per population across subnational social gradients (defined by HDI values) of 14 Latin American countries. Our hypothesis is that there is an unequal subnational distribution of human resources in ophthalmology throughout Latin America, with the majority of ophthalmologists being concentrated in the wealthier areas.
Materials and methods
To measure the distributive inequality of eye care professionals, our study included ophthalmologists from LAC Spanish speaking countries, plus Brazil. Data on the total number of ophthalmologists at the subnational level were not available from sources other than the National Society of Ophthalmology for most of the participating countries—Argentina, Bolivia, Brazil, Chile, Colombia, Costa Rica, the Dominican Republic, Ecuador, Guatemala, Mexico, Paraguay, Peru, Uruguay and Venezuela. They were contacted by email and phone to retrieve disaggregated data for 2013. No reliable data were found on subnational numbers on other eye care professionals in most countries such as optometrists, ophthalmic assistants or technologists.
Overall, our study comprised 310 first-order subnational units from 14 countries, accounting for 93.6% of the study base population (ie, LAC Spanish speaking countries, plus Brazil), and 90.7% of the total LAC regional population in 2013.13 All countries were divided into their respective first subnational geopolitical divisional units, and the total number of persons/ophthalmologists affiliated to each respective national society within each unit was obtained. Each subnational unit was assigned its HDI value circa 2013, as developed by each country with support from the United Nations Development Programme (UNDP). The HDI is a composite measurement of vital dimensions of human development, namely: a long and healthy life, being knowledgeable and a decent standard of living.14 Actual indicators aggregated to compute the subnational HDI are specific by country. The HDI served as the equity stratifier, by which the subnational units were ordered from lowest (ie, most socially disadvantaged) to highest (ie, most socially advantaged), defining the population hierarchy or gradient across which the inequality in the distribution of ophthalmologists was studied and summarised with three standard indicators of health equity: the health inequality concentration index (HCI), the absolute index of dissimilarity (aID) and the relative index of dissimilarity (rID), as described below.15 ,16 For the availability indicator, the number of ophthalmologists/100 000 persons was used. Uncertainty was ascertained by computing 95% CIs for all summary measures of health inequality as well as the mean number of ophthalmologists per 100 000 people. To generate a national current status scenario profile, countries were benchmarked against regional (ie, overall) weighted means of both human resource availability and its relative distributional inequality (as measured by the HCI), based on an analytical framework derived from Minujin and Delamonica's.17 Four possible scenarios were discriminated, based on whether a given country had an ophthalmologist's availability and sociogeographic inequality higher and/or lower than the regional benchmark.
The HCI (range −1 to +1; 0=equity) measures the degree of disproportionality in the equity stratifier-defined gradient between each subnational unit's population and health shares. A negative inequality implies a disproportionately high concentration of ophthalmologists on the most socially disadvantaged segments of the population. A positive inequality implies a disproportionately high concentration of ophthalmologists on the more socially advantaged segments of the population. Using non-linear optimisation, the HCI was computed by fitting a Lorenz concentration curve equation to the observed cumulative relative distributions of the population—as ranked by the HDI—and health—the number of ophthalmologists—across the subnational divisions studied, and numerically integrating the area under the curve.18 ,19
The rDI represents the percentage of ophthalmologists who would have to be redistributed to achieve equitable distribution, also known as the redistributive potential, between the units of analysis, in this case, subnational geopolitical units. The closer the value is to 100%, the greater the inequality. The rDI is computed by dividing the aDI (see below) by the total number of ophthalmologists available. This proportion is expressed as a percentage.16 ,19
The aDI expresses the absolute magnitude of the rDI, that is, or the precise number of ophthalmologists who would have to be redistributed sociogeographically to achieve equity within a given country. The aDI is computed as half the sum of the absolute value of the differences between the number of ophthalmologists expected under equity and those observed in each unit. The number of ophthalmologists expected under equity is obtained by applying the national rate of ophthalmologists/100 000 persons to each unit.
To explore the extent of urban concentration of ophthalmologists in each country studied, we calculated the availability of ophthalmologists per 100 000 population in the capital area (ie, the subnational geographical area which contains the capital city of the given county), as well as those in the rest of the country, and computed the capital area/rest-of-the-country availability ratio of ophthalmologists per 100 000 population.
All statistical analyses were performed in MS Excel Solver and ToolPak add-ins (Microsoft Corp., Redmond, Washington, USA), using a semiautomated analytical template tool developed by the Pan American Health Organization (PAHO) for exploratory data analysis of social inequalities in health.
Results
All four core metrics outputs for each of the 14 Latin American countries in our study, with their 95% uncertainty range, are presented in table 1, along with overall weighted estimates at the regional level. On average, these were 5.2 ( 5.0 to −5.4) ophthalmologists per 100 000 population, an HCI of 0.26 (0.16 to −0.37), an rID of 22.7% (20.9% to 24.7%) and an aID of 5506 (5165 to 5886) ophthalmologists-for-redistribution in 2013, with ample variation in all four core metrics across all countries studied.
National averages and main inequality metrics in availability of ophthalmologists per population within countries of the Americas, 2013
Wide inequality was observed in the availability of ophthalmologists between countries, ranging from 1.2 (1.1 to1.4) in Ecuador, 1.3 (1.1 to 1.5) in Guatemala and 1.9 (1.7 to 2.2) in the Dominican Republic to 5.4 (5.2 to 5.6) in Argentina, 5.5 (4.8 to 6.4) in Uruguay and 8.6 (8.5 to 8.8) in Brazil.
Even wider inequality was observed in the availability of ophthalmologists within countries, as assessed by their HCI. All countries had positive HCI values, indicating their pro-rich distribution, that is, the disproportionate concentration of ophthalmologists towards subnational units with a higher social advantage, as captured by their higher human development. As shown in table 1, the most unequal countries in terms of subnational distribution of ophthalmologists were Guatemala, Paraguay and Peru, with HCI mean values of 0.684, 0.578 and 0.499, respectively. For instance, in Guatemala, the country with the most extreme sociogeographic inequality in the distribution of ophthalmologists in our study, the least developed 20% of the population concentrated only 2% of the total number of nationally associated ophthalmologists, whereas the highest quintile concentrated more than 75% of all available ophthalmologists in the country (figure 1). In contrast, the least unequal countries in the subnational distribution of ophthalmologists were Venezuela, Argentina and Bolivia, with HCI mean values of 0.02, 0.06 and 0.12, respectively. As a matter of fact, among the countries studied, these were the only three with HCI CIs encompassing the equity reference (ie, zero), indicating that there was indeed no statistically significant inequality in the sociogeographic distribution of ophthalmologists.

Concentration curve of distributive inequality of ophthalmologists in Guatemala, 2013. HCI, health concentration index; HDI, Human Development Index.
Table 1 also shows the results of the analysis of redistributive potential to achieve equity in the availability of ophthalmologists across subnational units in each country, as indicated by the aID and rID. These results are highly consistent with those from the analysis of the HCI. Consequently, the redistributive potential to achieve equity was lowest/closest in Venezuela and highest/farthest in Guatemala (rID: 1.5% and 60.3%; aID: 20 and 108 ophthalmologists, respectively). In Argentina, for instance, <10% (around 200) of its ophthalmologists would need to be redistributed subnationally to eliminate inequity, whereas Peru would need to redistribute close to 40% (around 400) of its ophthalmologists to achieve distributional equity. Other countries with a higher proportion of ophthalmologists needing to be redistributed at the subnational level are the Dominican Republic and Paraguay (48.9% and 45.4%, respectively). Since these are relative figures, the numbers may vary significantly in absolute terms. For example, although 203 (9.4%) of Argentina's ophthalmologists need to be redistributed to achieve equity, 108 (60.3%) in Guatemala need to be redistributed, well more than half of Guatemala's ophthalmologist pool.
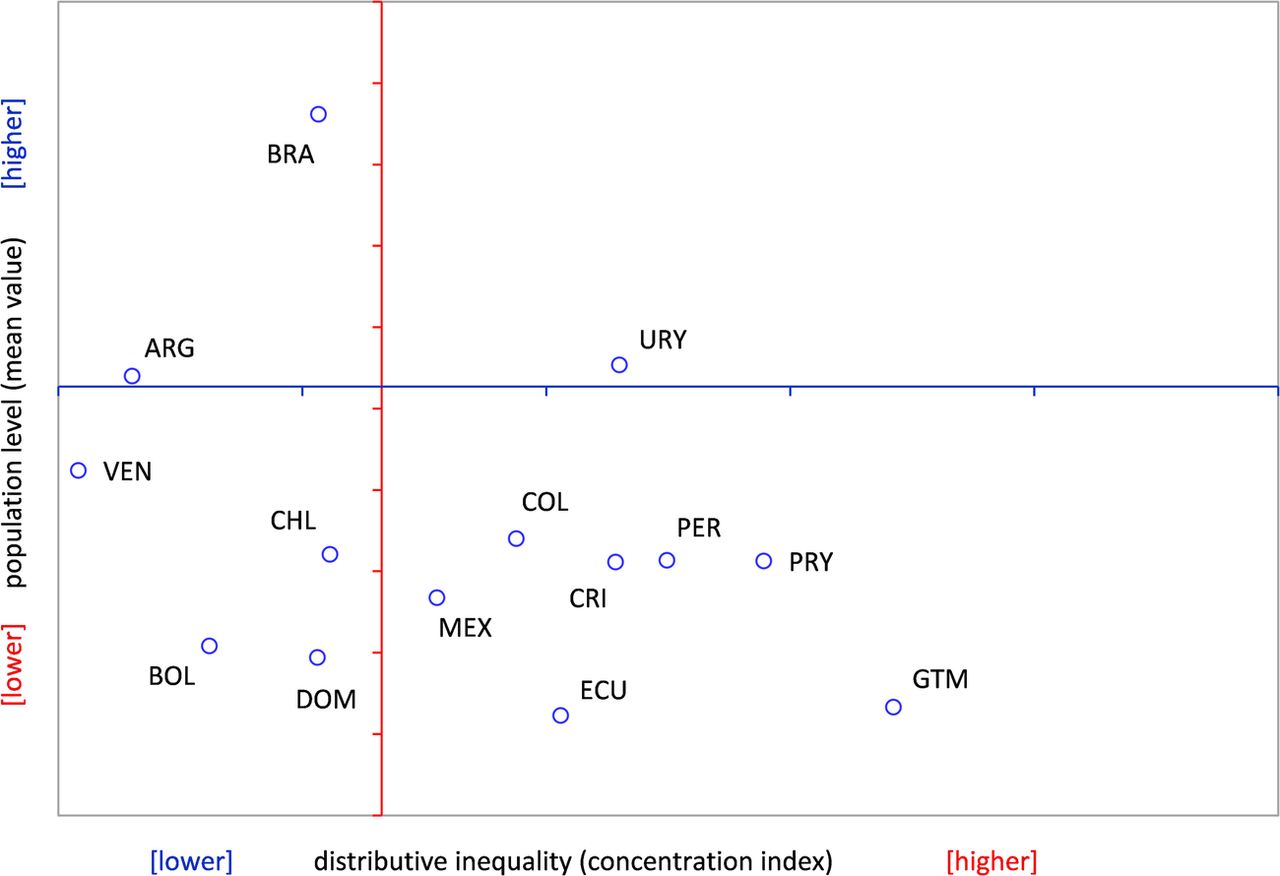
As shown in figure 2, when benchmarked against the regional level and distribution averages, most countries had a lower availability of ophthalmologists and higher relative inequality. These countries, in the lower availability/higher inequality scenario (ie, the lower right quadrant of the graph), are Guatemala, Paraguay, Peru, Costa Rica, Colombia, Mexico, and Ecuador. One single country, Uruguay, fell in the higher availability/higher inequality scenario (upper right quadrant); other four countries–the Dominican Republic, Bolivia, Chile, and Venezuela–were set in the lower availability/lower inequality scenario (lower left quadrant). Only two countries studied—Argentina and Brazil—end placed in the higher availability/lower inequality (preferred) scenario (upper left quadrant).

Availability level and distributive inequality of ophthalmologists per population. Countries of Latin America and the Caribbean (n=14), 2013. ARG, Argentina; BOL, Bolivia; BRA, Brazil; CHL, Chile; COL, Colombia; CRI, Costa Rica; DOM, Dominican Republic; ECU, Ecuador; GTM, Guatemala; MEX, Mexico; PER, Peru; PRY, Paraguay; URY, Uruguay; VEN, Venezuela.
There is a wide range of unequal concentration of ophthalmologists in the capital city area as compared with the availability of those resources in the rest of the country, ranging from 1.00 (0.86 to 1.18) in Venezuela, 1.01 (0.75 to 1.38) in Bolivia and 1.22 (1.13 to 1.33) in Argentina to 5.62 (3.83 to 8.23) in Costa Rica, 8.02 (6.07 to 10.58) in Paraguay and 14.00 (9.91 to 19.78) in Guatemala (table 2).
Availability of ophthalmologists per population in capital areas (C) vis-à-vis rest-of-country areas (R) in the Americas, 2013
Discussion
This study analysed and compared the sociogeographic distribution of ophthalmologists between and within 14 Latin American countries. We conclude that ophthalmologists are disproportionately distributed across Latin American countries, and that this distributive inequality follows a social gradient, such as the one defined by human development, favouring those areas that are more socially advantaged.
The finding that availability of ophthalmologists per population is not uniformly distributed between countries is not limited to Latin America, as it is prevalent worldwide. According to the 2012 International Council of Ophthalmology global survey, in 2010 there were fewer than 1 ophthalmologist per 1 000 000 persons in 23 countries, fewer than 4 ophthalmologists per 1 000 000 persons in 30 countries, 4 to fewer than 25 ophthalmologists per 1 000 000 persons in 48 countries, and 25 to fewer than 100 ophthalmologists per 1 000 000 persons in 74 countries.20
The results of our study indicate that Argentina, Brazil and Uruguay each have an average number of ophthalmologists per 100 000 persons that is higher than the regional average (5.27). The other 10 countries—Bolivia, Colombia, Costa Rica, the Dominican Republic, Ecuador, Guatemala, Mexico, Paraguay, Peru and Venezuela—had an average number of ophthalmologists per 100 000 persons that fell below that regional average. In the 2006–2011 Global Action Plan for Avoidable Blindness, the WHO established regional targets of two ophthalmologists per 100 000 population in Asia and one ophthalmologist per 250 000 in sub-Saharan Africa; a regional target was not indicated for Latin America.21 Furthermore, no specific targets of any region were published in the most recent 2014–2019 Global Action Plan. However, in a 2002 review of ophthalmological services in Latin America, a target of 10 active eye surgeons per million was proposed to address low cataract surgical output, but a threshold of 15 ophthalmologists (10 surgical ophthalmologists, 5 non-surgical ophthalmologists) was used as it assumed that 30% of those eye physicians do not perform surgeries.11 In the 2012 International Council of Ophthalmology global survey, only 37% of ophthalmologists in low–middle income countries were estimated to actually perform surgeries.20 With this new evidence, it is suggested that a minimum of 27 ophthalmologists per million (10 surgical ophthalmologists, 17 non-surgical ophthalmologists), or 2.7 ophthalmologists per 100 000, be used as an updated threshold to address the demands in eye care services. According to our results, Bolivia, the Dominican Republic, Ecuador and Guatemala fall below this proposed target and it is of paramount importance that these countries work towards improving their national pool of available ophthalmologists per population. The fact that all other countries involved in this study have means above the suggested threshold of 2.8 only further highlights the existence of alternative factors that perpetuate poor eye health other than insufficient human resources.
Even more striking is the ubiquity of distributional inequality of available ophthalmologists within the countries studied: all of them have relative inequality metrics signalling a disproportionate concentration of these highly specialised human resources among the more socially advantaged geographic areas. In our study, eight countries—Colombia, Costa Rica, Ecuador, Guatemala, Mexico, Paraguay, Peru and Uruguay—had HCIs above the regional average (0.265); Guatemala and Paraguay have a very high concentration of ophthalmologists in the capital city area compared with the other countries. A similar Canadian study also reported regional inequities in the distribution of ophthalmologists, although the authors explored only geographic inequities, not social inequities. Among the territories and 10 provinces included in that study, the ratio of ophthalmologists per 100 000 persons varied significantly: 5.40 in Nova Scotia, 1.96 in Saskatchewan and 0.890 in the territories.22 A Brazilian study also found sociogeographic inequalities in ophthalmologist coverage, with a positive correlation (r=0.877) between the number of ophthalmologists per inhabitant and GDP per capita at the first-order subnational unit level (ie, the states), indicating a higher proportion of eye physicians concentrated in areas more financially stable and well developed.12 In Japan, physicians were found to be more concentrated in areas with larger populations, that is, urban cities. Recent influxes of physicians into such areas are escalating, further increasing the physician disparity gap.23
While there are >200 000 ophthalmologists worldwide, they are disparately distributed, with numbers clearly inadequate for meeting the demands of growing populations.20 Improving this situation would have an immediate redistributive effect, as well as suggest social interventions for determining the specific disadvantaged population segments that would be benefited. Several studies have offered explanations for these inequities, including the notion that physicians are drawn to more densely populated areas because of better work environments, urbanisation, higher salaries and attractive career opportunities.23–26 While several human resources programmes have been established and implemented at national and regional levels, it has been suggested that additional implementation take place at subnational levels.27 Furthermore, based on the observation that both ophthalmologists and other physicians tend to make similar choices when choosing work locations, it has been suggested that a review of data regarding overall distribution of physician human resources be undertaken in order to improve the distribution of ophthalmologists. A Finnish study found no significant differences between general practitioners and eye physicians when choosing work locations.26 More research is needed in Latin America to identify factors influencing ophthalmologist preferences vis-à-vis work locations.
Inequities in distribution of ophthalmological human resources are not the only determinants of Latin America's high rates of blindness and low physician coverage. Human resources is but one function of health systems, which additionally comprise governance, financing, delivery of service, eye health workforce, medical products, vaccines, technologies and health information.28 In fact, without sufficient financing, the health necessities of a population cannot be met, goals cannot be reached, and health workers cannot be adequately secured. Within the eye health workforce building block itself, there are also non-physician clinicians (NPCs) who contribute to reducing disease and increasing coverage of services. Studies have shown that the outputs of NPCs can significantly substitute for those of ophthalmologists. In the USA, NPCs are growing in number and are providing services that overlap with those provided by physicians. It has been predicted that NPCs will become equal to 40 physicians per 100 000 persons over the next 15 years, representing ∼15% of the physician workforce.29 Perhaps, in the expectation of capturing a more effective methodology for reducing blindness inequities, future studies can include NPCs, for example, optometrists, opticians and primary eye care physicians. Furthermore, productivity and/or surgical output, as accompaniments to the number of ophthalmologists, should be assessed. Since human resources make up the bulk of government health budgets, poor performance is recognised as one of the main barriers to efficiency and quality of services.30 Further research into the number of surgeries/ophthalmologist, specifically performed within provinces, has been suggested.2
This study provides evidence that can be used by governments and national societies to establish policies and develop programmes that sustainably and effectively improve the number of ophthalmologists within each country, as well as reduce the inequities among their distribution. Although evidence shows that this can be achieved through incentive programmes, better work environments and further career opportunities, a more comprehensive social determinant of health approach is needed, that is, the implementation of far-reaching social interventions to improve each population's human development. More research into the specific motivations for work preferences by ophthalmologists, as well as documentation of numbers and quality of their surgeries, needs to be conducted. In addition, it is recommended that countries define the professional profile of all members of the eye care team and incorporate them in the national human resources information systems that should lead to enhanced comparability and generalisability of findings in future studies. Having an all-inclusive collection of these data is necessary for governments to make effective and efficient national human resource development plans.
Our study had a limitation in that the included data consisted of numbers of ophthalmologists affiliated only to their respective national ophthalmologic societies, as opposed to the total national number of ophthalmologists in each of the 14 Latin American countries. It should be noted that the number of national society-affiliated ophthalmologists is not a conclusive measurement of all ophthalmologists within a province and, therefore, cannot be extrapolated to the entire country. There is a pressing need to acquire a complete national ophthalmology register, as well as to overcome the barriers in data collection that prevent access to such information. However, our study shows sufficient evidence that inequities concerning the number and distribution of ophthalmologists across Latin America exist, demanding action to tackle them in order to provide fairer access to ophthalmologists everywhere.
Acknowledgments
The authors gratefully thank the National Ophthalmologic Societies of the countries involved in this study for providing the disaggregated data on their affiliates.
References
Footnotes
Contributors JCS conceived the research question and developed the idea and design of the study. HH conducted the literature review and was the lead author in drafting the manuscript. OJM conducted the statistical analyses, interpreted findings, and helped draft the manuscript. JA, VCL, and EL collected and provided access to the data. All authors contributed to the data interpretation, critically reviewed the work, and gave the final approval of the version to be published.
Funding This research received no specific grant from any funding agency in the public, commercial or not-for-profit sectors.
Competing interests None declared.
Provenance and peer review Not commissioned; externally peer reviewed.
Data sharing statement No additional data are available.
Linked Articles
- Correction