Article Text

Statistics from Altmetric.com
Mean arterial pressure (MAP) is defined as the average pressure throughout the cardiac cycle.1 It has physiologic and clinical importance since it represents the perfusion pressure and it is a factor utilised in the calculation of haemodynamic variables. Based on the normal blood pressure curve configuration, the functional MAP is lower than the arithmetic one (pulse pressure/2). For many years, MAP has been calculated by blood pressure cuff measurements using an empiric formula, which states that the MAP equals one third of the distance between the systolic pressure (SP) and the diastolic pressure (DP).2 ,3 Since the true mean pressure is the time–weight average of a series of instantaneous pressures, the above formula has substantial limitations.4 This article proposes a more precise formula for the estimation of mean arterial pressure. A nomogram for the calculation of MAP is also provided.
The blood pressure tracings and haemodynamic data of 150 patients who underwent cardiac catheterisation were analysed. Eighty six were male and 64 were female. Ischaemic heart disease was diagnosed in 101 patients, valvar heart disease in 21, congenital heart disease in 26, pericardial disease in 1, and idiopathic cardiomyopathy in 1 patient. The mean age was 51 years (5 months to 87 years). In all cases the arterial pressure was measured in the ascending aorta with conventional catheters connected to a pressure transducer (Statham P23). All patients were in sinus rhythm. Systolic pressure was measured at the peak of the curve and the diastolic pressure at the nadir. MAP was determined by electronic damping of the signal in all cases.
The traditional formula for the calculation of MAP is the following2:
MAP = DP + 0.333 (SP − DP) or [SP + (2DP)]/3
In order to determine if there was a more precise multiplier than β = 0.333, a linear regression with one parameter was utilised. Specifically we fitted y = MAP − DP tox = SP − DP using a linear model with no intercept.
The least squares estimate of β is 0.412. Figure 1 reveals the underestimation of the correct value using the 0.333 multiplier and the closer answers to the average when 0.412 is used as the multiplier. The reference line shown is the identity line—that is, it is the line corresponding to the y value being equal to the x value.

Scatter plot of mean arterial pressure (MAP) obtained by electronic damping (y axes) versus MAP obtained with 0.333 (graph A) and 0.412 (graph B) as multipliers (x axes). +, male; o, female.
In further analysis of the observed values and the values obtained by the linear regression, a difference caused by age was identified. When the regression model was applied to the 26 patients with congenital heart disease (mean age of 8.3 years), the estimate of β was 0.475.
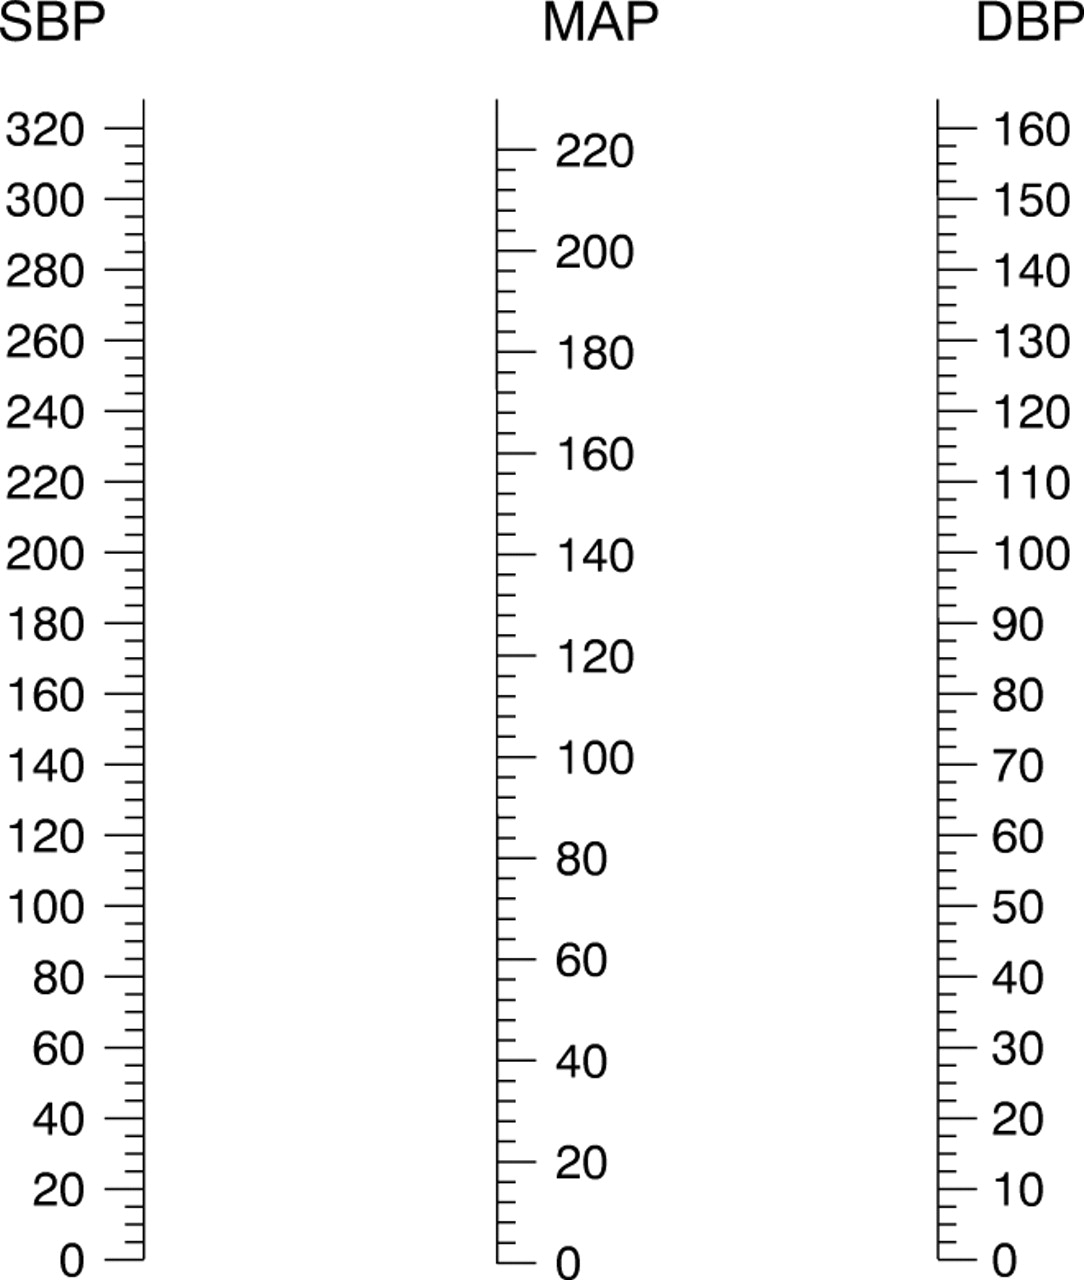
A nomogram for the estimation of MAP based on the systolic and diastolic arterial pressures was created and is shown in fig2.

Nomogram for the sphygmomanometric estimation of the mean arterial pressure (MAP). SBP, systolic blood pressure; DBP, diastolic blood pressure.
If the arterial pressure curve configuration were sinusoidal, the MAP would be exactly the pulse pressure divided by two. In other words, the functional MAP would be equivalent to the arithmetic one. Since the pressure curve configuration is not sinusoidal and the period of diastole is longer than the period of systole, the functional MAP is lower than half of the pulse pressure. Electronic damping of the signal was utilised as the standard since the integral of the pulse pressure over time is obtained directly with fluid filled catheters connected to a pressure transducer.
The purpose of the present manuscript was to provide a new multiplier for the pulse pressure that would provide a more accurate estimate of MAP. The new formula proposed is:
MAP = DP + 0.412 (SP − DP).
The new formula becomes more significant as the pulse pressure rises. For example, in a patient with an arterial blood pressure of 210/90 mm Hg, the estimated MAP would be 130 mm Hg using the traditional formula as compared to 139 mm Hg obtained with 0.412 as the multiplier. One of the clinical applications for using this new factor is in patients with uncontrolled hypertension, in whom an accurate estimation and follow up of the MAP is important to prevent decreases in cerebral blood flow.
An interesting finding was that in younger individuals the functional MAP is closer to the arithmetic one. An explanation could be that the arteries are more compliant and the arterial pressure curve has a more sinusoidal configuration. In prior studies, our group reported a decrease in aortic compliance of up to 65% in normotensive middle age subjects when compared to healthy normotensive young adults with a mean age of 27 years.5 ,6 Gevers and colleagues found that in neonates, MAP was best estimated by adding 46.6% of the pulse pressure to the diastolic pressure.7 This observation is close to the 47.5% that we found in patients with a mean age of 8.3 years.
A factor of 0.412 that multiplies the pulse pressure is more accurate than the traditional 0.333 for the calculation of mean arterial pressure. In young patients with congenital heart disease, a 0.475 multiplier appears to be the most precise.