Diagnostic accuracy studies: how to report and analyse inconclusive test results
BMJ 2013; 346 doi: https://doi.org/10.1136/bmj.f2778 (Published 16 May 2013) Cite this as: BMJ 2013;346:f2778
- Bethany Shinkins, DPhil student in primary healthcare,
- Matthew Thompson, clinical reader in primary healthcare,
- Susan Mallett, senior medical statistician,
- Rafael Perera, director of statistics
- 1University of Oxford, Department of Primary Care Health Sciences, Radcliffe Observatory Quarter, Oxford OX2 6GG, UK
- Correspondence to: B Shinkins bethany.shinkins{at}phc.ox.ac.uk
- Accepted 6 March 2013
The results of studies on diagnostic test accuracy are often reported as a 2×2 classification matrix, in which test results are presented as a dichotomy and a reference standard is used to categorise individuals as with or without disease. This facilitates the calculation of many popular statistics used to summarise the discriminatory performance of tests (such as sensitivity and specificity, positive and negative likelihood ratios, and positive and negative predictive values). Restricting test results to be either positive or negative, however, fails to represent the reality of how they are used in clinical practice1 ; in many cases, the results from a given diagnostic test do not exclusively fall into these “positive” and “negative” categories.
Although most test results provide useful information for diagnostic decision making, there is often a subset of results that are relatively uninformative and lead to an “inconclusive” diagnostic outcome. For example, the “normal” range on a standard biomarker is typically based on statistics that try to minimise the number of false classifications. As most biomarkers are far from perfect discriminators, however, results that fall close to the lower and upper limits of “normality” provide minimal information about the disease status of the patient and are therefore “inconclusive.” In most cases inconclusive test results require extra attention from clinicians, such as repeating the test or using more costly (in terms of invasiveness, time, and expense) diagnostic tools. All of these outcomes, coupled with the inevitable delay in diagnosis and clinical decision making, directly affect patient care.
In this paper we have focused on clinical scenarios in which there are two disease categories—disease present and disease absent—and discuss the reporting and analysis of inconclusive results produced by a single index test—that is, the diagnostic test under evaluation. Although this is a common scenario in research on diagnostic test accuracy, this is often a simplification of the actual clinical question. In practice, diagnostic tests are often used to distinguish between multiple diseases or different levels of severity, such as different staging in diagnosis of cancer. Additionally, the diagnostic process might involve a pathway of multiple tests rather than a single test.
Inconsistent reporting of inconclusive test results in research on diagnostic accuracy
We wanted to explore whether inconclusive results are consistently reported in diagnostic accuracy research. The STARD (STAndards for the Reporting of Diagnostic accuracy studies) statement—a reporting guideline encouraging high quality reporting of diagnostic accuracy studies—recommends that authors “report how indeterminate results, missing responses and outliers of the index tests are handled.”2 The full STARD guidance expands on this statement, advocating the reporting of “uninterpretable, indeterminate, and intermediate results” (item 22). We assessed systematic reviews to evaluate how well primary diagnostic accuracy studies adhere to this recommendation (box).
Adherence to STARD
Methods We searched Embase and Medline using the term “STARD” [All fields] to identify systematic reviews assessing adherence to the STARD statement.
Results Twenty two systematic reviews met the inclusion criteria, comprising 1156 primary diagnostic accuracy studies. Based on reported adherence in the systematic reviews, only 35% (400/1156) of diagnostic accuracy studies explicitly reported uninterpretable, indeterminate, intermediate, and missing results. There was a wide variation in adherence across systematic reviews (range 0-66%), indicating that there was inconsistency in the quality of reporting in different clinical areas and/or the reviewers’ interpretation of the STARD statement.
Conclusion Inconclusive results in diagnostic accuracy studies are not consistently reported, with around a third of studies fully complying with item 22 of the STARD statement (see appendix 1 and 2 for full details of methods and table of results).
Based on 1156 primary studies included in 22 systematic reviews (published between 2005 and 2011), we found that only a third (35%) of studies reported the presence or absence of inconclusive results adequately, showing that these results are not consistently reported in diagnostic accuracy research.3 4 5 6 7 8 9 10 11 12 13 14 15 16 17 18 19 20 21 22 23 24 The wide variation in the proportion of studies that were adherent between reviews could indicate that there was some reviewer subjectivity in the interpretation of the STARD item and how they defined adherence. As the reviews assessed studies based on all the STARD items (25 in total), there was little discussion by the authors about the specific criteria used to define “adherence” to each item, though most of the systematic reviews used more than one reviewer to assess reporting quality.
QUADAS—a tool for assessing the quality of diagnostic accuracy studies included in systematic reviews—asks reviewers to check that “uninterpretable, indeterminate or intermediate test results” are reported.25 In a recent evaluation of QUADAS, authors of Cochrane reviews reported that this recommendation was difficult to apply because of confusion about the applicability to particular diagnostic tests. They also noted important issues surrounding reliability between raters.26
These findings support the need to clarify the importance of inconclusive results and provide clear guidance to researchers on how to handle these results when reporting and analysing diagnostic accuracy studies.
Defining inconclusive results
Types of inconclusive test results
Simel and colleagues outlined three main types of “non-positive, non-negative” results27:
Uninterpretable results: those that “do not meet the minimum criteria constituting an adequate test”
Intermediate test results: those that “confer a likelihood ratio for disease that is more than that conferred by a negative result, but less than that of a positive test”
Indeterminate test results: those that add no additional diagnostic information to the original probability of disease. In technical terms, this is a test result with a likelihood ratio of about 1, meaning that knowledge of the test result does not alter the probability of disease.
In reported studies, however, the distinction between the different types of results is often lost, and the terms are used interchangeably—see, for example, the studies by Kamath and colleagues,28 Glaser and colleagues,29 and Ayad and colleagues.30 We have provided some clarity on methods for reporting and analysing inconclusive index test results in diagnostic accuracy studies. To facilitate this, we firstly differentiated between inconclusive results that are invalid (that is, the key diagnostic feature is uninterpretable or the actual result is missing) and those that are valid (that is, where an adequate test result has been obtained, but the result is not clearly positive or negative). This distinction affects how inconclusive test results should be reported and analysed (fig 1⇓).

Fig 1 Flowchart of index test results distinguishing between valid and invalid inconclusive index test results
Invalid inconclusive results
Uninterpretable and missing index test results
A test result is “uninterpretable” when the key diagnostic feature of the result is either missing, obstructed, or of questionable validity because of an inadequate test procedure (table 1⇓ shows some clinical examples). In some cases, uninterpretable results occur because the test was not conducted to an acceptable standard (such as a cervical smear test carried out with poor sampling technique or a contaminated urine culture), and in others it could be because a clinical feature of the patient hampers the interpretation of the test (such as an uninterpretable cervical smear because of concurrent infection or a retrocaecally positioned appendix resulting in difficult visualisation on ultrasonography). Invalid inconclusive test results are caused by an intrinsic property of the test (an objective quality) rather than the relative importance of false positive and false negative results. In contrast, missing results occur when a patient should have been included in a study but no test result is recorded. Missing results are often handled in a similar way to uninterpretable results.
Clinical examples of uninterpretable results
In the presence of uninterpretable and missing results, it is vital to consider the underlying reasons.32 If the occurrence of the result is not influenced by the presence or absence of disease, such as the accidental contamination of a urine culture with skin bacteria, then the test can often simply be repeated. In some cases, however, the presence of an uninterpretable result can be informative—it increases or decreases the probability of disease—despite not being categorised as a positive or negative result.32 For example, by exploring the possible causes of uninterpretable results in the evaluation of the accuracy of two dimensional transthoracic echocardiography for determining aortic valve structure, Ayad and colleagues identified a relation between the valve weight (from calcification) and whether the image could be interpreted.30
Valid inconclusive results
The ways in which valid inconclusive results should be reported and analysed depends on the measurement scale of the test: results can be continuous, categorical, or ordinal in nature.
Continuous inconclusive index test results
Inconclusive results can occur for index tests measured on a continuous test scale (such as biochemical assays) (table 2⇓ gives examples). They typically lie in the range of values where the distributions of abnormal values and normal values overlap (fig 2⇓), although the degree to which they encompass this region of uncertainty depends on the relative implications of false positive and false negative test outcomes. These results are valid index test results, and the same result should be obtained if the test is repeated (putting aside random measurement error and temporal changes).
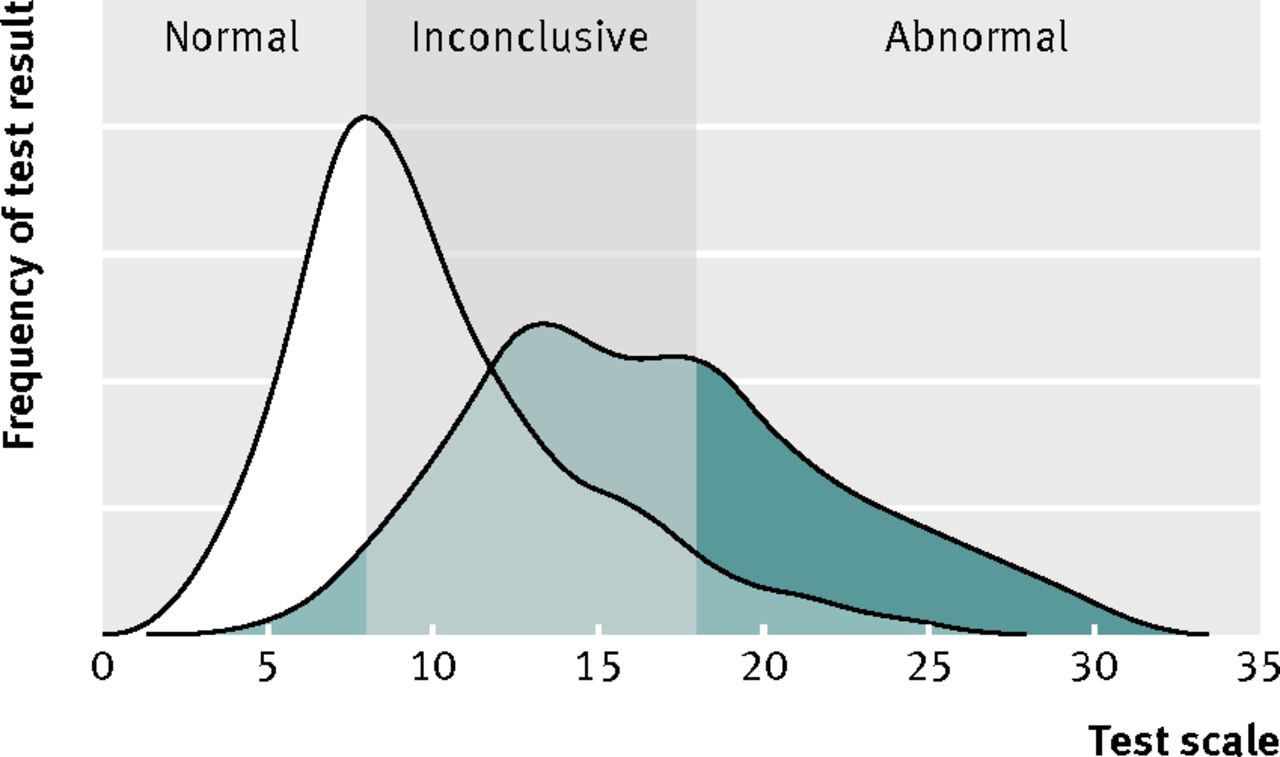
Fig 2 Inconclusive range for continuous test where two underlying distributions of test results overlap
Clinical examples of continuous inconclusive index test results
Categorical/ordinal inconclusive index test results
Inconclusive results can also occur when test results are categorised into groups according to characteristics rather than continuous values. For categorical tests, inconclusive results can occur when some results cannot be placed in either the positive or negative categories (table 3⇓ gives examples). For ordinal tests (such as symptom scores), there are often multiple ordered categories of result, where the middle category/categories do not provide sufficient evidence regarding the presence or absence of disease. As with a continuous inconclusive result, categorical and ordinal inconclusive results are valid test outcomes, and repeating the test should produce another inconclusive result (barring variability within the patient and progression of disease over time).
Clinical examples of categorical and ordinal inconclusive index test results
How to report inconclusive results
Valid inconclusive results
To improve reporting of inconclusive results, the standard 2×2 classification matrix can be extended to a 3×2 matrix.1 27 Simel and colleagues proposed that intermediate, indeterminate, and uninterpretable results should be grouped together to form a row of “uncertain” or “inconclusive” results.27 We propose that the classification table should be limited to valid test results (table 4⇓).
Proposed 3×2 classification table, with allowance for reporting of valid inconclusive test results
Continuous inconclusive test results
For index tests on a continuous test scale, “rule in” and “rule out” thresholds can be selected, leaving a range of valid inconclusive test values.39 In some cases, a richer interpretation of accuracy is required and the test scale is partitioned into multiple (more than three) categories. Either way, the number of patients with positive and negative test results for a disease in each category should be cross tabulated, with extra rows to account for any additional categories. A full description of how and when thresholds have been selected should be included in the methods section.
In addition to the classification table, it is essential to show the distribution of the raw test results, stratified by disease status (determined by the reference standard). Possible graphical options include paired histograms, dot plots, or cumulative distribution graphs. Addition of the thresholds and colour coding to plots can help readers understand where cut offs have been placed (fig 3⇓).

Fig 3 Dot plot for continuous index test with thresholds (hypothetical data)
Categorical/ordinal inconclusive test results
For categorical and ordinal index tests, the number of patients in each category should be reported and broken down by presence or absence of the target condition. For ordinal tests with a large number of categories (such as questionnaire scores), it might be sensible to group some of the categories for the classification table. If this is the case, it is still important to report a cross tabulation or plot of the frequencies in each original category and explain how the category groupings were determined.
Invalid inconclusive results
Reporting uninterpretable and missing inconclusive test results
Although uninterpretable and missing results are often not directly related to test accuracy, they are still an essential consideration in the evaluation of the overall clinical utility of the test. Uninterpretable and missing results should be reported separately from the cross tabulation of valid results by disease status, in addition to any known underlying causes, so that the reader can assess whether they hold any diagnostic value. Clear reporting and discussion of whether these results are related to the patient’s disease status, the presence of an alternative target condition, or assumed to be unrelated to patient health enables transparency in how these results should be handled.
The STARD statement recommends that a flowchart of participants at each stage of the study is reported.2 Inclusion of all inconclusive results in this chart greatly enhances the transparency of test performance (see fig 4⇓ for an example). The number of participants meeting the eligibility criteria (intention to diagnose) should feature in the flow diagram. Supplementary information such as the causes of uninterpretable or missing results should be reported separately.

Fig 4 Example flowchart for reporting results from diagnostic accuracy study of quantitative index test (hypothetical data)
How to analyse inconclusive test results
Inconclusive results can be difficult to analyse given that many statistics used to summarise the accuracy of diagnostic tests require the test results to be split into two groups. There is no single “optimal” approach to analysing inconclusive results; diagnostic accuracy should always be analysed in line with how the test will be used in clinical practice.
When exploring different testing strategies for the diagnosis of bladder cancer, Blick and colleagues reported both invalid (uninterpretable) and valid inconclusive results from computed tomography urography.40 They excluded from the analyses the uninterpretable results that were caused by technical failures (five of 747) as they were found to be unrelated to disease status, but the causes and frequencies of these technical failures were still fully reported. If the occurrence of uninterpretable results had been found to be associated with the presence or absence of bladder cancer, exclusion of these results might not have been appropriate.
For valid inconclusive results, there are three common approaches to analysing categorical and ordinal inconclusive results. To illustrate these methods, we have used results from Blick’s study assessing the accuracy of computed tomography (CT) urography for diagnosing bladder cancer (table 5⇓).40 It is important to note that, although not reported in this section for brevity, confidence intervals are a vital consideration in the interpretation of accuracy statistics. Methods for analysis of tests on continuous scales with valid inconclusive results are discussed at the end of this section.
Classification table of CT urography results40
Scenario 1: Exclude valid inconclusive results completely
An unfortunately common approach to dealing with this type of valid but inconclusive result is to exclude them completely from all analyses.27 There are few instances where this can be justified, and this approach can lead to overstated summary statistics and promotion of suboptimal test strategies.
For the CT urography data,40 if the valid inconclusive results (15% of patient data) had simply been excluded this would have resulted in a sensitivity and specificity of 94% and 100% and a positive and negative predictive value of 99% and 98%, respectively. This would have artificially inflated the accuracy of the test to near perfect accuracy, resulting in flawed interpretation.
Scenario 2: Exclude valid inconclusive results from binary statistics but report an additional summary statistic that accounts for them
Another method is to exclude valid inconclusive results from accuracy statistics such as sensitivity and specificity, but report an additional statistic that takes into account the presence of inconclusive results.
One example is the percentage of the test results included in the calculation of the binary summary statistics, often referred to as the “test yield.”27 If the test yield is much below 100%, then the reader should be aware that test results have been excluded. In the bladder cancer study, the “test yield” statistic would have been 85% if the 111 valid inconclusive results had been wrongly excluded.
An alternative is to provide the number of correct classifications as a percentage of the total number of test results (including valid inconclusive test results), known as “effectiveness.”41 If the percentage of valid inconclusive results is large, the effectiveness of the test will provide a more conservative estimate than the commonly used but flawed “accuracy” statistic that excludes inconclusive results. The “effectiveness” of CT urography in the bladder cancer example including valid inconclusive results is 84%, compared with 99% if the inconclusive results are excluded.
The risk of simply providing an additional statistic to account for inconclusive results is that readers might struggle to interpret such unfamiliar statistics and interpret only the more popular accuracy measures, such as sensitivity and specificity. Furthermore, these additional statistics are not typically included in meta-analyses, where usually only the sensitivity and specificity are analysed.
Scenario 3: Group valid inconclusive results with positive or negative results
One way of overcoming the issue of analysing valid inconclusive results is to group them with either the positive or negative results, depending on how these patients would be treated in the clinical context. In their evaluation of different roles for CT urography in diagnosis of bladder cancer, Blick and colleagues assessed accuracy of CT urography as a replacement test for flexible cystoscopy. In this context, because of the high clinical cost of missing a cancer diagnosis, inconclusive CT urography results should be grouped with positive results, as clinically these patients would still have to undergo rigid cystoscopy.40 As a replacement test, CT urography has a sensitivity and specificity of 95% and 83% and a positive and negative predictive value of 58% and 98%, respectively. The positive predictive value is notably lower when valid inconclusive results are included in the analyses (58% v 99%), which gives a much more realistic representation of the true accuracy of the test.
Grouping valid inconclusive results with either the positive or negative test results can cause considerable differences in the summaries of test performance.27 32 42 Often this is reported as a secondary (or sensitivity) analysis. Subhas and colleagues adopted this approach when they assessed the accuracy of magnetic resonance imaging to diagnose meniscal tears,43 showing that the specificity of the five point grading scale dropped from 94% to 47% depending on which grades were considered positive. This makes the discriminatory performance of the test completely transparent to the reader.
Analysis of continuous inconclusive test results
Any categorisation of a continuous test scale results in a loss of information.44 45 The dichotomisation of continuous test scales, however, has become commonplace to make it easier for clinicians to interpret test results in the context of the clinical problem. For multivariate diagnostic prediction models, it has been strongly argued that the categorisation of continuous test scales (which are included as predictors in the model) is simply a waste of information because the predicted probability of disease is the key diagnostic outcome.45 For the interpretation of results from a single continuous diagnostic test, however, some categorisation is usually helpful.
Several studies have found that moving away from the dichotomous partition of quantitative test scales and identifying intermediate range(s) of test results has enabled a better understanding of the diagnostic accuracy potential of a test.34 46 Multi-level or stratum specific likelihood ratios have been proposed as a preferable way of summarising the performance of tests on a quantitative test scale. Allowance for multiple ranges of a test result retains more diagnostic information,38 47 48 49 and the results are less susceptible to spectrum bias.50
Conclusion
Reporting and analysis of inconclusive test results have been relatively neglected in diagnostic accuracy studies. We encourage researchers and clinicians to clearly report all inconclusive results, broken down by the reference standard when possible. Complete transparency regarding the handling of inconclusive results in the analysis phase is essential for the reader to understand how key summary statistics have been derived. A well reported diagnostic accuracy study will allow readers to fully understand if and how inconclusive results were incorporated into analyses and provide them with sufficient information to recalculate key statistics if they disagree with the approach adopted by the author.
Summary points
Reporting tips
Report the causes and frequencies of any uninterpretable or missing results, broken down by the reference standard
Report all valid inconclusive results on their original scale (that is, before any grouping of results), again broken down by the reference standard
For tests of a continuous scale or an ordinal scale with lots of categories, plots should be used
Analysis tips
The accuracy of an index test should be analysed in line with how the test will be used in clinical practice
If valid inconclusive results are excluded from analyses, accuracy statistics should be reported when the inconclusive results are included as a secondary (sensitivity) analysis
Notes
Cite this as: BMJ 2013;346:f2778
Footnotes
We thank Johannes Reitsma, who reviewed our first manuscript, which contributed extensively to the format and content of the final paper. We also thank Richard Mayon-White for his guidance in developing the ideas underlying this paper.
Contributors: BS initiated the study as part of her DPhil project. All co-authors contributed to the drafting of the manuscript. BS is guarantor.
Funding: BS is funded by the National School for Primary Care Research Capacity Building Award. MT, RP, and SM receive funding by the National Institute for Health Research (NIHR) under its programme grants for applied research funding scheme (RP-PG-0407-10347 and RP-PG-0407-10338). This paper presents independent research funded by the National Institute for Health Research (NIHR). The views expressed in this paper are those of the authors and not necessarily those of the NHS, the NIHR or the Department of Health
Competing interests: All authors have completed the ICMJE uniform disclosure form at www.icmje.org/coi_disclosure.pdf (available on request from the corresponding author) and declare: no support from any organisation for the submitted work; no financial relationships with any organisations that might have an interest in the submitted work in the previous three years; no other relationships or activities that could appear to have influenced the submitted work.
Provenance and peer review: Not commissioned; externally peer reviewed.