Article Text

Abstract
Aims: To examine whether variations in pathology test requesting between different general practices can be accounted for by sociodemographic or other descriptive indicators of the practice.
Method: This was a comparative analysis of requesting patterns across a range of pathology tests representing 95% of those requested in general practice, in 22 general practices in a single district, serving a population of 165 000. Spearman correlation coefficients were calculated and both the top and bottom fifths of activity were displayed graphically to detect trends at the extremes of the ranges.
Results: The proportion of women of childbearing age, median practice Townsend scores, or the existence of specialist miniclinics within the practice did not have a demonstrable impact on requesting patterns. A weak correlation was found between the proportion of elderly patients and creatinine/electrolyte testing but not for the other two tests examined for this patient group.
Conclusions: The large differences observed in general practice pathology requesting probably result mostly from individual variation in clinical practice and are therefore potentially amenable to change.
- patient demographics
- appropriateness
- clinical governance
- Townsend score
- FSH, follicle stimulating hormone
- HbA1c, glycated haemoglobin
Statistics from Altmetric.com
A lthough the relation between sociodemographic parameters, morbidity rates, and the use of medical services on a large scale is well established,1,2 we are not aware of similar reports for the use of pathology services, either on a broad population basis or within individual health localities. Clinical practice is often assumed to account for differences in the use of pathology tests, but there is little published evidence to support this.
Recently, we have published details of a simple model that may be used to monitor test requesting activity in general practice across different tests in pathology.3 This model produced stable results over time, and showed considerable differences between the test requesting activity of 22 general practices. In a context of primary care groups being able to use this type of model in a clinical governance setting, it is important to exclude potential confounding variables that could explain these differences, to provide credibility for any intervention designed to change practice.
“Clinical practice is often assumed to account for differences in the use of pathology tests, but there is little published evidence to support this”
To examine whether these variations could be explained by differences in the general practices themselves, or in the general practice catchment area, we have considered several individual factors in the cohort of 22 general practices studied.
We had previously shown that adjusting the overall rankings of requesting numbers for age and sex to produce standardised requesting ratios for each practice did not alter the unadjusted rankings of request activity.3 However, most practices in these distributions lie within a broad modal band of requesting, and it is possible that age and sex adjustment of overall activities may not detect particular extremes of activity for certain tests. Therefore, we set out to examine the influence of differences in specific patient groups or general practice types on test requesting patterns for particular tests.
METHODS
Test requesting data were obtained for 28 tests and 22 general practices as described previously.3 The regional office of the Northern and Yorkshire National Health Service Executive provided a detailed breakdown of the age and sex of patients on the individual practice lists at the start of the study, together with the overall practice list sizes and numbers of general practitioners working at the practice. Electoral ward based Townsend scores for the general practice catchment area were also obtained from the regional office. The numbers of tests requested by each practice in a defined period were divided by practice list size to yield a test activity rate.
The following areas were examined:
-
We obtained the percentages of women in different age bands in the practices, and calculated correlation coefficients between proportions of (i) women between 15 and 45 and (ii) all patients over 65 years old and over 75 years old, and activity rates for selected pathology tests.
-
We compared the four practices containing the greatest number of general practitioners (seven or more) with the four practices with a single handed practitioner, to test the hypothesis that practices with more partners may not exhibit extremes of requesting activity because of the diluting effect of multiple general practitioner partners.
-
Correlation coefficients between the median practice Townsend scores and requesting activities for a range of tests were calculated to explore the relations between activity and a unified index of deprivation.
-
Test request numbers in tests relating to fields in which general practitioners' practices may have specialist miniclinics (for example, diabetes, well man/coronary prevention, menopause/hormone replacement therapy) were compared with those practices that did not have such clinics. The existence of these clinics was determined by a short questionnaire sent to each practice. All those who did not return their questionnaire were contacted by telephone.
Tests were selected in these different categories on the basis of those considered most likely to be influenced by the variable concerned—that is, (a) age: glucose, creatinine/electrolytes, full blood count; (b) sex: follicle stimulating hormone (FSH), vaginal swab; (c) Townsend score (general use indicators): glucose, creatinine/electrolytes, full blood count; (d) number of general practitioners in practice (general use indicators): glucose, creatinine/electrolytes, full blood count; and (e) miniclinics: glycated haemoglobin (HbA1c) and microalbumin measurement for diabetes, FSH for menopause, and cholesterol for well man/coronary prevention clinics, respectively.
Statistical analysis
Because test activity distributions are skewed,3 we calculated Spearman rank correlation coefficients between activities and continuous patient or practice variables.
Display of results
Different practice populations (proportion of “over 65” patients, single handed versus multiple partner practice, those with or without different specialist miniclinics, etc) were displayed graphically on the original request distribution histograms. The highest and lowest fifths (the top and bottom four practices) for each quantitative variable tested, and numbers for discontinuous variables, were then examined to determine whether any clusters of high or low activity practices could be identified in the absence of a correlation within the entire practice group. These results are presented descriptively.
RESULTS
The oldest (75+) age range constituted a relatively small percentage group (mean, 7.5% of list). Therefore, we combined the 65–74 and 75+ age groups (table 1) to produce a single “older patient” group. This had a minimal effect on the distribution of activity rankings between the practices but produced a larger and more meaningful number of patients in the older age band, which might be expected to be associated with higher test requesting.
Percentage patient distribution by age and sex (percentage of women aged 15–44) in 22 general practices in South West Durham
The percentage distributions of “over 65” patients and women in the 15–44 age group in each practice are shown in table 1. These followed a near normal distribution within the different age groups (mean, 17.0%; median, 16.7% for over 65 group; 38.6% and 38.5%, respectively, for 15–44 year old women).
Age distribution
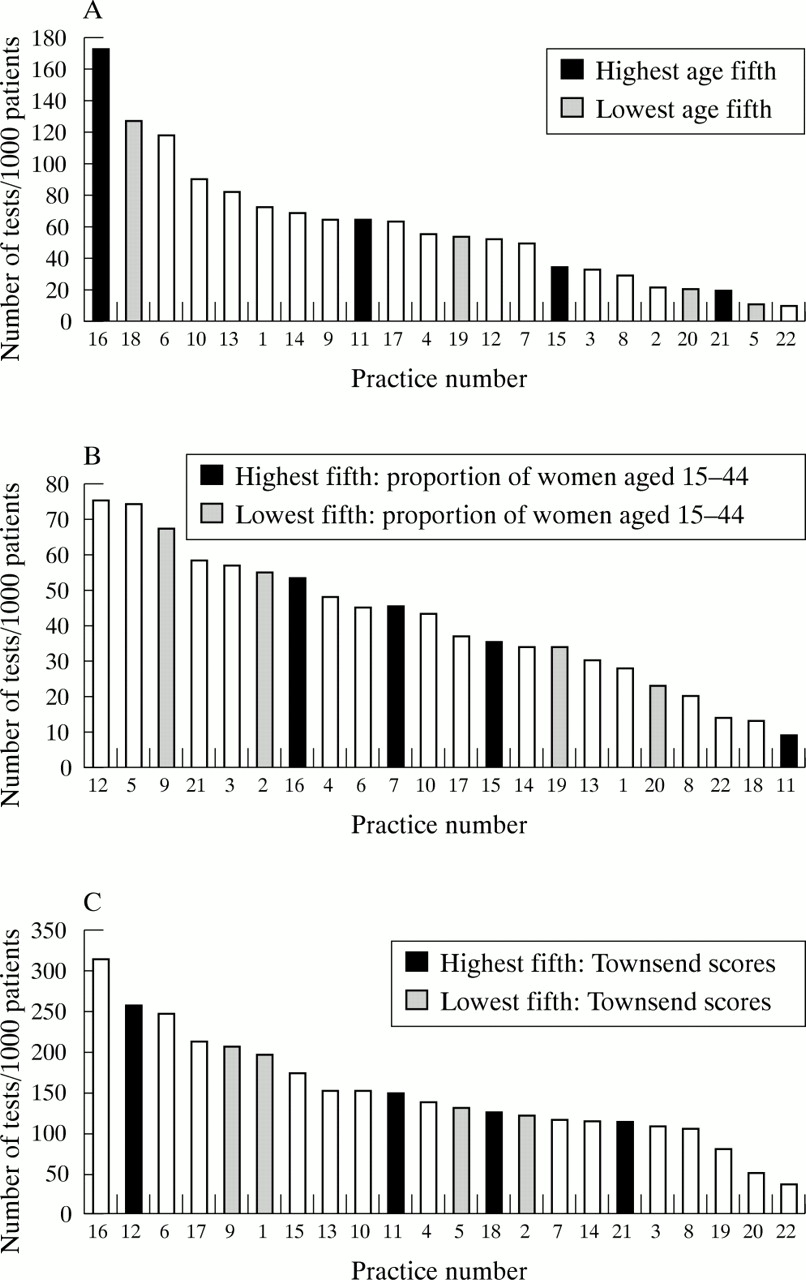
We then examined three tests for which differences in proportions of older patients would be expected to be reflected in test requesting (glucose, r = 0.10, p = 0.65; creatinine/electrolytes, r = 0.61, p = 0.005; and full blood count, r = 0.18, p = 0.42). The practices in the top and bottom fifths for percentage over 65 age group patients are shown in fig 1A for glucose and are positioned throughout the activity distribution. The distributions were similar for the other two tests.
Standardised requesting activity histograms showing upper and lower fifths of practices by (A) proportions of patients aged 65 or over for blood glucose requests, (B) proportion of women aged 15–44 as a percentage of total list size for vaginal swab analysis, and (C) Townsend deprivation scores for creatinine/electrolyte requests, in a cohort of 22 general practices serving a population of 165 000 patients.
Sex distribution
The percentages of women between the ages of 15 and 44 on the practice list were correlated against FSH and vaginal microbiology requesting activity (r = 0.24, p = 0.26 and r = 0.09, p = 0.70, respectively). Practices in the upper and lower fifths of practices (percentages of women in this age band) were distributed evenly across the activity distributions (fig 1B).
Townsend scores
Spearman correlation coefficients between median Townsend score and test request activity were 0.34 (p = 0.11) for creatinine/electrolytes, 0.37 (p = 0.09) for glucose, and 0.02 (p = 0.94) for full blood count. Figure 1C shows the activity distribution for creatinine/electrolytes, which does not reveal any separation of upper and lower fifths. Distributions for the other two tests (glucose and full blood count) were similar, although three of the four practices with the highest Townsend scores (least deprivation) were located in the top two fifths of requesting practices for full blood count.
Number of general practitioners in practice
The number of general practitioners in the different practices ranged from one (four practices) to seven or more (four practices). A graphical display of the top and bottom activity fifths (single handed practitioners versus seven or more practitioners) revealed similar distributions for three high volume tests examined (glucose, creatinine/electrolytes, and full blood count; data not shown). The practices were spread out across the activity distributions.
Specialist miniclinics
Eighteen of the 22 surgeries returned their questionnaire. Information was obtained from the other four by telephone. Seventeen of the 22 reported that they had a dedicated diabetes clinic. Of the five who did not, for HbA1c activity, four of the five were located in the lower half of the activity distribution, although three of the five were in the upper half of the activity distribution for urinary microalbumin requests.
For menopause or hormone replacement therapy clinics, only two practices had a dedicated clinic (second and 13th in requesting activity for gonadotrophins out of the 22 practices). Eight practices had no well man coronary prevention clinic. Three of these eight practices were clustered in the lowest fifth of cholesterol test activity, although the remainder were spread across the activity rate distribution.
DISCUSSION
We have previously demonstrated that test requesting by general practices varies by a median factor of 700% between the highest requesting and lowest requesting deciles in a cohort of 22 practices.3 We have examined several key factors relating to the practices and patients on their list to determine whether any of these factors are likely to be responsible for part or all of this difference.
We have found that the proportion of over 65 year old patients, the proportion of 15–44 year old women on the practice list, the number of general practitioners in the practice, and the Townsend score appear to have little impact on requesting for a predetermined selection of pathology tests, which had been specifically chosen to be able to identify any such trends. The presence or absence of a specialist clinic also did not appear to identify low or high users of related tests. The one significant finding between the proportion of elderly patients and activity rankings for creatinine/electrolytes is a relatively weak correlation, which would explain only a small part of the variation, and was not mirrored by similar trends in the other two tests examined for this group. This finding remains just within the 5% significance level if the Bonferroni correction is applied to discount the eight correlations that were performed.4 Similarly, the occasional qualitative findings of some of the practices in the upper or lower fifths for age or Townsend score or those with a well man clinic within the upper or lower ends of the activity distributions for certain tests were clinically contradictory or did not occur for other tests in the group. This occasional clustering is not surprising in view of the number of activity distributions examined (27 in total). The only possible relation identified was that some practices with no well man clinic appear to perform fewer cholesterol tests. This again is not surprising and probably results from a difference in clinical practice.
Take home messages
-
The large differences observed in general practice pathology requesting probably result mostly from individual variation in clinical practice
-
Thus, peer review within the clinical governance framework of the primary care groups has the potential to modulate requesting, improve appropriateness, and target available resources more effectively, given suitable means of intervention
“We cannot necessarily extrapolate the findings for this cohort of 22 practices to other general practice cohorts”
In the absence of other explanations, we interpret these findings as suggesting that differences between general practice test requesting patterns are accountable by clinical practice of general practitioners. Obtaining direct evidence that this is the case would raise considerable experimental problems, although we can however exclude a major contribution from several potential variables that could explain the differences, within this district.
We cannot necessarily extrapolate the findings for this cohort of 22 practices to other general practice cohorts, and it is possible that clearer links between the factors we have considered and the use of pathology services may exist on a national basis. For a cohort of general practices within one catchment area however, it provides a powerful argument supporting the view that individual clinical requesting practices vary considerably. This in turn implies that peer review within the clinical governance framework of the primary care groups has the potential to modulate requesting, improve appropriateness, and target available resources more effectively, given suitable means of intervention. In many cases this may involve reducing apparently excessive use of some tests by specific practices, with associated cost savings, although in others the need may be to encourage increased use of underused tests by some practices. The potential return is one of reducing inequality of care and improving overall use of hospital pathology services.
Acknowledgments
Thanks to Miss L Mulligan for help in setting up the databases, and Mrs S Richardson for help in preparing this manuscript. This work was carried out with the assistance of a grant from the Bishop Auckland General Hospital Audit Committee.