Article Text

Abstract
Background: In the Joint United Nations Programme on HIV/AIDS (UNAIDS) approach to HIV and AIDS estimates, estimates of adult prevalence produced by the Estimation and Projection Package (EPP) or the Workbook are transferred to Spectrum to estimate the consequences of the HIV/AIDS epidemic, including the number of people living with HIV by age and sex, new infections, AIDS deaths, AIDS orphans, treatment needs, and the impact of treatment on survival.
Methods: The UNAIDS Reference Group on Estimates, Models and Projections recommends updates to the methodology and assumptions based on the latest research findings and international policy and programme guidelines. The latest update to Spectrum has been used in the 2005 round of global estimates.
Results: Several new features have been added to Spectrum in the past two years. New patterns of the age distribution of prevalence over time are based on the latest survey data. A more detailed treatment of mother to child transmission of HIV is now based on information about current breastfeeding practices, treatment options offered to prevent mother to child transmission (PMTCT), infant feeding options, and the percentage or number of pregnant women accessing PMTCT services. A new section on child survival includes the effects of cotrimoxazole and ART on child survival. Projections can now be calibrated with national survey data. A new set of outputs is provided for all adults over the age of 15 in addition to the traditional 15–49 age group. New outputs are now available to show plausibility bounds and regional estimates for key indicators.
Conclusions: The latest update to the Spectrum program is intended to incorporate the latest research findings and provide new outputs needed by national and international planners.
- EPP, Estimation and Projection Package
- FHI, Family Health International
- PMTCT, prevention of mother to child transmission
- PSI, Population Services International
- UNAIDS, Joint United Nations Programme on HIV/AIDS
- HIV
- modelling
- AIDS
- estimates
Statistics from Altmetric.com
- EPP, Estimation and Projection Package
- FHI, Family Health International
- PMTCT, prevention of mother to child transmission
- PSI, Population Services International
- UNAIDS, Joint United Nations Programme on HIV/AIDS
Projections of adult HIV prevalence are prepared using the Estimation and Projection Package (EPP)1 for generalised epidemics and the Workbook for low level and concentrated epidemics.2 The Spectrum projection package is used to determine the consequences of the prevalence projections, including estimating the number of people living with HIV by age and sex, new infections, AIDS deaths, AIDS orphans, the need for treatment, and the impact of treatment. Other demographic indicators of interest, such as life expectancy and under-five mortality, are also estimated. A description of the methods used to make these estimates has been published previously.3 The purpose of this paper is to describe the updates to Spectrum made in the last two years and used in the 2005 global estimates of HIV and AIDS.
Spectrum is a modular program that is used to examine the consequences of current trends and future programme interventions in reproductive health. The program and manuals are updated regularly and available in multiple languages free of charge from the website of the Futures Group at http://www.FuturesGroup.com. Model development has been funded primarily by USAID with technical collaboration from the Joint United Nations Programme on HIV/AIDS (UNAIDS), the World Health Organization (WHO), the United Nations Children’s Fund (UNICEF), UN Population Division, US Bureau of the Census, the United Nations Population Fund (UNFPA), and other organisations. Spectrum contains a full features demographic cohort component projection model. Input information for the base year and entire projection period can be entered directly or automatically drawn from a database containing information for all countries and regions of the world provided by the United National Population Division based on its global demographic estimates.4 The HIV/AIDS projections start with estimates of adult prevalence over time that have been produced using EPP or the Workbook models described elsewhere in this issue. Spectrum estimates the other HIV/AIDS indicators of interest such as the number of people infected with HIV, new infections, AIDS deaths, and orphans. A full description of the methodology is provided in the manual for the AIDS module of Spectrum (AIM)5 This paper focuses on several enhancements made during the last two years.
AGE AND SEX DISTRIBUTION OF HIV
Adult HIV prevalence trends estimated by EPP or the Workbook refer to the percentage of adults aged 15–49 infected with HIV. For use in Spectrum these infections need to be distributed by age and sex. In the past three years a number of national surveys6 have provided information on HIV prevalence by age for women aged 15–49 and men aged 15–59.
Adult HIV prevalence is disaggregated into female and male prevalence by specifying the ratio of female to male prevalence. We assume that the ratio is much less than one at the beginning of the epidemic but increases to greater than one for generalised epidemics about 10 years into the epidemic. Previously we assumed that the ratio reached a plateau of 1.3 by year 10. The new population based surveys provide direct measures of this ratio for 13 countries with generalised epidemics. The results show a wide variation in the sex ratio of prevalence from just below one in Burkina Faso to over two in Guinea and Senegal. These data are shown in figure 1 along with 95% confidence limits for those surveys that have reported limits. For countries with national surveys we use those ratios. For countries without surveys we now assume that the ratio will plateau at 1.5.
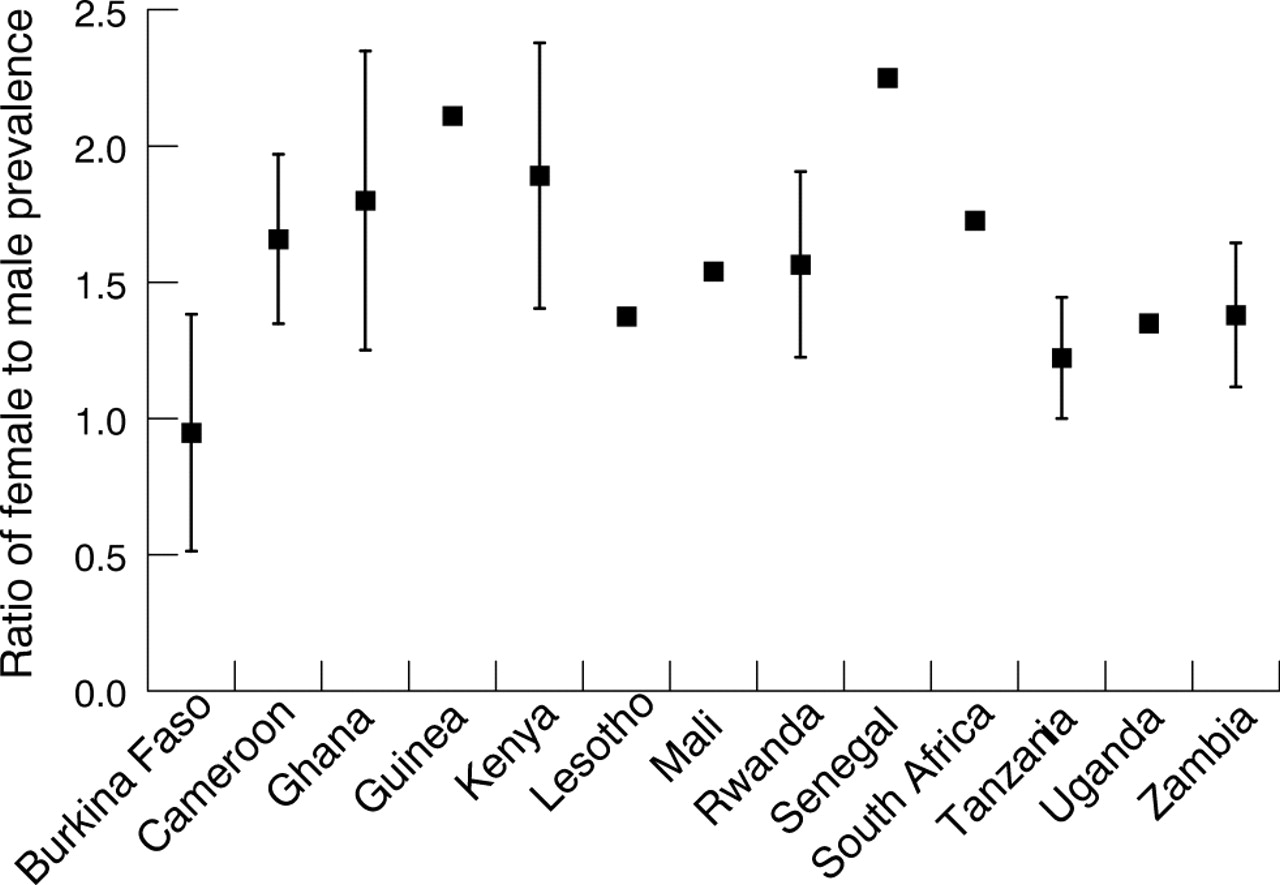
Ratio of female to male HIV prevalence from national surveys with 95% confidence limits where available.
These surveys provide a snapshot for a single year but it is unlikely that age patterns remain constant over time due to saturation effects in higher risk age groups, aging of those infected with HIV, and likely changes in sexual behaviour. We therefore examined the changing pattern of HIV prevalence and incidence by age in a simple model where the risk (or force) of infection depends on age, but does not vary over time. Mortality among those infected with HIV is described by a Weibull distribution following the best estimate of UNAIDS.7 The overall level of incidence over time is adjusted to match estimated adult prevalence for the period 1990–2003 and the constant pattern of force of infection by age is adjusted to reproduce the age specific prevalence pattern in the year of the national survey. The result is a changing pattern of prevalence by age and sex over the course of the epidemic. The model was fit to data from Burkina Faso, Ghana, Kenya, Mali, Tanzania, and Zambia.
This model captures the saturation of infection among the higher risk age groups (15–24 year olds), and the aging of those infected, and describes the increases in the mean age of incident and prevalent infections typically observed during the course of a generalised HIV epidemic. Changes in the prevalence of infection by age are comparable to available longitudinal data.8,9,10 However, the empirical data typically support a somewhat greater reduction in incidence among younger age groups (15–24 year olds), probably due to changes in sexual behaviour, but also more subtle saturation effects and non-random sexual mixing by age. The lack of data and difficulty in capturing these more subtle effects led to the choice of the simple model patterns as the basis of the temporal change in the age pattern of HIV prevalence used by Spectrum for generalised epidemics. In figure 2A and B these patterns (normalised for comparison) show the ratio of prevalence at any age to prevalence at age 25–29. The patterns refer to the time since the start of the epidemic and, therefore, are adjusted for each country depending on the start year of the epidemic.

Pattern of prevalence by age over time, expressed as the ratio of prevalence in each age group to prevalence in the 25–29 age group by years since the start of the epidemic. (A) Females in generalised epidemics; (B) males in generalised epidemics; (C) females in low level and concentrated epidemics; (D) males in low level and concentrated epidemics.
If a country has a national survey the information on prevalence by age and sex from that survey is used to adjust the default patterns to match the actual pattern in the survey year. The adjustment is made by multiplying each curve by the ratio of the actual value in the survey year to the default value for that year. This has the effect of shifting all curves up or down to match the survey pattern.
For low level and concentrated epidemics no national prevalence surveys are currently available. Instead we examined data on the distribution by age of populations at higher risk collected as part of behavioural surveillance surveys and provided to the UNAIDS Reference Group by Family Health International (FHI) and Population Services International (PSI). These surveys do not collect information on HIV prevalence but do indicate the age distribution of most at-risk populations. Table 1 shows the countries and population groups for which data were available.
Countries with information on the age distribution of high risk populations, by type of risk group
When surveys for multiple sites within a country were available we calculated a simple average without weighting to get a single national pattern. These national patterns were averaged across all countries within each population group to estimate the average age distribution of the population within each risk group. These age distributions were weighted by the number of HIV infected people in each risk group to calculate an average age distribution for the entire HIV+ population. National estimates of the number of infected people by risk group for these countries were aggregated to determine an overall average for countries in Asia and in Latin America and the Caribbean. These percentages were used to weight the age distributions described above. For the general population the age distributions from generalised epidemics were used. We assume that changes in these patterns over time will occur in a similar manner to the generalised epidemics as the HIV+ populations age. The results are shown in figure 2C and D.
CHILD SURVIVAL
Child survival with HIV is modeled as the proportion of children infected at birth who survive to each future age. Previously we assumed that no child HIV infected at birth would survive beyond their fifteenth birthday. However recent unpublished evidence suggests that some children infected at birth will survive longer.
The net survival of children from HIV is represented by a double Weibull curve fitted to longitudinal data.11 The first component represents the fast progressors, those infected in utero, peripartum, and intrapartum; the second component represents the slow progressors, those infected during breastfeeding.
The updated curve makes the assumption that the “slow progressors” follow a pattern of survival similar to that of adults, allowing for the observed trend of improved survival at younger ages of infection.12 A rough extrapolation of this trend suggests that the slow progressors would have a median survival from birth of 14 years.12,13 A Weibull function based on the adult pattern but with a median survival age of 14 years was used to extend the empirical data series beyond age 7 to allow a double Weibull to be fitted.
The resulting curve implies that 38% of children are slow progressors and the overall curve has an infant mortality rate of 355 per thousand, under five mortality rate of 616 per 1000, and a cumulated mortality at age 15 of 83%.
MOTHER TO CHILD TRANSMISSION
HIV can be transmitted from HIV+ mothers to their babies during gestation, delivery, or after birth through breastfeeding. Previous versions of Spectrum used a constant rate of transmission of 32%. Now that programmes to prevent mother to child transmission (PMTCT) are expanding in many countries, a more complete description of the factors affecting transmission is required.
The probability of transmission depends on the treatment option and breastfeeding practices. The average duration of breastfeeding in the general population determines the transmission rate for women receiving no treatment. For those receiving treatment different breastfeeding patterns can affect the transmission rate. To implement these calculations in Spectrum the user specifies (1) the duration of breastfeeding in the general population, (2) the percent or number of women accessing PMTCT programmes, (3) the proportion accessing the PMTCT programme who receive single dose Nevirapine or single dose Nevirapine plus short course AZT, (4) the typical breastfeeding practice for those accessing the PMTCT programme (options are: the same as the general population, formula feeding, and exclusive breastfeeding for six months followed by rapid weaning); and (5) the proportion of adults in need of ART that receive it. The three basic therapeutic interventions included are:
-
receive single dose Nevirapine
-
receive single dose Nevirapine plus short course AZT
-
receive triple therapy to treat the mother’s infection.
Table 2 shows the mother to child transmission rates associated with each option. The cells with sources indicated are those where the transmission rates come from published studies. Other cells are estimated by dividing transmission into two parts: intrauterine plus delivery (ID) and breastfeeding (BF, which varies with breastfeeding patterns) and using the formula:
Probability of mother to child transmission of HIV
transmission = ID × TxEff + BF*(1-ID)
where TxEff is the reduction in transmission due to treatment.
Transmission without treatment in non-breastfeeding populations (ID) is about 20%.14–16 With long breastfeeding and no treatment, transmission is about 30–35%.12 Late postnatal transmission to 18 months is about 9.3%.15 Transmission in the first month is 4–6%.16,17 Thus overall breastfeeding transmission (BF) is about 15%. Using the treatment effects estimated from specific trials18–21 and this formula we can estimate the other cells in table 2.
The average transmission rate for the entire population is the weighted average of the percentages of women in each category and the transmission rate for that category.
The percentage of HIV+ pregnant women who are eligible for ART is around 15–25% depending on the stage of the epidemic. However, this percentage will increase as ART coverage expands and more women are kept alive on ART. We assume that an HIV+ woman becomes eligible for ART about two years before she would otherwise die from AIDS. Thus, in the case of stable prevalence and the absence of any ART coverage the percentage of women eligible for ART would be 2/Lh, where Lh is the median time from infection to AIDS death. Late stage HIV infection reduces fertility to some fraction of that for women without HIV infection (FE) so the percentage of pregnant women eligible for ART would be (2×FE)/Lh. When all eligible women have been on ART for a large number of years the percent eligible would become (2× FE + La)/(Lh + La) where La is the additional years of life provided by ART. For situations between these two extremes the percentage of HIV+ pregnant women on ART will be (2× FE + La’)/(Lh + La’) where La’ is the number of additional years of life experienced so far by a cohort of women who have started ART a certain number of years ago. The weighted average across all these cohorts is the percentage of HIV+ pregnant women on ART in any given year.
NEED FOR TREATMENT
WHO recommends that HIV+ adults be started on ART when they have CD4 cell counts less than 200/mm3 or have advanced to Stage III disease with CD4 cell counts less than 350/mm3 or have advanced to Stage IV disease.22 The WHO draft guidelines for when to start children on ART are more complicated than those for adults and depend on the age of the child and whether or not CD4 or total lymphocyte counts are available.23
HIV+ children may also benefit from cotrimoxazole prophylaxis.24 WHO recommends cotrimoxazole for all children born to HIV+ mothers from 4–6 weeks of age until the child’s HIV status can be confirmed and for all children known to be HIV+. Spectrum implements these guidelines to estimate the number of adults and children needing treatment by relating eligibility to the stage of progression from infection to AIDS death. Details of this approach have recently been published elsewhere.25
IMPACT OF TREATMENT
ART and cotrimoxazole can increase survival for both adults and children. In Spectrum this is modeled as a constant annual probability of survival with HIV for those on treatment. (Non-AIDS mortality remains the same for those on treatment or not.) A review of the effects of ART on adult survival by Dabis, Egger, and Schechter of the ART-LINC Collaboration26 indicates that in resource poor settings survival on ART is about 90% in the first year. We use this as a constant annual probability of survival on ART for adults who would otherwise have died from AIDS. For children we assume that the annual probability of survival on ART is 91% based on Fassinou et al.27 For cotrimoxazole prophylaxis, Chintu et al24 found 85% survival after one year among children on cotrimoxazole alone. We use this rate for children on cotrimoxazole alone and assume no additional survival benefit of cotrimoxazole for children also receiving ART.
OTHER ENHANCEMENTS
A full set of output indicators (number infected, new infections, AIDS deaths, need for treatment) is now available for adults 15 years and older in addition to adults between the ages of 15 and 49. For any country with a national HIV survey, information on the prevalence by age in the year of the survey can be entered and Spectrum will adjust the age pattern of prevalence and the sex ratio of prevalence to match the survey in that year. Adult HIV prevalence can now be displayed with up to four decimal places so that Spectrum can be applied more easily in countries with very low HIV prevalence. There are new tables that show regional estimates for key indicators, including ART need, if the prevalence projections have been prepared by region of the country. Finally, a new output table displays the plausibility limits around key indicators depending on the type of epidemic (generalised or low level/concentrated), quality of surveillance data (poor, medium, or good) and prevalence trends (rising, stable, declining).
STRENGTHS
Spectrum uses the estimates of prevalence trends produced by EPP or the Workbook model to project the consequences of those estimates. The outputs include indicators useful for understanding the scope and magnitude of the epidemic, such as numbers of people infected, new infections, and AIDS deaths, and indicators needed for planning the response, such as the number of people needing treatment or PMTCT services. The estimates are used by both national programmes and by international agencies mobilising commitment and resources. Recent updates to Spectrum incorporate the latest research findings and allow national programmes to examine the implications of those results for their programmes. Key researchers contribute their expertise to the selection of approaches and assumptions used in Spectrum through participation in meetings of the UNAIDS Reference Group on Estimates, Modelling and Projections.
LIMITATIONS
Many of the assumptions in Spectrum are derived from a small number of studies. For example, assumptions about the impact of ART and cotrimoxazole on children are based on only one study each from Zambia and the Cote d’Ivoire. For lack of better information we apply these results to projections for all countries. Furthermore these results are from research studies with good service delivery and adherence and may not reflect the impact that will be achieved when implemented nationally. Thus there is a considerable amount of unknown uncertainty in the estimates of treatment effects. The need for ART is modeled based on the time to death in the absence of treatment and on the modified survival of those on ART. As treatment guidelines become more nuanced this simple approach may have to change to match new guidelines.
CONCLUSIONS
Spectrum is one of a package of tools that has been developed to estimate the impact of the AIDS epidemic at the national level. It continues to be updated to incorporate the latest research findings and provide indicators needed for programme planning. Recent updates have benefited from the many national surveys that now include HIV status and have responded to new research findings and programming needs by modifying the components for PMTCT programmes and adult and child treatment. These updates allow analysts from national programmes to estimate their needs in order to achieve national goals for prevention and treatment.
Acknowledgments
The Spectrum software, manuals, and training materials have been developed with funding from USAID. UNAIDS supported some modifications to add additional indicators of interest to national programmes. We thank Lynne M Mofenson for her review of studies reporting mother to child transmission through breastfeeding. We thank Basia Zaba and Emma Slaymaker for their detailed review and suggestions for the paper.
AUTHORS’ CONTRIBUTIONS All authors contributed to the conceptualisation of the model updates and the reviews of research data to develop the model assumptions. JS has overall responsibility for the model and drafted the initial version of this paper. NW prepared the data on age and sex distribution of high risk populations. NG prepared the model to analyse age and sex distribution over time and wrote that explanation. MM did the analysis of child survival and wrote that explanation.
REFERENCES
Footnotes
-
Competing interests: none.
-
Edited by Peter Ghys, Neff Walker, Helen Ward and Rob Miller