Article Text

Abstract
Objective Cardiac output, a fundamental parameter of cardiovascular function, has consistently been shown to increase across healthy pregnancy; however, the time course and magnitude of adaptation remains equivocal within published literature. The aim of the present meta-analyses was to comprehensively describe the pattern of change in cardiac output during healthy pregnancy.
Method A series of meta-analyses of previously published cardiac output data during healthy, singleton pregnancies was completed. PubMed and Scopus databases were searched for studies published between 1996 and 2014. Included studies reported absolute values during a predetermined gestational age (non-pregnant, late first trimester, early and late second trimester, early and late third trimester, early and late postpartum). Cardiac output was measured through echocardiography, impedance cardiography or inert gas rebreathing. Observational data were meta-analysed at each gestational age using a random-effects model. If reported, related haemodynamic variables were evaluated.
Results In total, 39 studies were eligible for inclusion, with pooled sample sizes ranging from 259 to 748. Cardiac output increased during pregnancy reaching its peak in the early third trimester, 1.5 L/min (31%) above non-pregnant values. The observed results from this study indicated a non-linear rise to this point. In the early postpartum, cardiac output had returned to non-pregnant values.
Conclusion The present results suggest that cardiac output peaks in the early third trimester, following a non-linear pattern of adaptation; however, this must be confirmed using longitudinal studies. The findings provide new insight into the normal progression of cardiac output during pregnancy.
Statistics from Altmetric.com
Introduction
During pregnancy, progressive adaptation of the maternal cardiovascular system is necessary for fetal development and growth. As part of the many physiological adaptations occurring during pregnancy, the maternal heart undergoes major structural and functional changes. These changes occur to ensure adequate oxygen and nutrient delivery to the fetus. It is known that changes in cardiac function typically precede structural remodelling and, therefore, may be early markers of adaptation during pregnancy.1 ,2 Cardiac output ( ), a fundamental functional parameter, reflects the total demand placed on the maternal cardiovascular system. During pregnancy, this is increased due to the additional requirement for blood flow to the uterus/placenta, kidneys, breasts, skin and the heart itself.1–3
Despite a wealth of literature describing  during healthy gestation, there is a lack of consensus in published literature regarding the time course of adaptation.1 ,2 ,4–11 Previous reviews agree that
  increases across pregnancy; however, there are discrepancies regarding the magnitude and pattern of change after the second trimester.2 ,11–13 Specifically,
  has been reported to follow three different patterns of change throughout pregnancy, namely: (1) a continued increase until term;1 ,4 ,5 (2) a continued increase to peak in the latter half of pregnancy, after which
  decreases towards term6 ,7 and (3) a continued increase to peak in the latter half of pregnancy, after which
  plateaus until term.8–10 The contribution of the determinants of
  to the pregnancy-related adaptation also remains unclear.11 The adaptation of
  may be driven by increases in blood volume and heart rate (HR), altered regulation of the autonomic nervous system or as a result of changes within the peripheral vasculature.1 ,4–11 ,14–16
Presently, the lack of certainty in the haemodynamic adaptation during healthy pregnancy impairs the understanding and, therefore, the early diagnosis of pregnancy-related cardiovascular complications, such as pre-eclampsia and gestational hypertension. To improve the current understanding of normal cardiac adaption to pregnancy, insight from larger cohorts with greater statistical power than typically possible within pregnancy research is required.17 Therefore, the aim of this study was to perform a series of meta-analyses to determine the time course of adaptation in  and related haemodynamics in response to healthy pregnancy.
Methods
Ethical approval and search strategy
This study received ethical approval from the Cardiff Metropolitan University ethics board. A comprehensive literature search of the PubMed and Scopus databases for peer-reviewed publications examining the maternal cardiovascular responses to pregnancy was conducted. The pre-set search engine criteria, both on PubMed and Scopus, were restricted to studies using humans, women and publications written in the English language. Reviews, editorials, case reports and unpublished data were excluded. The keywords and phrases used in the online search included combinations of the words cardiac output, maternal, cardiovascular, pregnancy, haemodynamic/hemodynamic, normotensive, and healthy, referring to uncomplicated gestation. As the last review on cardiac output during pregnancy2 was published in 1996, the search was limited to studies published between 1 January 1996 and 31 December 2014. There was no overlap of included studies between the last review and the current analyses.
Study selection criteria
Studies were eligible for inclusion in the meta-analyses if they met the following criteria;
Examined uncomplicated, healthy, singleton pregnancies;
Recruited women aged 19–35 years who conceived naturally;
Tested participants during one or more of the following gestational ages: first trimester (6–13 weeks); early second trimester (14–20 weeks); late second trimester (21–27 weeks); early third trimester (28–34 weeks), late third trimester (34 weeks-term); during the early (4–12 weeks) or late (13–52 weeks) postpartum period;
Provided the mean (L/min) and SD of
 and
andAssessed
using one of the following methods: MRI, echocardiography, impedance cardiography or inert gas rebreathing. A brief description of each method is included within the legend of online supplementary table S1.


Studies of longitudinal and cross-sectional design were eligible to be included within the meta-analyses.
Patient involvement
There was no patient or public involvement in the design of this study.
Outcome variables
The primary variable,  , was assessed across healthy pregnancy. Secondary variables were related haemodynamic variables, namely HR, stroke volume (SV), mean arterial pressure (MAP), systemic vascular resistance (SVR) and left ventricular (LV) mass.
Study process
The lead author (VLM) independently screened and reviewed the titles and abstracts of all identified publications. Full-text articles were retrieved for each study that was considered relevant from the initial evaluation. Full-text articles were independently assessed by two reviewers (VLM and EJS) through completion of a predesigned eligibility form. Inclusion into the final dataset was based on the a priori selection criteria described. Consensus was sought on the final set of articles to be included and disagreements were resolved through discussion. Some issues could not be resolved according to the inclusion criteria set a priori. In studies where conception was not explicitly described, it was assumed that participants conceived naturally and not through use of reproductive therapies. Where  was only included in a graphical format or not reported in L/min as a mean and SD, the corresponding authors of the original publications were contacted by email and asked to provide the required data. Suitable data provided by authors of original publications were included in the analyses. When data were not provided, the publications were excluded.
Data extraction
The lead author extracted all relevant data from the full-text articles to be included in the meta-analyses. The mean±SD of  for each study was transferred into a predesigned form along with the sample sizes (Excel 2010, Microsoft Corp). Where reported, HR, SV, MAP, SVR and LV mass (mean±SD and sample size) were also extracted from the same studies.
Statistical analyses
As all parameters were continuous variables, sample size and mean±SD were input into the analysis software (Comprehensive Meta-analysis software (V.2.0), Biostat, Englewood, New Jersey, USA). Separate random-effects meta-analyses were applied to all primary and secondary outcome variables for each gestational stage (non-pregnant, first trimester, early and late second trimester, early and late third trimester, early and late postpartum). As the meta-analyses were based on observational data obtained from populations which would unlikely have a common variance, a random-effects model was used. True effects would inherently vary from study to study due to different effect sizes, and the random-effects model allows for variation between studies. Use of a random-effects model also allows for generalisation to similar studies that may be conducted in the future, allowing this dataset to serve as a potential reference point. For each analysis, a weighted mean, SE, variance, upper and lower limits were computed through the DerSimonian and Laird method.18 The homogeneity of the reported data for each parameter was assessed, with no indication of skewness. Publication bias was evaluated through a funnel plot and, if present, was corrected through use of Duval and Tweedie's trim-and-fill method. Forest plots were created for each individual meta-analysis19 and presented as a compiled figure for each variable at each time point of analyses (Excel 2010, Microsoft Corp).
Results
Search results
The search process, as illustrated in figure 1, resulted in the inclusion of observational data from a total of 39 articles sourced from both the original database and reference list searches. Originally, only 32 articles were eligible as the numerical data were not reported as per requirement for inclusion; however, following email contact other data were obtained for seven studies.5 ,20–25
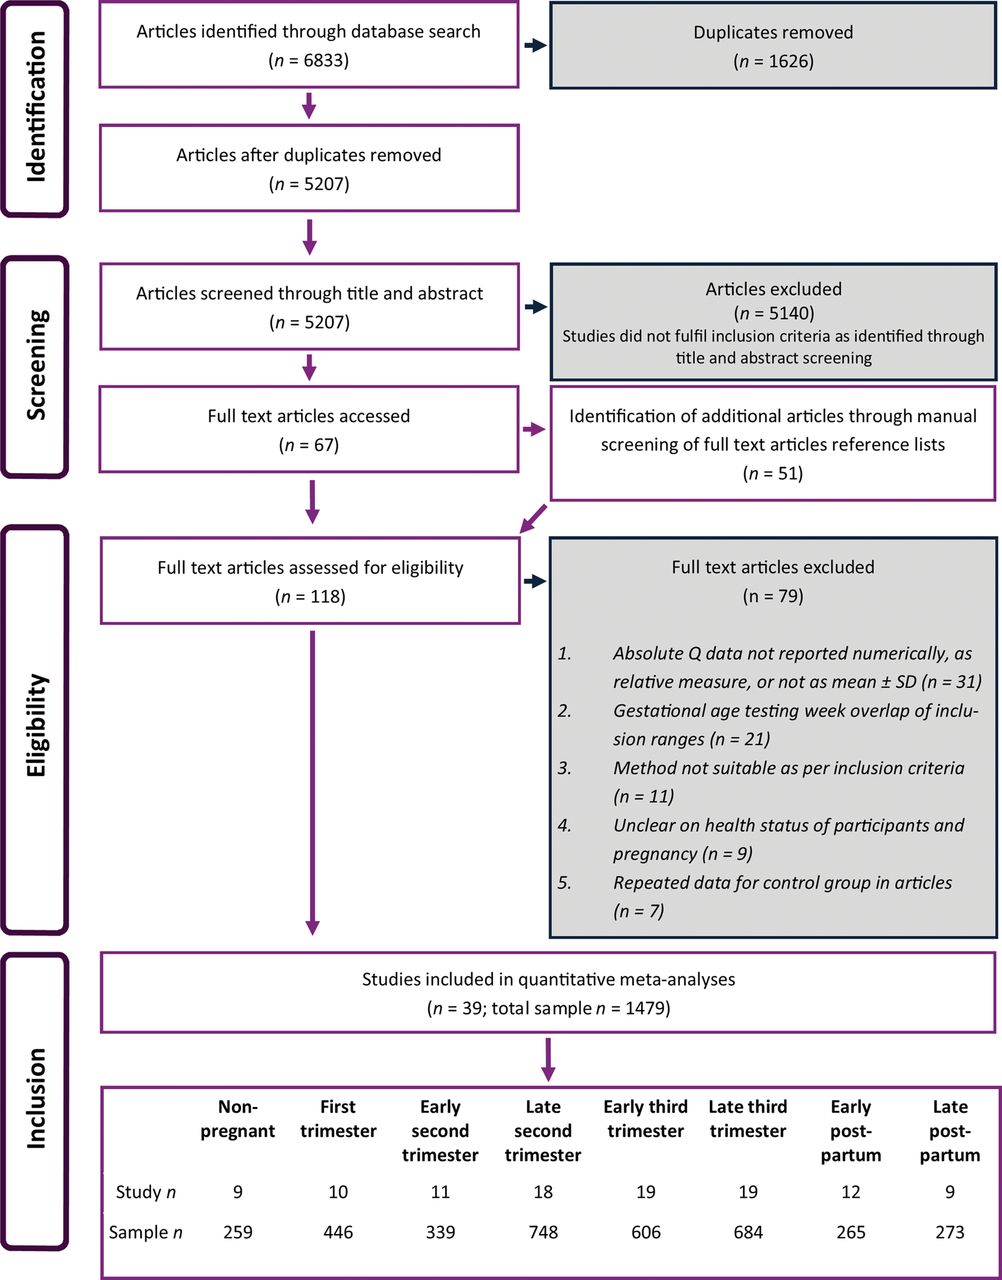
Flow diagram showing study inclusion and exclusion processes.  , cardiac output.
Four studies reported multiple datasets within one of the predetermined gestational age ranges for example, data at week 8 and week 10, both eligible to be included for first trimester (6–13 weeks) analyses.4 ,6 ,9 ,26 In all cases, the data were not included within the meta-analysis for that predetermined gestational age in order to avoid statistical bias that would arise from inclusion of multiple datasets from an individual study.
Following the review process, observational data from 39 studies were included within the final analyses; however, the number of studies included in the individual meta-analyses conducted for each of the eight time points ranged from 9 to 19, as shown in figure 1. The non-pregnant data were collected from eligible studies that reported data for a non-pregnant control or preconception group.4 ,5 ,9 ,25 ,27–31 Details of the 39 included studies are reported in table 1. More detailed information about the methodology of each study is included in the online supplementary table S1.
Details of included studies
Search outcomes
For the 39 included studies, the total sample size included within the analyses of  was 1479, with numbers ranging from 259 to 748 in the individual analyses (figure 1). Within the analyses of the additional haemodynamic variables, the required data were not consistently reported; therefore, total sample sizes were, in some cases, much reduced in the analyses of additional parameters (see online supplementary table S2).
Publication bias
Examination of funnel plots indicated publication bias in two of the eight time points within the meta-analyses for  . Original outputs were adjusted to reflect the presence of bias and these values were reported as the final results. Within the forest plot of
  (figure 2), the original outputs prior to any adjustment for bias are shown. Similarly, publication bias was also identified within some of the meta-analyses of HR, SV, MAP, SVR and LV mass and all analyses were corrected accordingly. The original outputs prior to any adjustment for bias are also shown within the forest plots for each parameter (see online supplementary—figures S1–S5).

Individual forest plots showing all meta-analyses of cardiac output at different gestational ages. Filled grey squares represent study outputs ( ). Filled black diamonds (
 ) represent the weighted mean as a result of the analyses. Unfilled diamonds (
 ) represent outputs from biased analyses that were corrected for using Duval and Tweedie's trim-and-fill method. Dotted line represents non-pregnant weighted mean on all figures. Black solid line represents weighted mean for that individual gestational age. † Non-pregnant weighted mean at same value as weighted mean for early postpartum (4.96 vs 4.91 L/min1).
Analyses results
A composite figure of forest plots for  at each time point of analyses is shown in figure 2. Forest plots for each associated variable are included as online supplementary figures S1–S5. The summary effect, or weighted mean, and 95% CIs for
  and related haemodynamics at each gestational age are provided in table 2 and presented in figure 3. Observations of the results are discussed below; no statistical tests have been performed to infer differences between gestational ages.
Weighted mean and 95% CIs for cardiac output and related haemodynamics during pregnancy

Compiled weighted mean and 95% CIs derived from meta-analyses for cardiac output, heart rate (HR), stroke volume (SV), mean arterial pressure (MAP), systemic vascular resistance (SVR) and left ventricular (LV) mass at each gestational age. Coloured bars represent the first, second and third trimester of gestation. NP, non-pregnant; T1, trimester one; T2, trimester two; T3, trimester three; PP, postpartum.
During the first trimester,  was 0.74 L/min (15%) higher than non-pregnant values. The peak value of 6.48 L/min for
  was observed in the early third trimester; representing a 1.5 L/min (31%) increase above non-pregnant values.
  did not increase linearly until peak, observed by a small drop of 0.11 L/min (2%) from the early second to late second trimester. After the observed peak in the early third trimester,
  was lower by 0.41 L/min (6%) in the late third trimester. In the early postpartum period,
  returned to non-pregnant values, after which, there was a subsequent modest increase in the late postpartum period by 0.63 L/min (12%).
HR rose progressively over the course of gestation, reaching its highest value in the late third trimester 16 bpm (24%) above non-pregnant values. Following birth, HR returned to non-pregnant values and remained stable across the early and late postpartum period. From non-pregnant values, SV increased by 6 mL (8%) in the first trimester. The peak adaptation occurred in the early second trimester where a 10 mL (13%) difference from non-pregnant values was identified.
MAP remained relatively stable throughout pregnancy and did not exceed non-pregnant values at any gestational age. The greatest reduction from non-pregnant values occurred during the second trimester with an average decrease of 8 mm Hg (9%). SVR progressively decreased over the course of pregnancy, with the lowest value of 396 dyne s/cm6 (30%) below non-pregnant values occurring during the early third trimester. As expected with the limited changes in MAP, SVR followed a similar pattern to that observed in  . Following birth, SVR returned to non-pregnant values.
The greatest difference in LV mass was observed during the early third trimester with an increase of 40 g (34%) above non-pregnant values. Despite returning to non-pregnant levels in the early postpartum period, LV mass remained elevated by 9 g (8%) in the late postpartum period.
Discussion
The aim of the present study was to determine the time course of adaptation in  and related haemodynamics in response to healthy pregnancy from previously published observational data. The results from the present meta-analyses show that
  increases during healthy pregnancy; however, the pattern of change may not be linear up until the point of peak adaptation. These findings may have important implications in identifying healthy versus abnormal adaptation of the maternal cardiovascular system during gestation.
Cardiac output changes in the first trimester
During healthy pregnancy,  is known to increase above non-pregnant levels; however, the magnitude and time course of change remains unclear within the published literature. Discrepancies in the reported adaptation of
  early in pregnancy exist and it is not well understood if the changes occur as a result of increases in SV, HR or a combination of both contributing factors.2 ,11 Increased SV, as a result of an increased blood volume, was previously believed to be the main determinant of the increase in
  in the first trimester.4 ,8 ,32 However, the present results showed only a small contribution of SV to the observed increase in
  .6 ,9 This may be result of substantial vasodilation of the renal and systemic circulation combined with an increased capacity and filling state of the venous compartment accommodating the increased blood volume.33 ,34 Supported by previous longitudinal data,27 the present study shows a reduction in SVR from pre-pregnancy to early first trimester indicating a reduction in afterload, which in turn, will stimulate the sympathetic nervous system and increase HR. Thus, the results from the present analyses indicated that increased
  early in pregnancy may be largely the result of a reduced afterload.
Peak cardiac output in the early third trimester
As discussed in previous reviews,2 ,11 the third trimester has been associated with significant discrepancies in the pattern of  adaptation, with either a continual increase, decrease or plateau within the final weeks of gestation. Supporting some of the previous data,6 ,7 this study shows that peak
  is achieved in the early third trimester, followed by a decrease towards term. One explanation for this pattern could be that compression of the inferior vena cava as a result of considerable and progressive fetal growth occurring during the third trimester affects venous return.2 In addition, blood flow to the uteroplacental circulation is at its peak (approximately 12% of total
  ) during the late third trimester in order to meet fetal metabolic demands.35 ,36 Both factors could contribute to a reduced cardiac preload and therefore
  during the late third trimester. The progressive increase in HR throughout pregnancy peaking in the late third trimester, identified previously5 ,13 ,27 and confirmed here, likely offsets the decrease in cardiac preload, thus maintaining
  at a functional level until delivery. The alterations in HR, SVR and LV mass reflect increased sympathetic activation, decreased vascular tone and structural remodelling of the maternal heart, all of which may be secondary to hormonal surges and an increased physiological demand of gestation. In line with the decrease from peak
  in the late third trimester, the results from the present analyses also show that LV mass declines prior to delivery. While this finding has not been observed previously in the literature, the consistent CIs in these meta-analyses suggest that this is a physiological phenomenon. Speculatively, this decline may be due to the result of changes in LV wall stress37 and/or reductions in hormonal concentrations in late third trimester, such as placental growth factor,38 but future investigations are warranted.
Non-linear increase of during pregnancy

The results of this study demonstrate that the increase in  until peak during pregnancy may not be linear. From the non-pregnant state to term, a steady and progressive rise in
  is interrupted by small reductions in the late second trimester and late third trimester, with the peak value achieved between these points in the early third trimester. As shown in online supplementary figure S6(a), this finding may not have been observed in previous literature due to the simple collation of data by trimester. As discussed previously, the reduction in
  in the late third trimester is supported by previous literature and likely occurs as a result of a reduction in cardiac preload. However, the small reduction in
  during the late second trimester has not previously been observed and may also be attributed to changes in cardiac preload. Maternal-fetal circulation within the placenta is only achieved after 14 weeks gestation yet uteroplacental blood flow remains stable until 20 weeks gestation,39 after which it increases rapidly as a result of fetal growth and metabolic demand. Blood volume remains relatively unchanged during the second trimester which, when combined with a progressively increasing uteroplacental blood flow, may cause the drop in venous return and hence SV during the late second trimester.40 Appropriately powered longitudinal studies with assessments at regular intervals across gestation should be used to statistically confirm these findings.
Postpartum regression of adaptation
As discussed in a previous review,2  is considerably reduced after delivery in the early postpartum period returning to non-pregnant values. The rapid decline in
  following birth is likely a consequence of reduced maternal cardiovascular demand and hormonal drive following delivery.41 Within the extended postpartum period,
  increases modestly above non-pregnant values.11 Previous studies have reported prolonged effects on cardiovascular function following gestation, including increased arterial compliance.42 In the late postpartum, SVR is reduced below non-pregnant and early postpartum levels. Favourable peripheral adaptations post pregnancy may contribute to the increased
  at this time point. In addition, many factors likely influence maternal
  in the postpartum period. Breastfeeding and/or a return to physical activity after birth may also explain the variability in the regression of cardiac structure and function observed.
Clinical implications
The understanding of pregnancy-related cardiovascular complications, such as pre-eclampsia and gestational hypertension, is limited by the incomplete understanding of healthy cardiovascular adaptation to pregnancy. While it is generally accepted that  increases during healthy pregnancy, the time course of adaptation, as determined in this study, provides new insight into the expected timing and magnitude of responses. These meta-analyses have suitable power from a pooled observational dataset to provide a representative ‘norm’ of adaptations to
  and related haemodynamics during uncomplicated gestation. The findings represent the healthy cardiac adaptation to pregnancy.
Limitations and future directions
While the present meta-analyses offer new insight into the course of cardiovascular adaptation to healthy pregnancy, limitations of this study must be acknowledged. Despite the pooled sample sizes being greater than most pregnancy research studies, it must be highlighted that within each of the meta-analyses for  , the sample size ranged between 258 and 748 (data presented in see figure 1 and online supplementary table S2). The reductions in the sample size within analyses for additional haemodynamic parameters must also be considered. Careful interpretation of results from analyses with a low sample size is required (see online supplementary table S2). Inclusion in the meta-analyses was based on the mean gestational age at assessment fitting within a predefined time frame and took no consideration of the range or SD of this mean; thus, overlap between gestational ages may be present within the analyses. Statistical significance was not analysed between the meta-analyses of each gestational age for each parameter so all reported results are observations of trends and must be interpreted carefully.
There are limitations to each methodology included within these analyses that should be considered. The determination of  by inert gas rebreathing relies on correct alveolar gas mixing and a constant oxygen saturation during measurement,43 which cannot be confirmed without invasive procedures. The calculation of
  from impedance cardiography is based on assumptions that may not be appropriate during pregnancy as a result of the developing fetal unit.44 In echocardiography, the upward shift of the diaphragm may interfere with the image acquisition45 which may alter the reliability of measurement. However, echocardiography is the preferred method for cardiac imaging during pregnancy.46 To identify if the results of these analyses were altered due to the inclusion of varying methodologies, the analyses were completed with studies using echocardiography only (n=29). Only minor differences between the two outputs were noted (see online supplementary figure S6(b)). The values derived from incorporation of the differing techniques in these analyses may allow a wider application within clinical practice and research.
The left lateral position has been shown to be a preferable position for  measurement in pregnant women in order to avoid inferior vena cava compression.47 Accordingly, the meta-analyses were re-run on studies that collected data in the left lateral position only (n=29). Comparison of these analyses to the total dataset suggested limited impact of maternal position (see online supplementary figure S6(c)).
An influence of parity, ethnicity, pre-pregnancy body mass index, and gestational weight gain have previously been observed.2 ,11 The impact of breast feeding on postpartum regression has also not been addressed within this study. These analyses were limited in control of these factors due to the inherent use of previously published data. Future studies should be conducted with consideration for maternal factors and should investigate their impact on the course of cardiovascular adaptation during and after healthy pregnancy.
Conclusion
Through use of meta-analyses based on observational data, this study shows that  is increased above non-pregnant levels as early as the first trimester, reaching its peak in the early third trimester. Importantly, the present results indicate that changes in
  may not increase linearly to this peak; however these observations require confirmation from robust longitudinal studies. The results of this study may serve as a reference point for cardiovascular adaptation to healthy pregnancy and therefore, could enable the identification of a maladaptive maternal response.
Key messages
What is already known on this subject?
During pregnancy, maternal cardiac output adapts to accommodate the demands of the developing fetus. There is a lack of consensus within the literature regarding the progression of cardiac output across healthy pregnancy, thus impairing the understanding of pregnancy-related cardiovascular complications.
What might this study add?
This series of meta-analyses comprehensively characterises the healthy maternal cardiac output response to pregnancy.
How might this impact on clinical practice?
These meta-analyses provide new insight into the expected timing and magnitude of adaptation in maternal cardiac output during healthy gestation. In clinical practice, the normative values derived from the present analyses could be used to identify maternal maladaptation during pregnancy.
Acknowledgments
The authors would like to kindly acknowledge Professor Yoav Ben-Shlomo, University of Bristol, Bristol, UK, for his valuable comments and suggestions on the manuscript.
References
Supplementary materials
Supplementary Data
This web only file has been produced by the BMJ Publishing Group from an electronic file supplied by the author(s) and has not been edited for content.
- Data supplement 1 - Online figures
- Data supplement 2 - Online tables
Footnotes
Twitter Follow Victoria Meah at @vtorixm
Contributors VLM, EJS, RS and JRC conceived and designed the study. VLM acquired the data and is the guarantor for this study. VLM and EJS analysed the data. VLM, EJS, RS and KB interpreted the data, and VLM drafted the manuscript. EJS, RS, KB and JRC critically reviewed the manuscript. All authors provide final approval of the version to be published and agree to be accountable for all aspects of the work. The views expressed are those of the authors.
Competing interests None declared.
Ethics approval This study was approved by Cardiff Metropolitan University Ethics board (code 13/06/02R).
Provenance and peer review Not commissioned; externally peer reviewed.
Data sharing statement The full set of data from these meta-analyses is available on request from the corresponding author at vimeah@cardiffmet.ac.uk.