Article Text

Abstract
Objective To examine whether the associations between sedentary behaviours (ie, daily sitting/TV-viewing time) and mortality from cardiovascular disease (CVD) and cancer differ by different levels of physical activity (PA).
Design Harmonised meta-analysis of prospective cohort studies. Data on exposure variables were harmonised according to a predefined protocol and categorised into four groups for sedentary behaviours and into quartiles of PA (MET-hour/week).
Data sources PubMed, PsycINFO, Embase, Web of Science, Sport Discus and Scopus.
Eligibility criteria for selecting studies Individual level data on both sedentary behaviours and PA and reported effect estimates for CVD or cancer mortality.
Results Nine studies (n=850 060; deaths=25 730) and eight studies (n=777 696; deaths=30 851) provided data on sitting time and CVD and cancer mortality, respectively. Five studies had data on TV-viewing time and CVD (n=458 127; deaths=13 230) and cancer (n=458 091; deaths=16 430) mortality. A dose–response association between sitting time (9%–32% higher risk; p for trend <0.001) and TV time (3%–59% higher risk; p for trend <0.001) with CVD mortality was observed in the ‘inactive’, lowest quartile of PA. Associations were less consistent in the second and third quartiles of PA, and there was no increased risk for CVD mortality with increasing sedentary behaviours in the most active quartile. Associations between sedentary behaviours and cancer mortality were generally weaker; 6%–21% higher risk with longer sitting time observed only in the lowest quartile of PA.
Conclusion PA modifies the associations between sedentary behaviours and CVD and cancer mortality. These findings emphasise the importance of higher volumes of moderate and vigorous activity to reduce, or even eliminate these risks, especially for those who sit a lot in their daily lives.
- physical activity
- sedentary
- cardiovascular
- cancer
- sitting time
Statistics from Altmetric.com
Introduction
Sedentary behaviours, usually assessed as daily sitting and TV-viewing time, are highly prevalent and have been considered potentially detrimental to health.1–6 Previous meta-analysis on the association between sitting time and deleterious health outcomes concluded that prolonged sedentary time was associated with both cardiovascular disease (CVD) and cancer mortality, independent of physical activity.1 6 Consequently, many countries and scientific authorities have introduced guidelines, or have identified the importance of understanding the potential benefits of reducing sitting time.7 8
Using a harmonised meta-analytical approach, we recently reported that moderate and vigorous intensity physical activity (MVPA) of at least 60 min/day appears to eliminate the detrimental association between sitting time and all-cause mortality.9 Results were consistent in joint association analyses, directly comparing mortality rates among persons having different combinations of physical activity and sitting time with those who were most active and sat the least, and in analyses stratified by physical activity where the association between sitting time and mortality was investigated separately among individuals belonging to different strata of physical activity. We observed that the associations between sitting and mortality differed depending on how much physical activity was carried out.9
In order to examine whether these modifying effects of physical activity exist for relationships between sitting and cause-specific mortality, in this paper, we further explore our previous observations by examining the associations between sitting time, TV-viewing time and CVD and cancer mortality, in four different strata of physical activity. Further, we examined a possible dose–response association in each stratum of physical activity with increasing sitting and TV-viewing time.
Methods
We performed secondary data analyses following a systematic review.9 We identified seven studies,10–16 which examined the associations between sitting time and CVD mortality; of these, six studies also provided data on cancer mortality.10–15 We obtained data from one additional study,17 where the pertinent data were available but not published and used publicly available data for Women’s Health Initiative Observational Study.18 In total, these analyses included data from nine studies on CVD mortality and eight studies on cancer mortality. We also identified five studies on TV-viewing time and CVD and cancer mortality.11 14 15 19 20
Following the Preferred Reporting Items for Systematic Reviews and Meta-Analyses guidelines, we included prospective cohort studies that had individual level exposure, covariate and outcome data, provided data on both daily sitting or TV-viewing time and physical activity and reported effect estimates (ie, HRs, ORs or relative risks (RRs) with 95% CIs) for CVD mortality or cancer mortality. Further details on data sources, literature search, study selection and data extraction procedures are reported elsewhere.9 The protocol is registered with the PROSPERO database (http://www.crd.york.ac.uk/PROSPERO/display_record.asp?ID=CRD42015023870).
Data were reanalysed in the same harmonised manner as previously described.9 Briefly, sitting time was categorised into four groups (0 to <4 hour/day, 4 to <6 hour/day, 6–8 hour/day and >8 hour/day) and TV-viewing time into four groups (<1 hour/day; 1–2 hour/day 3–4 hour/day and >5 hour/day). Physical activity was self-reported using previously validated questionnaires. We included information on walking and leisure time and recreational activities including exercise and sports as this information was available from all studies. Physical activity was recalculated according to predefined protocols and expressed as metabolic equivalent of task (MET)-hours/week and stratified into quartiles in each individual study. For comparability purposes, we used the median of MET-hour/week across studies included in the original publication, for the upper boundary in the first (2.5 MET-hour/week; 5 min/day of MVPA), second (16 MET-hour/week; 25–35 min/day of MVPA) and third (30 MET-hour/week; 50–65 min/day of MVPA) quartiles of physical activity and the lower boundary (35.5 MET-hour/week; 60–75 min/day of MVPA) for the fourth (top) quartile.8 The corresponding MET-hour/week for the nine studies included in these analyses are 4, 10, 19 and 36 MET-hour/week, respectively.
All studies excluded participants with chronic diseases at baseline or excluded deaths occurring within at least 1 year from baseline measurements, suggesting all studies only included apparently healthy participants at baseline. Additionally, all studies provided effect estimates (HRs and 95% CIs) using Cox regression and adjusted their analyses using the same covariates as in their original publications.
We examined a potential interaction effect of physical activity on the dose–response associations between sitting time and CVD and cancer mortality in analyses stratified by quartiles of physical activity. Those who sat the least were used as the reference category in each quartile. That is, we separately examined whether the association between sitting time and mortality for each of the quartiles of physical activity differed. We estimated summary HRs with 95% CIs across studies in separate meta-analyses for each outcome with a fixed-effect inverse variance method. We then repeated these analyses for TV-viewing time. We tested the trend for the probability of mortality within each stratum of physical activity with a Wald test in a logit model for the numbers of deaths and survivals.
We performed sensitivity analyses by separating the two highest categories for sitting time into two (8–10 hour/day and >10 hour/day) and repeated the analyses. We estimated the influence of each individual study by excluding one study at a time and finally reanalysed all data and estimated HRs across studies with random-effect models. The meta-analyses were conducted using Matlab (R2014a, The Mathworks, Inc).
Results
Tables 1 and 2 show the characteristics of the studies included in the meta-analyses. For CVD mortality, nine studies had data on sitting time (n=850 060; median follow-up 10.2 years; 25 730 deaths) and five had data on TV-viewing time (n=458 127; median follow-up 8.5 years; 13 230 deaths). For cancer mortality, eight studies had data on sitting time (n=777 696; median follow-up 11.5 years, 30 851 deaths) and five had data on TV-viewing time (n=458 091; median follow-up=8.5 years; 16 430 deaths).
Characteristics of studies included in the meta-analysis on the association between sitting time and cardiovascular and cancer mortality.
Characteristics of studies included in the meta-analysis on the association between TV-viewing and cardiovascular and cancer mortality.
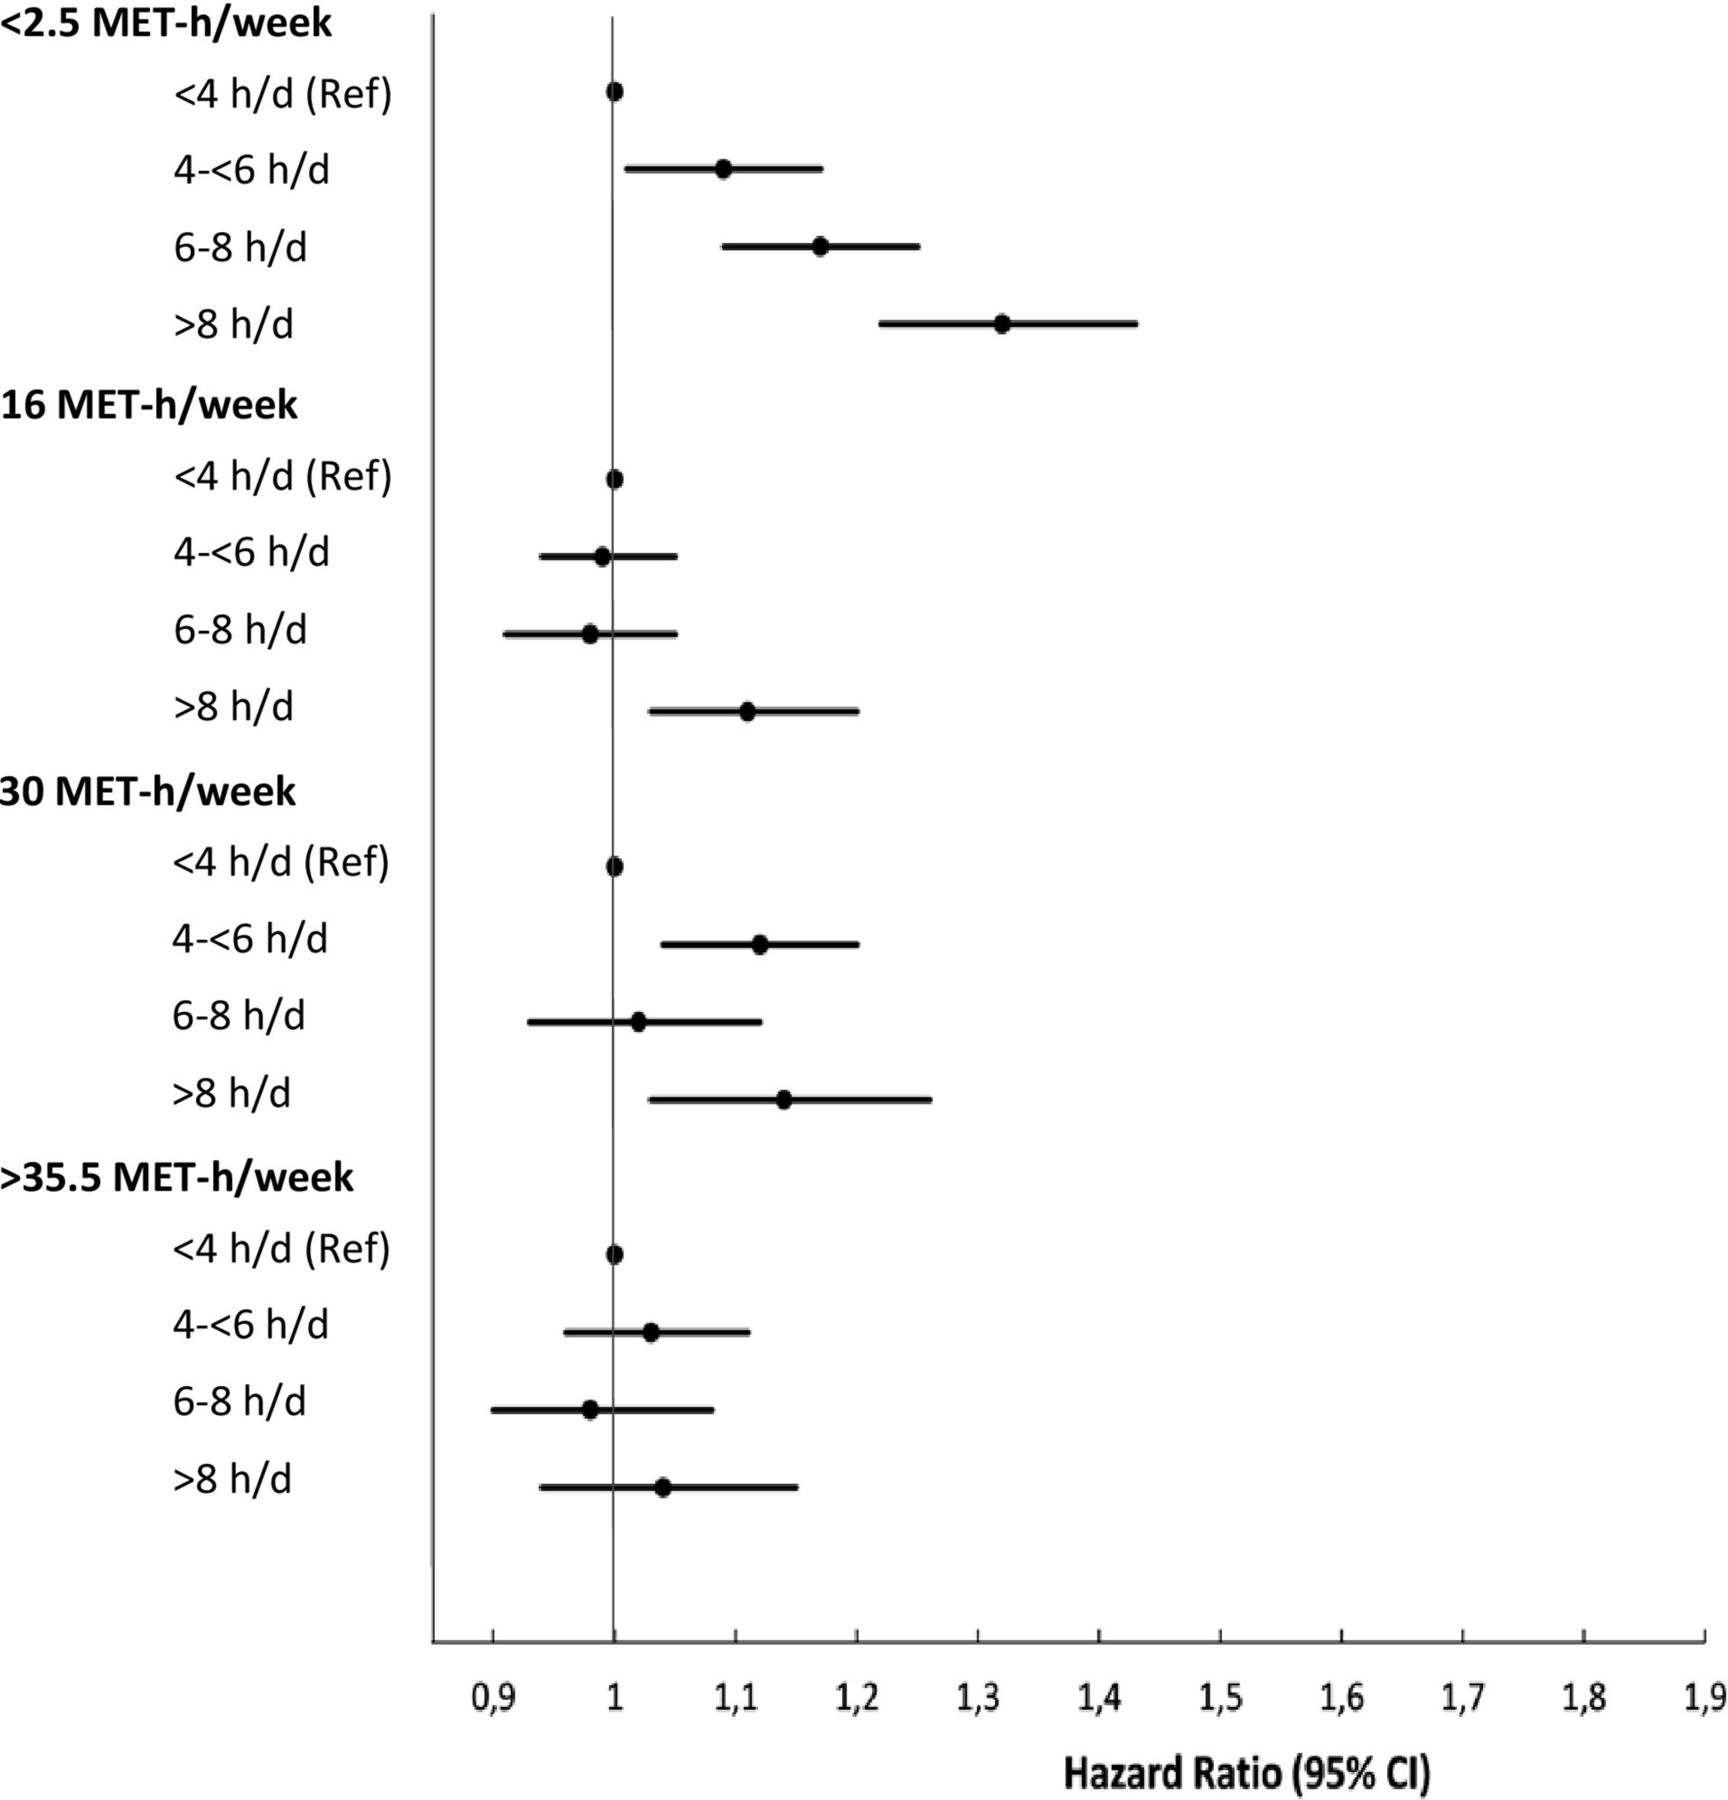
Figure 1 shows the associations between sitting time and CVD mortality stratified by quartiles of physical activity. A clear dose–response association (p<0.001) between sitting time and CVD mortality was observed in the ‘inactive’, lowest quartile of physical activity (<2.5 MET-hour/week). The hazard of CVD mortality was 32% higher in those who sat for more than 8 hour/day compared with the reference group (<4 hour/day) (p for trend <0.001). There was no clear dose–response association in any of the other quartiles for physical activity, but significantly increased hazards (HR=1.11, 95% CI 1.03 to 1.20) and (HR=1.14, 95% CI 1.03 to 1.26) were observed in those who sat for >8 hour/day compared with the reference group in the second and third quartiles. There was no increased risk for CVD mortality in the most active quartile (>35.5 MET-hour/week) in any category of sitting time. In sensitivity analyses including five studies (n=268 813; deaths=6763) in which sitting time was categorised into five groups (<4 hour/day; 4-<6 hour/day; 6-<8 hour/day; 8–10 hour/day and >10 hour/day), increased hazards for CVD mortality were observed in the highest sitting groups (8–10 and >10 hay/day) in the two lowest quartiles for physical activity (online Supplementary table 1).
Supplemental material

Meta-analysis of the stratified associations between sitting time (n=850 060; 25 703 deaths) and CVD mortality. The reference categories are the groups with <4 hour/day of sitting or <1 hour/day of TV-viewing for all quartiles of physical activity. Median upper boundary for Q1–Q3 and lower boundary for Q4 in MET-hour/week. The equivalent amount of time spent in moderate intensity activity are ≈5 min/day (Q1); 25–35 min/day (Q2); 50–65 min/day (Q3) and 60–75 min/day (Q4).
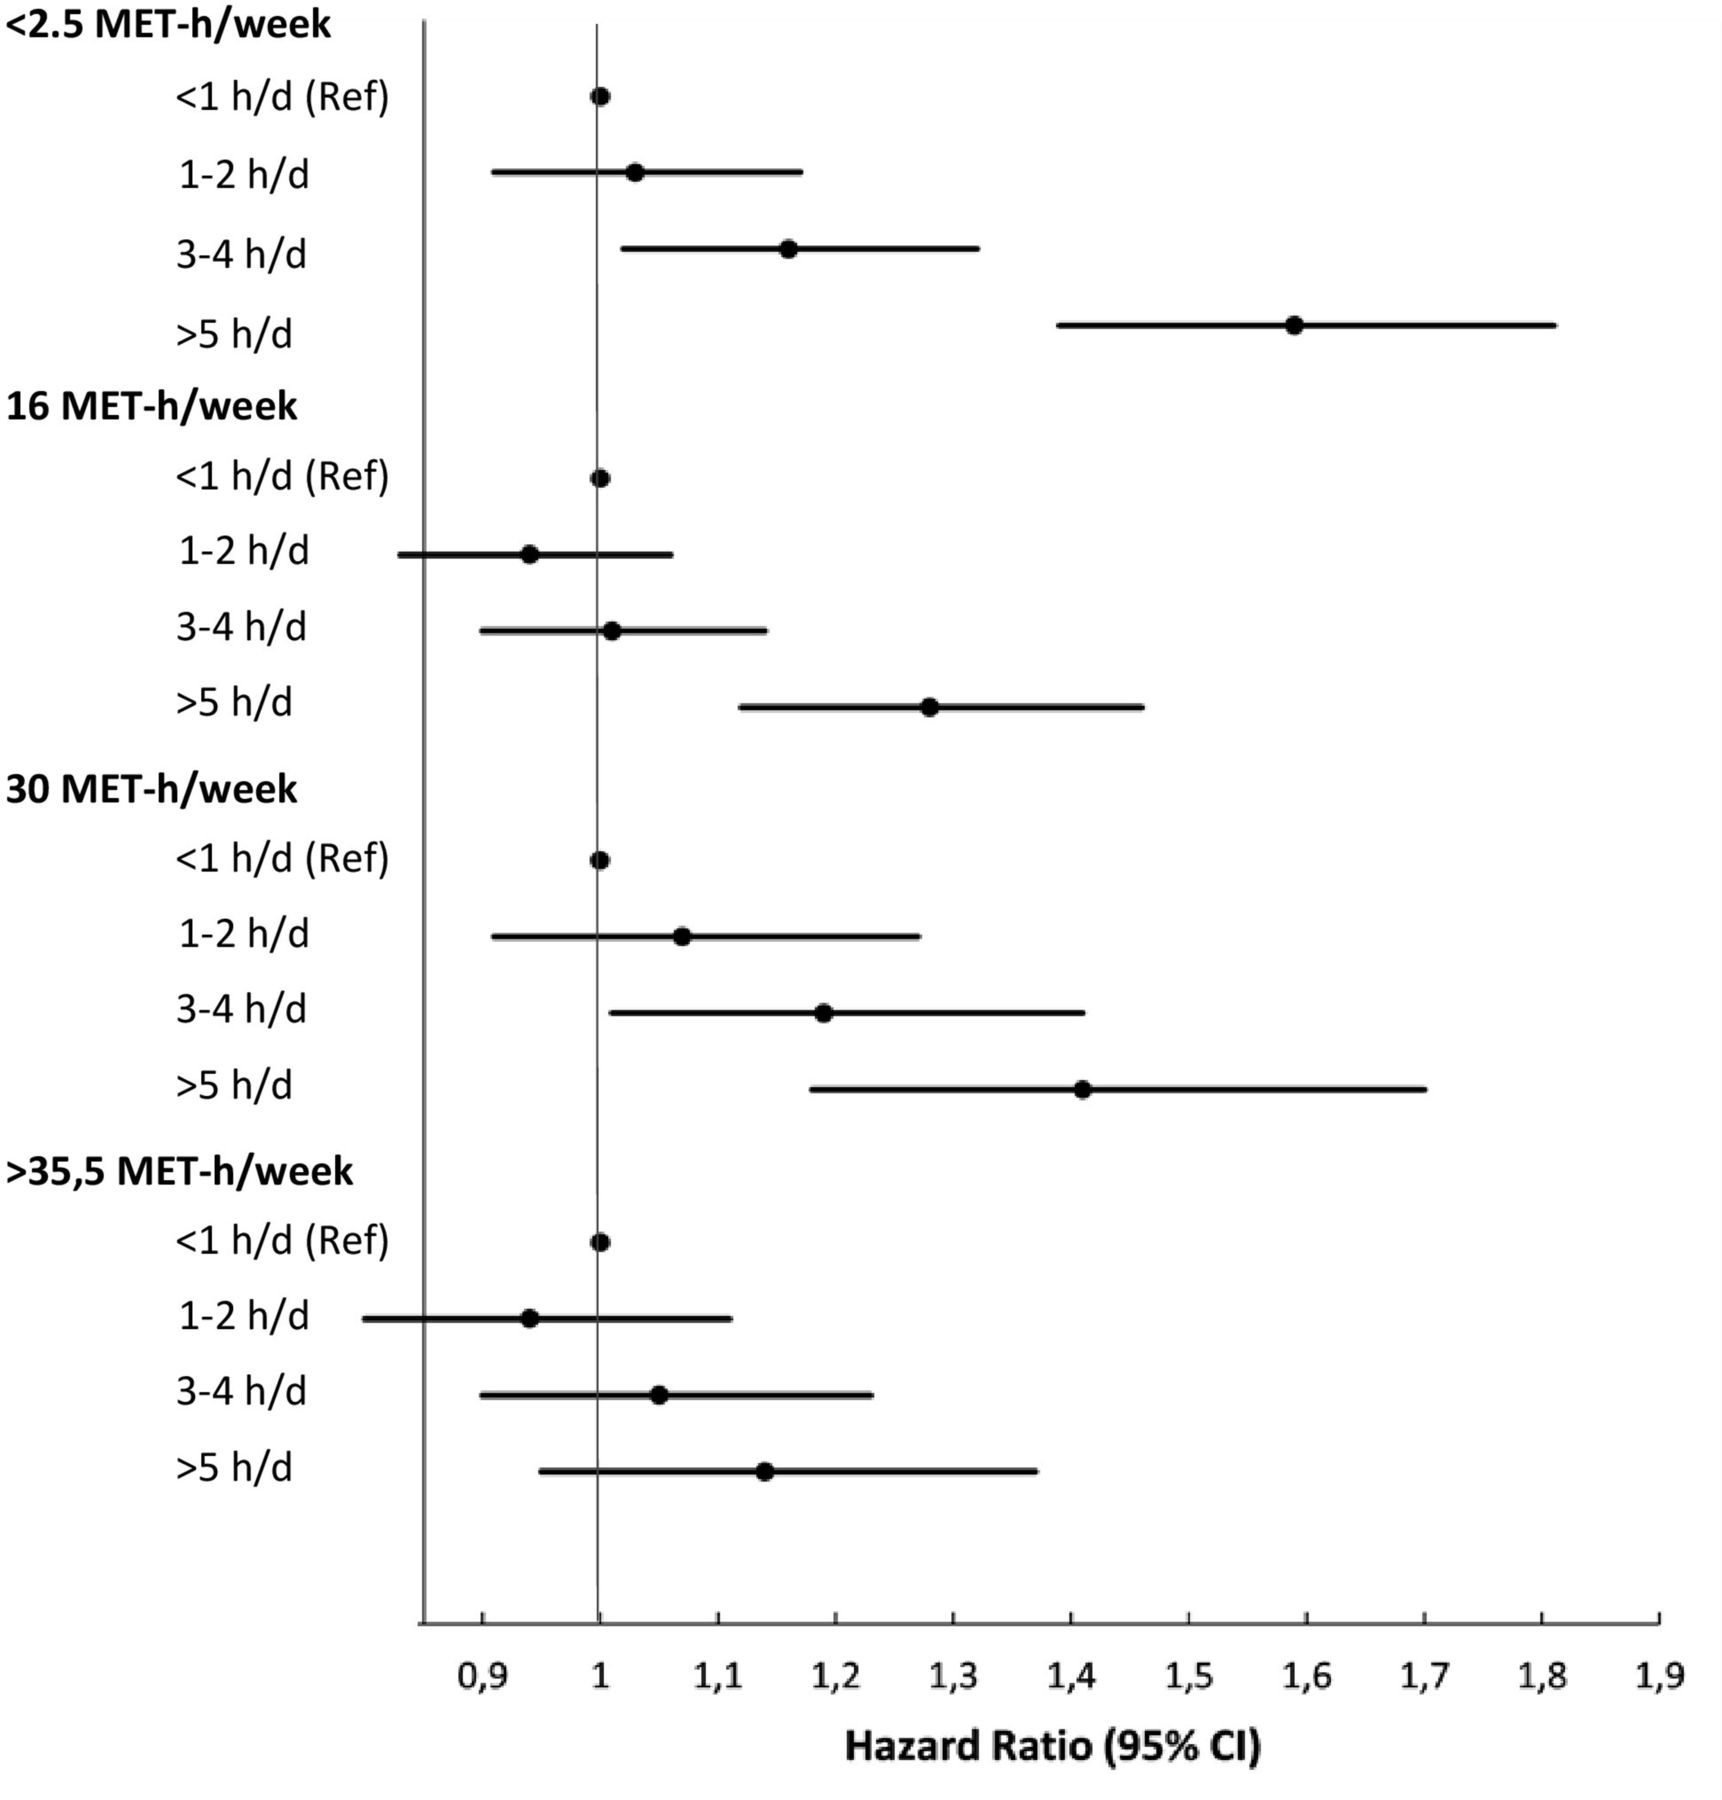
We next analysed TV-viewing time instead of sitting time, using as referent those who reported less than 1 hour/day of TV viewing (figure 2). The patterns of the results were very similar to those described above for sitting time. In the ‘inactive’ (lowest) quartile of physical activity (<2.5 MET-hour/week) in which the hazard of CVD mortality was 59% higher in those who watched TV for >5 hour/day compared with the reference group (<1 hour/day; p for trend <0.001). Although dose–response relationships were evident in the other physical activity categories, hazard estimates were only significantly increased in the second (by 28%) and third (by 41%) physical activity quartiles, when TV time was >5 hour/week. There was no increased risk for CVD mortality in the most active quartile (>35.5 MET-hour/week) in any category of TV-viewing time.

Meta-analysis of the stratified associations between and TV-viewing time (n=458 127; deaths=13 230) and CVD mortality. The reference categories are the groups with <4 hour/day of sitting or <1 hour/day of TV-viewing for all quartiles of physical activity. Median upper boundary for Q1–Q3 and lower boundary for Q4 in MET-hour/week. The equivalent amount of time spent in moderate intensity activity are ≈5 min/day (Q1); 25–35 min/day (Q2); 50–65 min/day (Q3) and 60–75 min/day (Q4).
The results for the associations between sitting time and cancer mortality stratified by levels of physical activity are shown in figure 3. There were no clear dose–response relationships between total sitting time and cancer risk. However, in the lowest quartile of physical activity (<2.5 MET-hour/week), there was a clearly increased risk for cancer mortality in the highest sitting category (HR=1.21, 95% CI 1.14 to 1.28) and less marked increases in those who sat for 4 to <6 hour/day (HR 1.08, 95% CI 1.02 to 1.14) or 6–8 hour/day (HR 1.06, 95% CI 1.00 to 1.11; p for trend=0.85). In the second physical activity quartile, those who reported sitting for >8 hour/day also had increased risk of cancer mortality (HR 1.08, 95% CI 1.00 to 1.15; p for trend=0.70). Sensitivity analyses in a subsample of studies, in which sitting time was stratified into five groups, confirmed some, but not all, of these results (online Supplementary table 2).

Meta-analysis of the stratified associations between sitting time (n=777 696; 30 851 deaths) and cancer mortality. The reference categories are the groups with <4 hour/day of sitting or <1 hour/day of TV viewing for all quartiles of physical activity. Median upper boundary for Q1–Q3 and lower boundary for Q4 in MET-hour/week. The equivalent amount of time spent in moderate intensity activity are ≈5 min/day (Q1); 25–35 min/day (Q2); 50–65 min/day (Q3) and 60–75 min/day (Q4).
We then examined the associations between TV-viewing time and cancer mortality (figure 4). As for the CVD results, there were clear dose–response relationships between TV time and cancer risk, but there were no significantly increased risks for cancer mortality by increasing TV time in either the ‘inactive’ or most active quartiles of physical activity. In the second and the third quartiles of physical activity, TV viewing for >5 hour/day increased the hazard for cancer mortality by 18% (HR=1.18; 95% CI 1.04 to 1.34; p for trend <0.001) and 29% (HR=1.29, 95% CI 1.10 to 1.51; p for trend <0.001).

Meta-analysis of the stratified associations between TV-viewing time (n=458 091; deaths=16 430) and cancer mortality. The reference categories are the groups with <4 hour/day of sitting or <1 hour/day of TV viewing for all quartiles of physical activity. Median upper boundary for Q1–Q3 and lower boundary for Q4 in MET-hour/week. The equivalent amount of time spent in moderate intensity activity are ≈5 min/day (Q1); 25–35 min/day (Q2); 50–65 min/day (Q3) and 60–75 min/day (Q4).
Discussion
We previously reported on the associations between sedentary behaviours with all-cause mortality, stratified by levels of physical activity, and observed that these associations were eliminated in the most active quartile.9 Here we extend these observations to the two leading causes of death, CVD and cancer mortality (28.9% and 35.6% of all deaths in the included studies, respectively).9
These results, which comprise one of the most comprehensive data sets to date on the associations between sedentary behaviours and cause-specific mortality, indicate that physical activity modifies the associations between sedentary behaviours and CVD mortality. The increased risks for CVD mortality with higher sitting and TV-viewing time were particularly pronounced in the lowest, ‘inactive’ quartile of physical activity. No association between sedentary behaviours and CVD mortality was observed in the most active quartile of physical activity.
The patterns of associations between both sitting time and TV-viewing with cancer mortality were less consistent. However, as for CVD mortality, there were no associations between either sitting time or TV time and cancer mortality in the highest physical activity quartile, and surprisingly, no association between TV time and cancer mortality in the lowest physical activity category either. There were, however, indications of increased risk in those who reported more than 5 hours per day of TV time in the two middle quartiles of physical activity.
Previous meta-analyses have suggested that sedentary behaviours are associated with both CVD1 6 20 and cancer mortality,1 3–6 leading some to conclude that sedentary behaviours are associated with CVD and cancer mortality independent of physical activity.1 6 21 However, effect sizes in the individual studies included in previous meta-analyses were usually entered by comparing extreme groups (eg, <5 hour/day vs ≥10 hour/day of sitting), some without adjustment for important confounders such as body mass index and without prior harmonisation of exposure variables. Using a harmonised meta-analytical approach, including a uniform categorisation of sedentary behaviours and physical activity, enabled us to examine these associations with greater precision than has previously been possible. Our more refined stratified analyses suggest that, where associations with CVD and cancer mortality are evident (ie, for both sitting time and TV time and CVD and for sitting and cancer), they are eliminated in those who are highly active (top quartile).
Our observations, which suggest that the associations between sitting time and CVD mortality differ by levels of physical activity, are supported by recent studies,22 23 which also question the hypothesis that the detrimental effects of prolonged sitting are truly independent of physical activity.1 6 21 A recent comprehensive meta-analysis on the associations between sedentary behaviours and all-cause, CVD and cancer mortality suggested an increased hazard of 1%–2% per hour of sitting time ‘independent’ of physical activity.6 However, our approach addresses a different question; that is, whether the associations between sedentary behaviours and mortality are different in different groups of physical activity. Our results suggest that sitting time is unrelated with CVD mortality in those who belong to the top quartile of physical activity and with cancer mortality in the upper half of the population, suggesting that sedentary behaviours are indeed dependent on the amount of physical activity.
The results presented here are comparable with our previously reported stratified associations between sitting time and TV-viewing time with all-cause mortality.8 However, the effect sizes for the associations between sitting and cancer mortality relationships were somewhat weaker than those reported previously for all-cause mortality, and those reported here for CVD mortality. This could reflect a greater overall heterogeneity of associations when different cancer types are grouped together, as the associations between activity-related behaviours and cancer differ by types of cancer.24 Further, the associations between physical activity and cancer mortality are generally weaker than between physical activity and CVD mortality.25
As was the case in the previous meta-analysis for all-cause mortality,8 there was greater heterogeneity when TV time was used as the indicator of sedentary behaviour. This may be explained by typically different patterns of sitting, with more breaks or concomitant activities (eg, household tasks) when watching TV, than when sitting during transport and while at work.
The limitations of our meta-analysis are similar to those reported previously.8 They include: little generalisability beyond high-income countries; no stratification by sex; residual confounding due to unmeasured or poorly measured confounders in the original studies and publication bias. Further, physical activity and sedentary behaviours were self-reported and may be prone to reporting bias. A non-differential measurement error can bias the associations both upwards and downwards.26 However, a recent study, which used accelerometry to quantify sedentary time and physical activity partly supports our observations. It found a strong inverse association between MVPA and mortality but no direct association between sedentary time and mortality.27 Unfortunately, we were not able to examine associations between light intensity physical activity and mortality, which have recently been suggested to be associated with mortality.28 Future meta-analyses combining data from studies using objective assessment methods are warranted to further understand the independent associations and modifying effects on mortality across the entire intensity spectrum. Particular strengths of our study include the large sample size, harmonisation of exposure variables at study level29 and inclusion of apparently healthy individuals at baseline to minimise bias from reverse causation.
Our observations may have important implications for public health and provide support for the Australian physical activity guidelines,6 and the US guidelines which recommend 300 min/week of moderate intensity activity ‘for even greater health benefits’.30 Further, the 2018 Physical Activity Guidelines Advisory Committee Scientific Report acknowledges that ‘Individuals who perform no or little moderate-to-vigorous physical activity, no matter how much time they spend in sedentary behaviour, can reduce their health risks by gradually adding some or more moderate-intensity physical activity’.31
Our observations add further support to this statement.
In summary, prolonged sedentary time has consistent adverse effects in those with low levels of physical activity, but these effects are eliminated in those who meet or exceed the 1 hour/day guideline. For those in the intermediate (second and third) quartiles of moderate-vigorous activity, there is also protection from the adverse consequences of sitting, but not among those who are in the highest daily sitting category (more than 8 hours/day).
We conclude that physical activity modifies the associations between sedentary behaviours and CVD and cancer mortality. These findings add further weight to the importance of emphasising higher volumes of moderate and vigorous activity, especially for those who are unable to avoid large amounts of sitting in their daily lives.
What are the findings?
The associations between sedentary behaviours and cardiovascular disease and cancer mortality are modified by physical activity.
Prolonged sedentary time has consistent adverse effects in those with low levels of physical activity, but these effects are clearly eliminated in those who meet or exceed 1 hour of at least moderate intensity physical activity per day.
For those who do less moderate-vigorous activity, there is also protection from the adverse consequences of sitting, but not among those who sit for more than 8 hours per day.
How might it impact on clinical practice in the future?
Public health guidelines on physical activity should consider integrating this evidence and may provide specific recommendations for physical activity based on amounts of daily sitting time.
Until such recommendations are established a general recommendation ‘sit less—move more—and the more the better’ seems sensible for all.
Acknowledgments
We are grateful to the following individuals who generously contributed with their time and efforts when reanalysing individual study level data: Mette Aadahl (Department of Public Health, Faculty of Health Sciences, University of Copenhagen, Copenhagen, Denmark), William J Blot (Department of Medicine, Vanderbilt University Medical Center and Vanderbilt-Ingram Cancer Center, Nashville, Tennessee, USA), Tien Chey (Sydney School of Public Health, University of Sydney, Sydney NSW, Australia), Anusila Deka (Epidemiology Research Program, American Cancer Society, Atlanta, Georgia, USA), David Dunstan (Baker IDI Heart and Diabetes Institute, Melbourne, VIC, Australia), Earl S Ford (Division of Adult and Community Health, National Center for Chronic Disease Prevention and Health Promotion, Centers for Disease Control and Prevention, Atlanta, Georgia, USA), Kristine Farch (Steno Diabetes Center, Gentofte, Denmark), Manami Inoue (Epidemiology and Prevention Division, Research Center for Cancer Prevention and Screening, National Cancer Center, Tokyo, Japan), Peter T Katzmarzyk (Pennington Biomedical Research Center, Baton Rouge, Los Angeles, USA), Sarah Kozey Keadle (Nutritional Epidemiology Branch, Division of Cancer Epidemiology and Genetics, National Cancer Institute, Bethesda, USA), Charles E Matthews (Nutritional Epidemiology Branch, Division of Cancer Epidemiology and Genetics, National Cancer Institute, Bethesda, Mary Land, USA), David Martinez (Preventive Medicine and Public Health School of Medicine Universidad Autonoma de Madrid, Madrid, Spain), Alpa V Patel (Epidemiology Research Program, American Cancer Society, Atlanta, Georgia, USA), Toby Pavey (School of Exercise and Nutrition Sciences, Queensland University of Technology, Brisbane, QLD, Australia), Christina Bjork Petersen (National Institute of Public Health, University of Southern Denmark, Copenhagen, Denmark), Hidde Van Der Ploeg (Department of Public and Occupational Health, VU University Medical Center Amsterdam, Amsterdam, Netherlands), Vegar Rangul (HUNT Research Centre, Faculty of Health Science Nord-Troendelag University College Levanger, Namsos, Norway), Parneet Sethi (Baker IDI Heart and Diabetes Institute, Melbourne, VIC, Australia), Erik R Sund (HUNT Research Centre, Faculty of Health Science Nord-Troendelag University College Levanger, Namsos, Norway), Kate Westgate (MRC Epidemiology Unit, University of Cambridge, Cambridge, UK), Katrien Wijndaele (MRC Epidemiology Unit, University of Cambridge, Cambridge, UK), Song Yi-Park (Cancer Epidemiology Program, University of Hawaii Cancer Center, Honululu, Hawaii, USA). In addition to data from all the contributing studies, this manuscript was prepared using WHIOS Research Materials obtained from the NHLBI Biologic Specimen and Data Repository Information Coordinating Center and does not necessarily reflect the opinions or views of the WHIOS or the NHLBI.
References
Footnotes
Contributors All authors contributed to the design of the study, generated hypotheses, interpreted the data and wrote and critically reviewed the report. UE lead the work of the writing group and wrote the first draft of the manuscript. JS-J and UE did the literature search. MWF analysed the data. MWF, JS-J, and UE had full access to study level data from all contributing studies.
Funding The authors have not declared a specific grant for this research from any funding agency in the public, commercial or not-for-profit sectors.
Competing interests None declared.
Ethics approval This is a systematic review and meta-analysis of studies which all have been individually approved by their respective ethical review boards.
Provenance and peer review Not commissioned; externally peer reviewed.
Data sharing statement We can not share any data as we do not have access to individual level data from participating studies.