Article Text

Abstract
Background Green space is widely hypothesised to promote physical activity. Few studies, however, examine whether this is the case for walking and moderate-to-vigorous physical activity (MVPA). We investigated to what extent neighbourhood green space was associated with weekly participation and frequency of walking and MVPA in a large cross-sectional survey of Australian adults 45 years and older.
Methods Logit and negative binomial regression were used to estimate the degree of association between walking, MVPA and neighbourhood green space in a sample of 203 883 adults from the Australian 45 and Up Study. Walking and MVPA were measured using the Active Australia Survey. Green space was measured as a percentage of the total land-use within 1 km radius of residence. We controlled for a range of individual and neighbourhood characteristics.
Results 86.6% of the sample walked and 85.8% participated in MVPA at least once a week. These rates fell steeply with age. Compared with residents of neighbourhoods containing 0–20% green space, those in greener areas were significantly more likely to walk and participate in MVPAs at least once a week (trend for both p<0.001). Among those participating at least once a week, residents of neighbourhoods containing 80%+ green space participated with a greater frequency of walking (incidence rate ratio (IRR) 1.09, 95% CI 1.05 to 1.13) and MVPA (IRR 1.10, 95% CI 1.05 to 1.15).
Conclusions Our findings suggest that the amount of green space available to adults in middle-to-older age within their neighbourhood environments could help to promote walking and MVPA.
- Epidemiology
Statistics from Altmetric.com
Introduction
Recent studies have associated parks and other natural environments (or ‘green spaces’) with a variety of self-rated health statuses and causes of death.1–3 Contact with green space through physical activity has been widely thought of as a potentially causal mechanism, though evidence is equivocal.4–12 Few of these studies, however, use measures which classify types of physical activity by intensity (eg, walking vs more energetic pursuits, such as running). This distinction is important not only because frequent moderate-to-vigorous physical activities (MVPAs) are known to convey more substantial health benefits than those of a gentler sort,13 but also contrasting dose–responses (eg, curvilinear, as opposed to linear trends) to green space exposure may occur for physical activities of different intensities. We first examined to what extent living in greener neighbourhoods was associated with the likelihood of participating in walking and MVPA at least once a week. We then investigated among those participants whether more green space was associated with a greater frequency of walking and MVPA.
Method
Data
We studied 203 883 people with complete data on physical activity (the outcome variable, details mentioned below) from 267 151 participants in the 45 and Up Study.14 A baseline questionnaire (available online from http://www.45andup.org.au) was issued to adults of 45 years and older that were randomly selected from the Medicare Australia database (the national provider of universal health insurance) between 2006 and 2009. The survey had a response rate of 18%. Participants were asked about a range of health and social issues including physical activity. Participants were geocoded at the scale of Census Collection Districts (CCD); the smallest geography for which 2006 Census data were available15 (containing 225 people on average 16). Valid CCD geocodes were missing for 9% of the participants. These were assigned the CCD nearest to the population-weighted centroid of their postcode of residence, to allow a consistent proxy for neighbourhood across the full sample. Missing data for independent variables were resolved via imputation. The University of New South Wales Human Research Ethics Committee approved the 45 and Up Study.
Outcome measures
The baseline questionnaire assessed physical activity using the variables derived from the Active Australia Survey,17 which has satisfactory levels of test–retest reliability.18 Time spent in moderate and vigorous physical activities, as well as walking (continually for at least 10 min), was each measured separately. Time spent in vigorous activities was adjusted by a factor of two in recognition of the greater benefits for health.17 Moderate and vigorous activities were summed into a single variable, while walking was kept separate. Responses to these variables were missing for 63 189 people and these were omitted from our analyses.
Green space
Data on green space were derived from the Australian Bureau of Statistics Meshblock classification.19 Meshblocks typically contain between 30 and 60 dwellings and were classified according to their main land use. We extracted all Meshblocks categorised as parkland for our measure of green space, omitting those classified as agricultural as they generally do not represent publically available spaces for physical activity or recreation. To construct the measure of green space, we placed a buffer of 1 km radius around the population-weighted centroid of each CCD and calculated the percentage taken up by green space. This approach has been used in previous research.7
Other explanatory measures
We adjusted for a range of variables which have been previously related to physical activity. These included age, gender, ethnicity, country of birth, body mass index, annual household income, highest educational qualifications, economic status (employed, unemployed, retired, inactive), couple status, psychological distress (Kessler score20), number of hours in the past week spent outdoors, language other than English spoken at home, measures of social interactions taken from the Duke Social Support Index,21 neighbourhood affluence (measured using percentiles of the Socio-Economic Index for Areas) and geographic remoteness (measured using the ‘Accessibility/Remoteness Index of Australia’).
Statistical analysis
Separate logit regression models were used to test the association between walking or MVPA at least once a week and the measure of green space, adjusting for other explanatory variables. We then selected those participants affirming one session or more of walking or MVPA to test whether those in greener neighbourhoods participated with greater frequency. Most people reported lower frequencies of walking and MVPA, which led to heavily skewed distributions. As the participants in the second stage of analysis were those who took part in physical activities at least once a week, we used a zero-truncated negative-binomial regression model. Huber-White SEs.22 ,23 Statistically significant associations were identified using the log-likelihood ratio test (p<0.05). All analyses were conducted in STATA V.12.
Results
Descriptive analyses showed that 53.2% of the sample was female and the mean age was 61.5. Most participants (68.1%) lived in areas with less than 20% green space, while only 2.6% were resident in neighbourhoods with over 80% green space. In total, 80.6% of the sample lived in urban areas, 55% were employed and 32% were retired, and 18% lived on annual household income less than $20 000. A total of 86.6% walked at least once a week, and 85.8% participated in MVPA at least once a week.
Among participants with 0–20% green space, the prevalence of walking was 86% and MVPA 86%, compared with 88% and 90%, respectively, for those in the greenest areas. Separate age–gender adjusted logit regression suggested a 6% increase in the odds of weekly walking (OR 1.06, 95% CI 1.05 to 1.08) and 8% increase in the odds of weekly MVPA (OR 1.08, 95% CI 1.07 to 1.10) for a 20% increase in the level of neighbourhood green space. Figure 1 illustrates this linear trend persisted after full adjustment.

Likelihood of participating at least once a week in walking continuously for 10 min (top) and moderate-to-vigorous physical activity (below) by the availability of local green space (0–20% green space is the reference group). *Logit regression models adjusted for age, gender, age×gender, annual household income, economic activity, couple status, mental health, ethnicity, country of birth, language spoken at home, time spent outdoors during the week, time spent outdoors during the weekend, social interactions, local affluence and geographical remoteness. Clustering is accounted for using robust SEs.
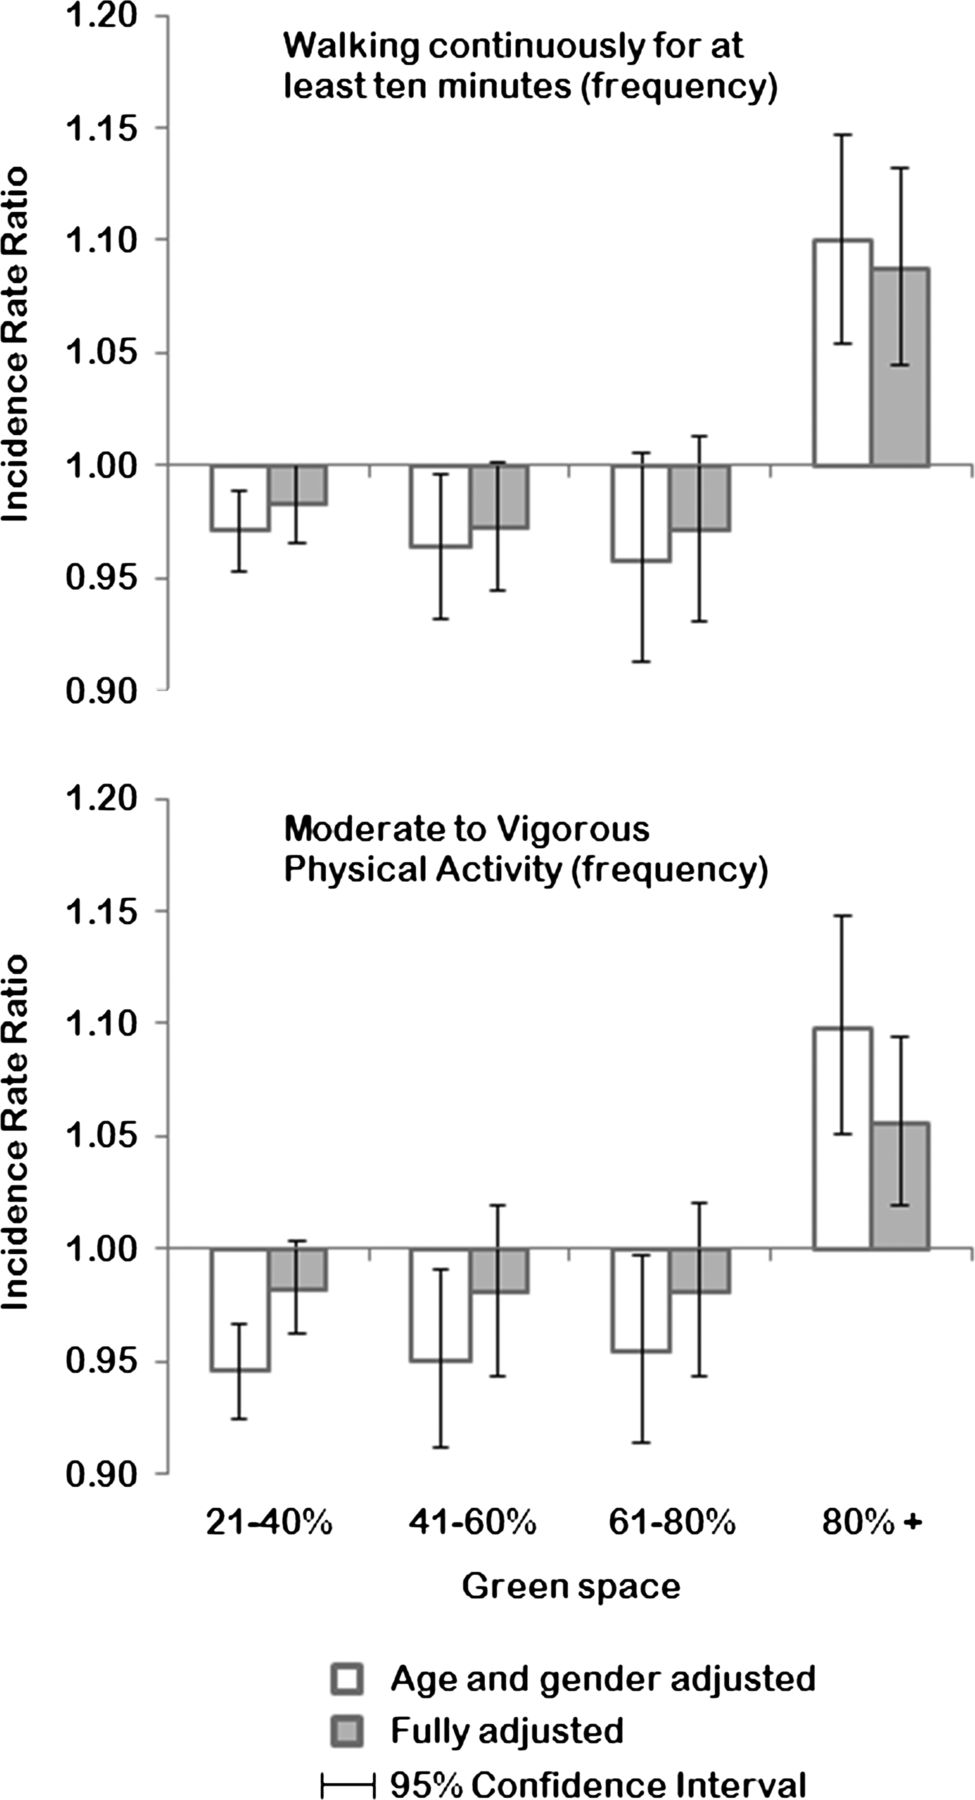
The next stage of our analysis was to select those who walked or took part in MVPA at least once a week to test whether more green space was associated with more frequent participation. Participants in the least green areas walked 6.4 times and participated in 9 sessions of MVPA, compared with 7 and 9.9, respectively, for those in the greenest areas. Separate age–gender adjusted models revealed no linear trend (p>0.05). However, as figure 2 shows, residents of neighbourhoods containing 80%+ green space did participate in walking and MVPAs more frequently than those in all other green space categories.
Frequency of weekly participation in walking continuously for 10 min (top) and moderate-to-vigorous physical activity (below) by the availability of local green space (0–20% green space is the reference group). *Zero-truncated negative binomial regression models adjusted for age, gender, age×gender, annual household income, economic activity, couple status, mental health, ethnicity, country of birth, language spoken at home, time spent outdoors during the week, time spent outdoors during the weekend, social interactions, local affluence and geographical remoteness. Clustering is accounted for using robust SEs.
Discussion
Adults in middle-to-older age tend to report the lowest levels of physical activity, the greatest burden of chronic disease and the most frequent use of health services. Identifying whether green space promotes physically active lifestyles in this large age group constitutes important information for urban planners and health policymakers.24 ,25 Our study enhances prior understanding by demonstrating that greener neighbourhood environments were not only associated with the likelihood of walking and MVPA once a week, but also with a greater frequency of participation in each activity for those in the greenest areas.
These findings suggest that access to green space is a potentially important lever for participation in physical activities at a population level. Most notable were the similar effects observed for walking and MVPA, which has not been previously demonstrated. While MVPA is correctly identified within guidelines as the most beneficial for health,13 evidence linking sitting time with chronic diseases26 suggests that green spaces may also have an important role to play in public health just by encouraging more walking.
Dose–response relationships were linear for walking and MVPA at least once a week, though non-linear for greater frequencies of physical activity. The more frequent walking and MVPA reported among residents of the greenest areas suggest a threshold-type effect, wherein a certain level of exposure is needed to induce more frequent participation. Previous work, for example, has demonstrated that larger green spaces are more attractive for walking.10 Size, however, may also be correlated with other measures of quality that we could not measure (eg, path maintenance), but could be important for determining participation.27–29 Given the implications for policy, the issue of green space quality as a modifier of physical activity warrants further investigation.
Validated measures of physical activity and large sample size are the strengths of our study. Objectively measured green space also avoids the reliance upon self-report measures used by some studies.8 The questions on physical activity were limited to participation within the week prior to completing the questionnaire, though it is possible that results may differ if recall is shortened (eg, 2–3 days) or extended (eg, 1 month). The 18% response rate to the 45 and Up Study was low, though a recent paper has argued that results can still be broadly comparable to those derived from nationally representative data.30 Causal inference is limited by the cross-sectional study design, though follow-up of these participants will offer opportunities to corroborate our findings in the future.
Conclusion
Greener neighbourhoods are associated with weekly participation in walking and MVPA in middle-to-older-aged adults. Participation in walking and MVPA was more frequent among residents of neighbourhoods containing a large amount of green space.
What this study adds
-
This study adds novel understanding of the extent that living in greener neighbourhoods promotes not only weekly participation, but also more frequent sessions of walking and moderate-to-vigorous physical activities in middle-to-older-aged adults.
Acknowledgments
We would like to thank all the men and women who participated in the 45 and Up Study. The 45 and Up Study is managed by the Sax Institute in collaboration with major partner Cancer Council New South Wales; and partners the Heart Foundation (NSW Division); NSW Ministry of Health; beyondblue: the national depression initiative; Ageing, Disability and Home Care, NSW Family and Community Services; and the Australian Red Cross Blood Service. We acknowledge the use of 2006 census and boundary data provided by the Australian Bureau of Statistics. To preserve the anonymity of participants in the 45 and Up Study, some parameters of the Census Collection District (CCD) level data could not be reported. This location-indexing data from the 45 and Up Study is highly restricted access and will be made available only through SURE (http://www.sure.org.au/).
References
Footnotes
-
Contributors TA-B, XF and GSK designed the analyses for the study, who utilised an existing dataset. TA-B carried out the analyses and wrote the manuscript. All authors have commented on, edited and approved the final draft of the manuscript. TA-B is the guarantor.
-
Competing interests None.
-
Provenance and peer review Not commissioned; externally peer reviewed.