Article Text

Abstract
In this two-part series on sources of bias in studies of diagnostic test performance, we outline common errors and optimal conditions during three study phases: patient selection, interpretation of the index test and disease verification by a gold standard. Here in part 1, biases associated with suboptimal participant selection are discussed through the lens of partial verification bias and spectrum bias, both of which increase the proportion of participants who are the ‘sickest of the sick’ or the ‘wellest of the well.’ Especially through retrospective methodology, partial verification introduces bias by including patients who are test positive by a gold standard, since patients with a positive index test are more likely to go on to further gold standard testing. Spectrum bias is frequently introduced through case–control design, dropping of indeterminate results or convenience sampling. After reading part 1, the informed clinician should be better able to judge the quality of a diagnostic test study, its inherent limitations and whether its results could be generalisable to their practice. Part 2 will describe how interpretation of the index test and disease verification by a gold standard can contribute to diagnostic test bias.
- imaging
- research, methods
- statistics
- ultrasound
Statistics from Altmetric.com
Introduction
You are working on shift in a busy ED and a 38-year-old woman with sudden-onset, tearing chest pain radiating to her back arrives via private vehicle. She has a father who died in his 40s of myocardial infarction, but otherwise has no cardiac risk factors and is not on any hormonal therapy. Apart from hypertension, she has an unremarkable physical exam, and a non-specific repolarisation abnormality in the V2-5 leads of her ECG. Her first troponin is negative and she is currently in no pain.
The description of her pain is concerning for a thoracic aortic dissection (TAD), however you do not want to expose the patient to unnecessary radiation, and you are wondering about alternatives to CT for excluding TAD, including quantitative D-dimer. You recall one of your colleagues recently asking, ‘Is D-dimer for dissection ready for use in clinical practice?’
The importance of recognising bias
Prior to deciding whether to use the D-dimer test, you may want to review relevant studies that quantify the test’s characteristics. To arrive at test characteristics, a study on diagnostic tests compares an index test (a diagnostic test whose performance is being evaluated) with the gold standard (the test which verifies the presence or absence of true disease). However, introduction of bias in a study can lead to overestimates or underestimates of true test characteristics and ultimately clinical errors on application.1 Returning to our example of D-dimer tests, a biased study that underestimates rate of false negative D-dimer results could lead to a missed diagnosis of TAD. Similarly, a biased study that underestimates the rate of false positive D-dimer results could lead clinicians to pursue testing that may expose patients to unnecessary radiation.
Although numerous sources of bias have been identified in prior reviews, this series focuses only on those that have been empirically shown to affect test characteristics. Specifically, this article primarily addresses the impact of patient selection on diagnostic test characteristics (table 1), whereas a second article in the series will address bias resulting from errors in misapplication of analyses of the index or verification tests.2
Types of biases introduced through diagnostic testing
Ideal diagnostic test accuracy study methods
Studies of diagnostic tests in ideal circumstances are designed to minimise bias by first including consecutive patients (or a random selection of patients) at risk for the condition of interest and reporting on how participants were recruited (eg, based on presenting symptoms, results from previous tests, or whether they received the index test) to yield an appropriate spectrum of patients at risk for the target condition that are generalisable to clinical practices. Ideal studies then apply the index test and gold standard to all participants, and finally compare the results in a blinded fashion.2 3
To highlight ways in which non-ideal testing may lead to bias, a method for reporting studies of diagnostic tests has been outlined in the Standards for Reporting Diagnostic Accuracy (STARD) checklist, a 30-item best practice checklist to report.2 The STARD guidelines encourage clarity of reporting in each section of the study, and allow for easy identification of studies that are at low and high risk of bias.
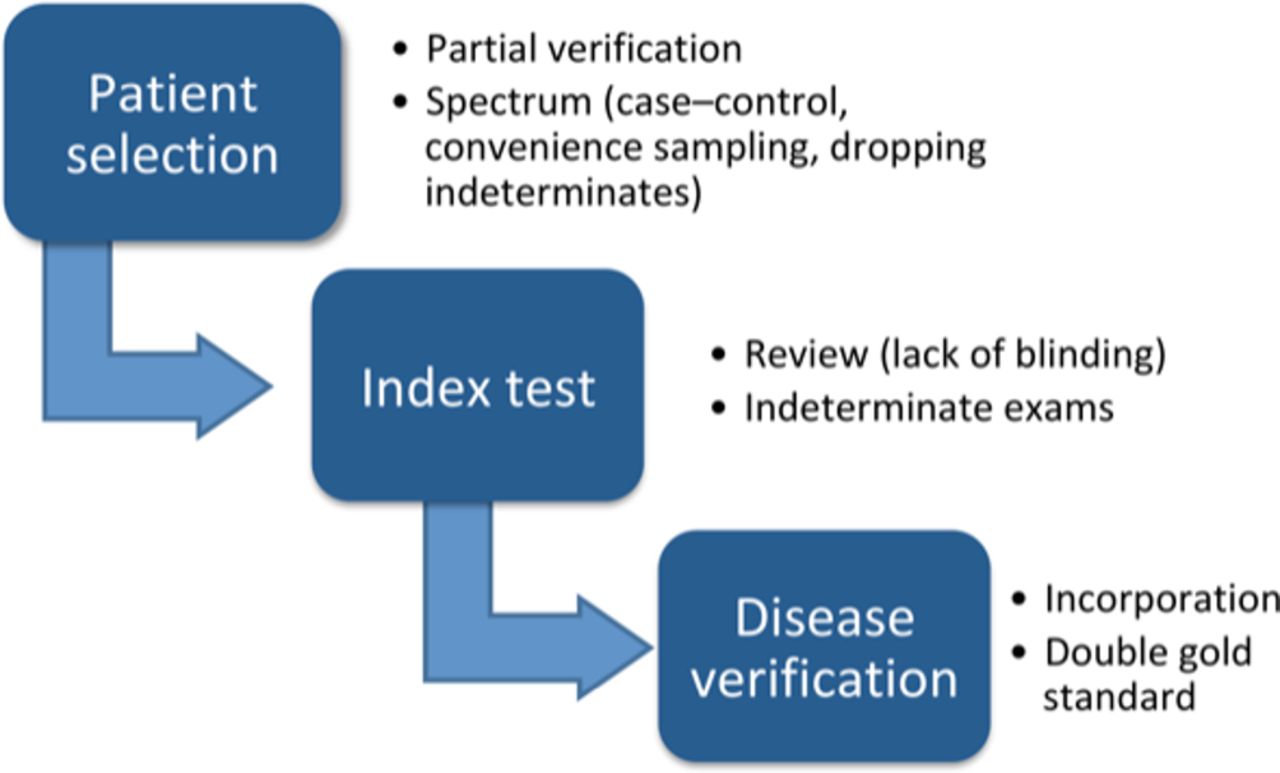
However, investigators are not always able to design and conduct studies of diagnostic tests that satisfy all of the methodological standards due to real-world limitations, such as budget limitations, rare diseases, or the inability to apply an index test or gold standard test in a consecutive sample (Figure 2).4 While most studies of diagnostic tests are cross sectional, when the disease outcome is rare, a cross-sectional study may not be feasible, and investigators may choose to use a case–control study design resulting in spectrum bias (see the Spectrum bias section). Thus, it may be impossible to conduct a particular study in a manner that is completely free of bias.
Defining sensitivity, specificity, likelihood ratios and predictive values
Before discussing how bias influences test characteristics, it is important to define sensitivity, specificity and predictive values. Sensitivity (the proportion of true positives among those with the disease) and specificity (the proportion of true negatives among those without the disease) are standard measures to report in diagnostic studies. Whereas sensitivity and specificity measure the value of a diagnostic test, it is more clinically useful to know how well a particular test predicts the risk of disease by using likelihood ratios that allow for application of sensitivity and specificity to a particular patient scenario (figure 1). A positive likelihood ratio can be defined as the probability that a person with the disease tested positive (true positive) divided by the probability that a person without the disease tested positive (false positive), and a negative likelihood ratio is the probability of a person who has the disease testing negative (false negative) divided by the probability of a person who does not have the disease (true negative) testing negative. However, for likelihood ratios to be useful, pretest probabilities need to be known or estimated. If known, the pretest probability can be multiplied by either the positive or negative likelihood ratio to determine the post-test probability of disease.5–7
Notably, sensitivity and specificity are not dependent on the prevalence of disease within most studies. However, these measures are susceptible to bias arising from suboptimal patient selection, as described in this article. In contrast to sensitivity, specificity and likelihood ratios, positive predictive value (PPV) and negative predictive value (NPV) are dependent on the population prevalence or pretest probability.6 Therefore, when applying tests from a published study to clinical practice, differences between study populations should be considered. PPV represents the proportion of diseased participants with a positive test result. NPV represents the proportion of non-diseased among participants with a negative test result (figure 1, 2×2 table).
An example of the dependence of PPV on prevalence is rapid HIV testing. The US Preventive Services Task Force has recommended that routine HIV screening take place in sites with an HIV prevalence greater than 0.1%, and to avoid screening in lower prevalence settings, as rapid testing is associated with a lower PPV.8 For example, if at a theoretical county hospital, the pretest probability (prevalence) of HIV disease is higher than at a quaternary referral hospital in the same city, then the PPV would be higher at the county hospital. In that case, HIV testing would be more useful in the county hospital because a positive test would be more likely to mean that a patient has true HIV+ disease. See table 2 as an example of changing PPVs based on prevalence.
Mechanism for introducing bias: suboptimal patient selection
In this article we describe how partial verification bias and spectrum bias result in a non-representative study population, thus hindering generalisability of the index test characteristics to new populations.
Partial verification bias
Partial verification bias (also called workup bias or referral bias) can be introduced when investigators select participants based on whether or not they have positive or negative gold standard test.1 This type of bias is surprisingly common because of the counterintuitive nature of partial verification—there is an erroneous assumption by investigators that enrolling patients with definitive verification of disease will clarify the condition being studied and the test of interest. This becomes problematic because patients are more likely to receive a gold standard test in real life if the index test is positive, thus artificially increasing true positives, and increasing sensitivity (see figure 1).1
For example, let us say that an investigator wants to study the test characteristics of a rapid triage test (facial droop) for detecting stroke among patients presenting with word finding difficulties. In ideal circumstances, studies of diagnostic accuracy should apply index testing and gold standard testing independently. Here, facial droop is the index test, and the gold standard is an MRI. Partial verification bias is introduced if the investigators start with all patients in the last year with MRI-confirmed cerebrovascular accidents (CVA) and describe the test characteristics of facial droop at predicting CVAs among patients with word finding difficulties, since a higher proportion of patients with unilateral facial droop are more likely to get a diffusion-weighted MRI (the gold standard verification test) of their brain than patients without unilateral facial droop. If some of these facial droop negative patients had strokes, but are not included in the study, then the resulting partial verification bias leads to fewer false negatives, increasing the sensitivity of facial droop as a screening test (see figure 1).
Partial verification bias could be avoided in this group of patients by either performing MRI on random sample of people with suspected stroke who test negative for the facial droop test, or by defining a group of patients as suspected stroke, and performing the gold standard MRI on all patients who receive the index facial droop test, regardless of the presence or absence of facial droop. Since MRI is expensive and at times difficult to obtain, this example highlights real-world limitations often imposed on studies of new diagnostic tests.
Spectrum bias
In clinical practice, patients may present with symptoms that range from minimal to typical or severe and suggestive of a diagnosis. For example, a patient with signs of a unilateral swollen right leg, a palpable cord and recent history of a knee replacement clearly evokes the diagnosis of deep vein thrombosis. A more subtle presentation, however, might be calf pain with minimal swelling and tenderness. Clinicians see a broad continuum of disease and health in their practice, and investigators should strive to include participants who mirror this spectrum of disease in studies of diagnostic tests. Spectrum bias occurs if the spectrum of disease deviates significantly from clinical practice or excludes ambiguous results and may occur via (1) a case–control design, (2) exclusion of indeterminate patients, or (3) convenience sampling.1
Spectrum bias due to case–control design
In a case–control study, the group known to have the outcome (cases) and the group known to be free of the outcome (controls) are assembled, and an index test is applied. This is a more efficient design compared with a cross-sectional study, in which all of those who are at risk for the outcome are enrolled consecutively. In rare diseases, cross-sectional studies may be infeasible.
However, by selecting a case–control design, an investigator may introduce bias by failing to include a diverse group of patients that represent the full spectrum of disease. Consider this hypothetical study in which researchers wish to ascertain whether right lower quadrant tenderness to percussion is useful in the diagnosis of appendicitis in children. The investigators decide to conduct a retrospective case–control study at a paediatric ED to determine the sensitivity and specificity of tenderness to percussion as the index test. They select their cases from electronic health record operative reports: the cases are those children with appendicitis on pathology. For controls, they select age and gender-matched children who present to the paediatric ED with abdominal pain who are discharged without a diagnosis of appendicitis. They find that the sensitivity and specificity of tenderness to percussion are 90% and 98%, respectively.
Case–control design may result in the largest magnitude of any biases that will be discussed.4 By including the ‘sickest of the sick,’ they will falsely elevate sensitivity.1 5 9 Conversely, by including the ‘fittest of the fit,’ specificity estimates will be elevated by over-representing healthy true negatives.1 5 9 In this example, the investigators could have done a better job matching the controls to the participants who were admitted and had a positive appendectomy. For example, they should have included those with a negative laparotomy, or those admitted with other diagnoses. By selecting age-matched patients discharged home, the controls were likely ‘the fittest of the fit.’
Spectrum bias due to dropping indeterminate subjects
Ignoring participants with indeterminate test results may also result in spectrum bias.10 Imagine a hypothetical study of point-of-care ultrasound for detection of flash pulmonary oedema due to acute decompensated heart failure (ADHF) using the presence of B-line artefacts on a clinician-performed ultrasound. Investigators have used the presence of three or more B-lines in two or more rib spaces bilaterally to define a positive index test for diffuse interstitial oedema,11 but the number of B-lines exists as a continuum and more or fewer B-lines may be present depending on disease severity. There may be borderline cases; perhaps there are only two B-lines per rib space on one side, but many on the contralateral side, all with poor image quality due to body habitus or a high patient acuity situation.
If an investigator drops indeterminate or technically difficult cases from the analysis, the study will be at risk of spectrum bias by excluding patients who are ADHF positive with mild disease who would more likely be classified as falsely negative due to fewer B-lines, and ADHF-negative patients with a mimicking disease (such as influenza causing B-lines12) who would be classified as falsely positive.1 Referencing table 2, dropping of indeterminate results boosts sensitivity and specificity by decreasing the denominator of each equation (see figure 1, 2×2 table).
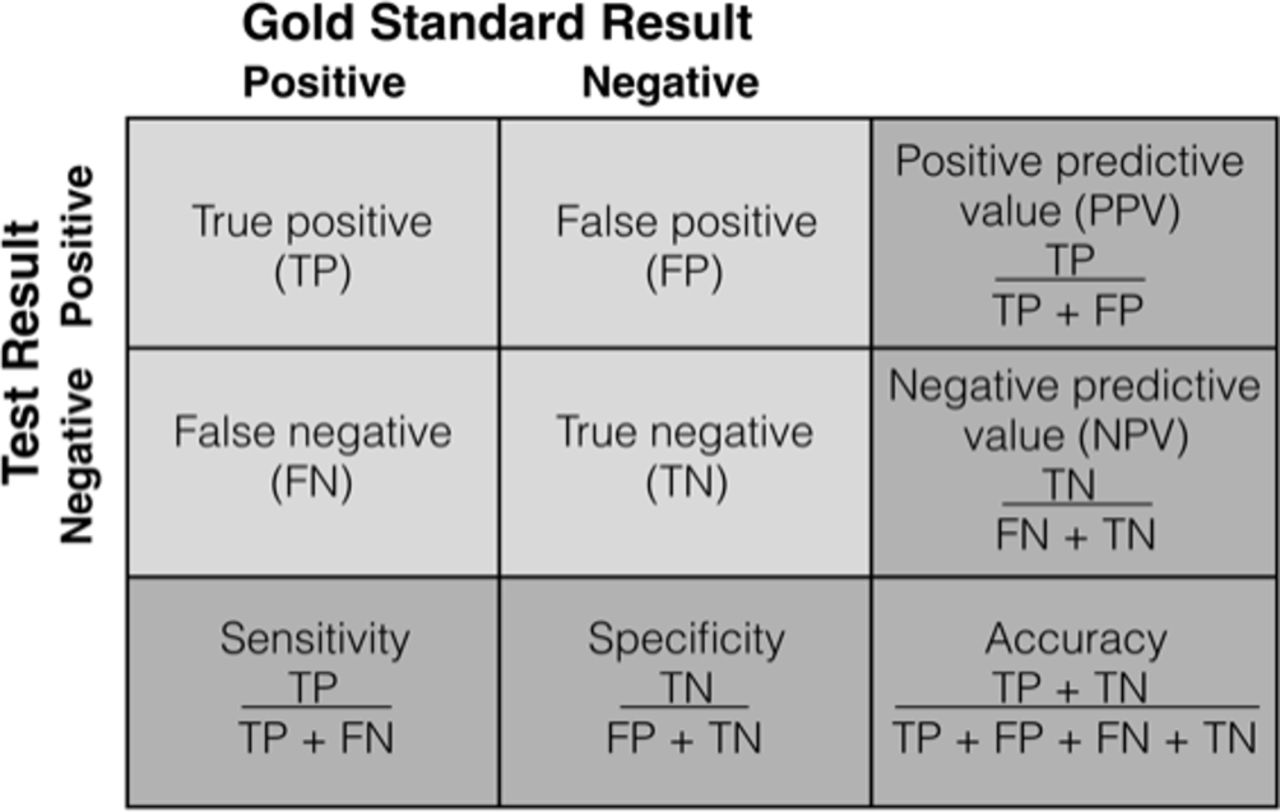
2×2 Table and test characteristic formulas. FN: number of subjects with disease and negative index test result. FP: number of subjects without disease and positive index test result. TN: number of subjects without disease and negative index test result. TP: number of subjects with disease and at positive index test result. Negative likelihood ratio=1−Sn/Sp. Positive likelihood ratio=Sn/1−Sp.
2×2 Table with changing predictive values dependent on prevalence
Spectrum bias from convenience sampling
Using the same scenario of B-line ultrasonography for the diagnosis of ADHF, suppose participants are enrolled via a non-consecutive convenience sample. There may be systematic errors in patient selection that bias the results of the test, making the test appear more favourable.1 For example, investigators might avoid enrolling patients on whom the index test is difficult to perform, or would likely result in an indeterminate result. Similar to the above examples for spectrum bias due to dropping indeterminates, convenience sampling would result in falsely increased sensitivity or specificity, depending on which patients are excluded and their disease status.
Additional considerations contributing to spectrum bias from convenience samples include differential daytime and night-time resources (consider if the night-time ultrasound team is less experienced, resulting in a technically limited ultrasound exam or a greater proportion of indeterminate results) or differential daytime or night-time patients (eg, if patients with flash pulmonary oedema present more severely ill at night,13 resulting in increased sensitivity).
Summary
When evaluating studies of diagnostic performance, it is important to carefully consider the study methods, and in particular, how participants were selected. For example, in our original example of the patient with a suspected acute aortic syndrome, if the study of a serum D-dimer assay in relation to confirmatory CT testing uses appropriate selection methods and includes patients similar to your patient population, then the study is likely generalisable to your clinical context.
However, if bias in the evaluation of the D-dimer test was introduced due to real-world limitations or pragmatic decisions to overcome difficulties in patient enrolment due to the rarity of the acute aortic syndrome presentations, either of the following forms of bias through suboptimal patient selection may occur: (1) partial verification (referral) bias: starting with the gold standard test positive patients under the assumption that test positive patients might lead to ‘pure results,’ and (2) spectrum bias: the study cohort is not representative of the full spectrum of patients in generalisable clinical practice. Both partial verification bias and spectrum bias may lead to over-representation of study patients with more severe disease and health controls, leading falsely elevated sensitivity and specificity estimates.
Recognising biases of studies of diagnostic tests. The different stages of a study of diagnostic test are prone to certain types of biases.
References
Footnotes
Contributors MKH, BK and RW all conceived the review article and generated the original text. All authors drafted the article and contributed substantially to its revision. MKH takes responsibility for the paper as a whole.
Funding BK was supported by NHLBI K08 (grant number 1K08HL140105-01). MKH was supported by NASA Glenn Research Center and ZIN Technologies; NIDDK (grant number P01DK043881); and Emergency Medicine Foundation. RW was supported by UCSF–Learning Healthcare Systems Award.
Competing interests BK is site investigator for Ortho-Clinical Diagnostics.
Provenance and peer review Not commissioned; externally peer reviewed.
Patient consent for publication Not required.