Article Text

Abstract
Unscheduled return visits (URV) to the emergency department (ED) may be an important quality indicator of performance of individual clinicians as well as organisations and systems responsible for the delivery of emergency care. The aim of this study was to perform a rapid evidence assessment policy-based literature review of studies that have looked at URVs presenting to the ED. A rapid evidence assessment using SCOPUS and PUBMED was used to identify articles looking at unplanned returns to EDs in adults; those relating to specific complaints or frequent attenders were not included. After exclusions, we identified 26 articles. We found a reported URV rate of between 0.4% and 43.9% with wide variation in the time period defined for a URV, which ranged from 24 h to undefined. Thematic analysis identified four broad subtypes of URVs: related to patient factors, to the illness, to the system or organisation and to the clinician. This review informed the development of national clinical quality indicators for England. URV rates may serve as an important indicator of quality performance within the ED. However, review of the literature shows major inconsistencies in the way URVs are defined and measured. Furthermore, the review has highlighted that there are potentially at least four subcategories of URVs (patient related, illness related, system related and clinician related). Further work is in progress to develop standardised definitions and methodologies that will allow comparable research and allow URVs to be used reliably as a quality indicator for the ED.
- Emergency Care Systems, Emergency Departments
- Emergency Department Management
- Research, Methods
- Quality Assurance
Statistics from Altmetric.com
- Emergency Care Systems, Emergency Departments
- Emergency Department Management
- Research, Methods
- Quality Assurance
Introduction
The demand for emergency care in the UK has been steadily increasing. Recent data from the hospital episodes statistics showed that in 2012 there were 17.6 million attendances to emergency department (ED) as well as walk-in centres and minor injury units, and that this was an 8.5% increase on the 2010–2011 figures.1 Similar trends have also been observed in other westernised parts of the world, such as North America and Australia.2 Unscheduled return visits (URV) to the ED may present a significant additional workload, and signifies a potential area for improvement in care. Furthermore, as the NHS is looking to save over £20 bn over the next 3 years, commissioning bodies are looking closely at aspects of service delivery, such as URVs, which may not represent value for money. However, the reasons for return visits to the ED are complex and multifactorial involving disease progression, psychosocial, medical and health system issues. Although some return visits are triggered by the use of clinical safety nets whereby patients are bought back in response to clinical deterioration, others are related to poor initial care, such as a missed diagnosis or incorrect treatment.
For the majority of these patients this return will be a one-off encounter (a local audit by the authors showed this accounts for 53% of reattendances) where they will receive appropriate treatment following which they will be discharged or signposted to other services for further care. Establishing URV rates for individual EDs as well as across the nation is an accepted quality metric. High URV rates may be indicative of poor clinical care, system failures and/or poor access to alternative primary care services. They may also represent missed opportunities during which the early signs of some disease processes are missed.
Ultimately a thorough appreciation of the factors underpinning URVs to the ED will provide important information in measuring patient safety and the quality of care delivered.
Aims and objectives
The aim of this rapid evidence assessment (REA) is to examine factors associated with unscheduled reattendances in adults that could inform developing policy. Furthermore, it is only one component of the development process and does not aim to justify URVs as an indicator. We did not also aim to look at disease or symptom-specific studies, issues related to frequent attenders or at interventions to reduce reattendance. In line with REA principles, the initial policy questions were
-
‘What is the present reported levels of reattendance?’ and
-
‘What does evidence suggest should be the national threshold in England?’
In line with policy development, the literature obtained was re-reviewed to inform subsequent discussions on areas to explore and reduce the URV rate and consider the question of whether it is feasible to develop an analytical framework for analysing URVs.
Therefore, two secondary questions were answered
-
What themes are identifiable as causes of URVs?
-
Within those themes what common causes are seen?
Unscheduled returns to EDs are now being used as a national quality indicator in England.3
Methodology
A REA was adopted as described by Khangura et al4 Although these types of reviews are considered less robust than the traditional systematic review, they were gaining popularity especially by agencies that need to rapidly assess the best available evidence for policy making.5 This type of review allows specific policy-related questions to be answered in a short time scale. RAE reviews are particularly useful when
-
There is uncertainty about the effectiveness of a policy.
-
A rapid policy decision based on the best possible evidence is required within months.
-
There is a wide range of research, but the research question remains unanswered.
-
A starting point to answer a pressing policy concern which will lead to a more detailed systematic review is required.
However, as this type of review is less comprehensive, there is a risk of introducing bias and it is important that policy makers using these studies are aware of these limitations. Examples where RAE reviews have been used by the Home Office include a report on polices assessing the impact of mentoring on reoffending.6
Quality assessment is usually limited in rapid policy reviews compared with that in a systematic review because of the time constraints of policy making. The normal procedure for this type of rapid review is to assign a level of evidence such as those described by the centre for evidence-based medicine.7
Search strategy
The search strategy involved using a Pubmed and Scopus databases to look for articles in the English language from 1987 to 2012.
Search terms included: emergency service, hospital (MeSH) AND (reattend* OR re-attend* OR (repeat AND (attend* OR visit OR visits)) OR returns OR revisit OR revisits OR (return AND (visit OR visits)) OR bounce-back OR re-presentation*). The search was limited to adults and the initial Pubmed searches retrieved 270 articles, and the SCOPUS search identified 211 potentially relevant articles. A review of articles and abstracts identified was undertaken, with all relevant articles reviewed for inclusion. The bibliographies of relevant articles were also reviewed for related citations.
A Cochrane library search was undertaken for existing literature reviews. No systematic reviews were found and, therefore, following rapid review methodologies, the review included all other study types including original data but excluded commentaries, guidelines and opinion pieces.
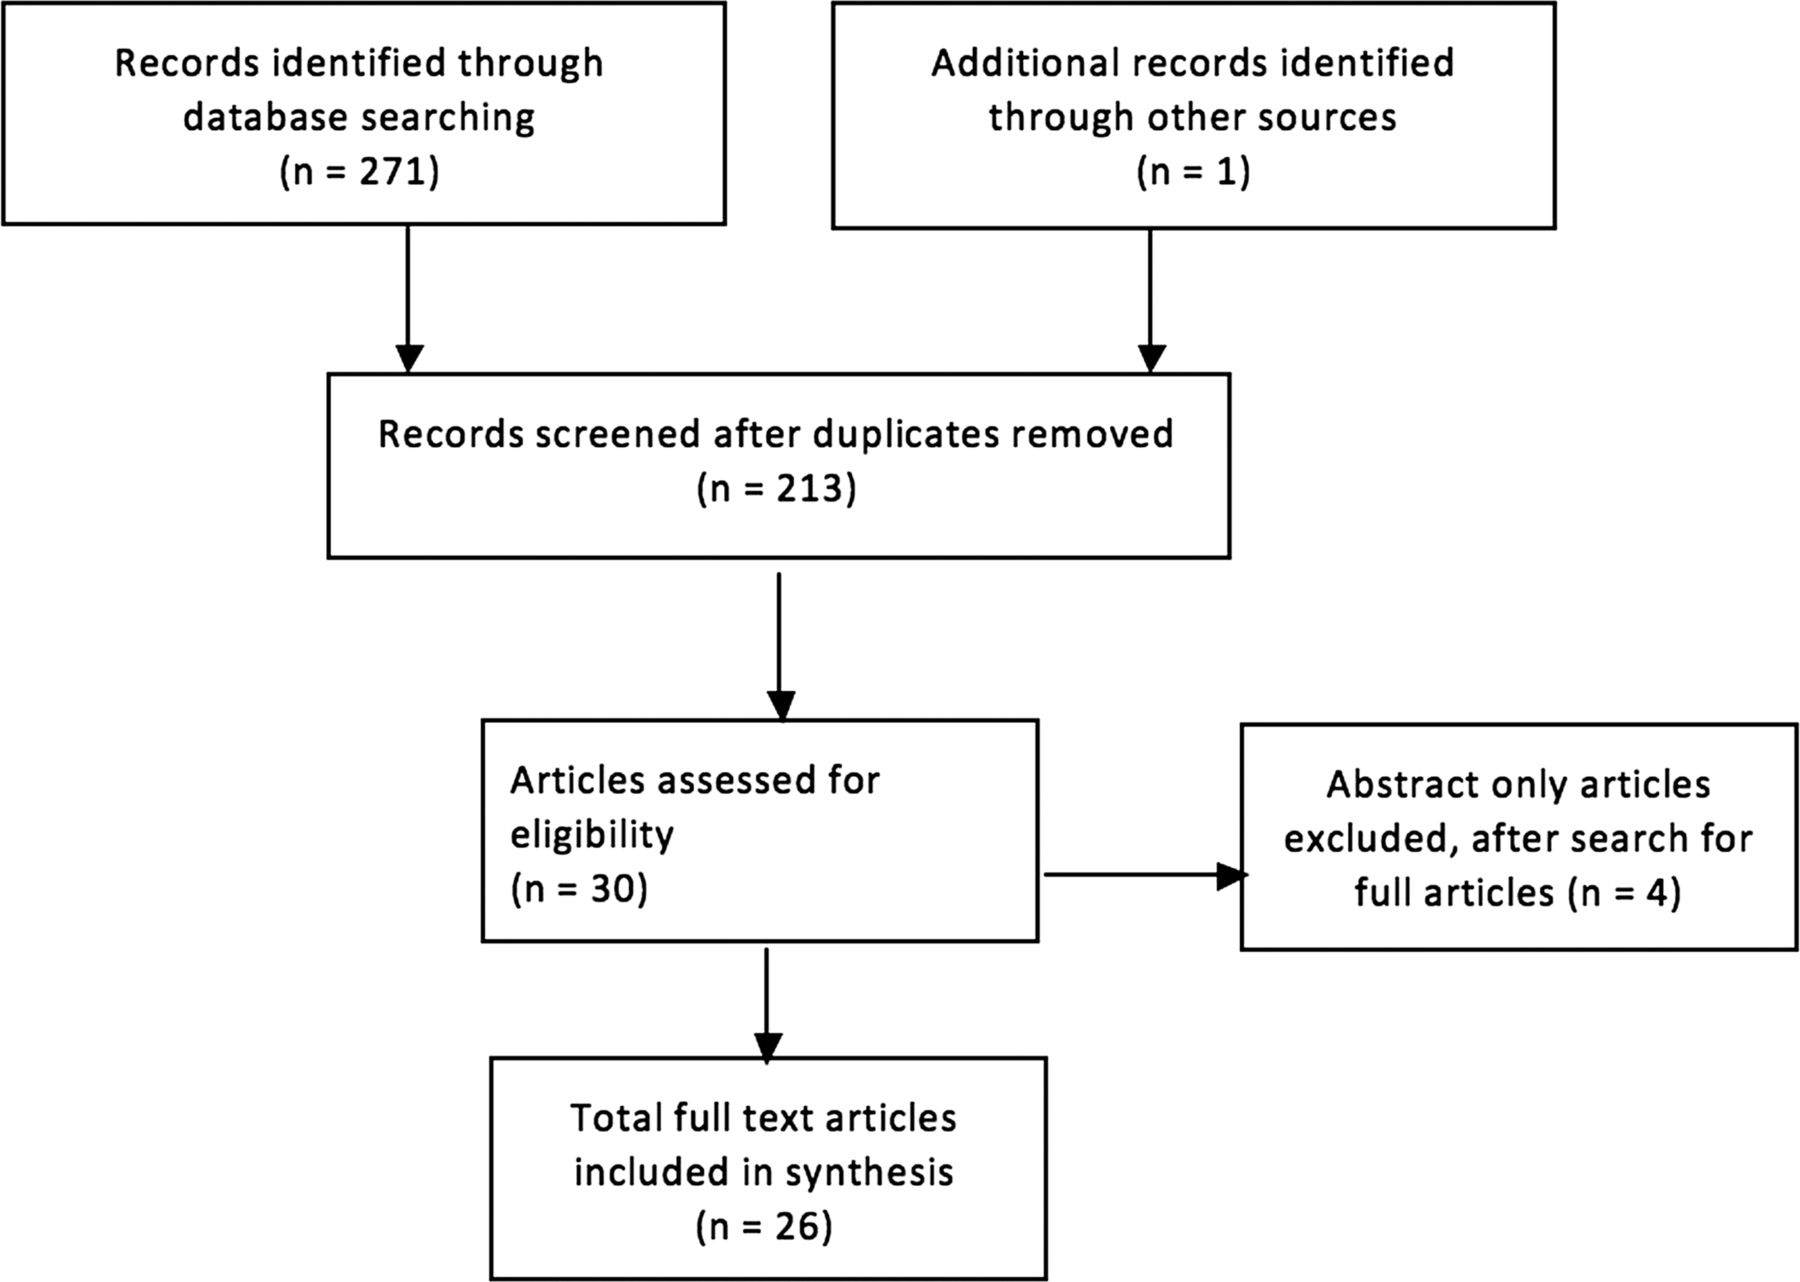
As the primary remit was to examine factors associated with unscheduled reattendances studies looking at reattendance for specific disease, studies only looking at frequent attendance, strategies to minimise reattendance, or where only an abstract was available were excluded. Analysis of relevant articles and discussion were included in this review, and each of the papers was reviewed twice. After applying the exclusion criteria, there were a total of 26 relevant articles (see figure 1). The articles are summarised in the online supplementary table.8–33

The Prisma-based search strategy to identify relevant articles on unscheduled return visits (1987–2012).
Results
A REA demonstrated most studies were retrospective (81%) and of a low level of evidence. There was a variable rate in URVs ranging from 0.4% to 49.3.%. There was also marked variation in the time scale used to define the time period for a URV with some investigators having an open-ended time frame for their URVs and this is summarised in table 1. The majority of the studies (73%) had set a return threshold of 72 h or more to define their URV rates. A single study of adults over the age of 65 years found a URV rate of 43.9% over 180 days. Although this is atypical of the studies assessed, it has been included to demonstrate the heterogeneity of the time frames used across the studies.
The distribution of unscheduled return visits (URV) rates within different time frames for return visits
Due to the marked differences in the ways these studies were designed and conducted it is difficult to make any direct comparisons. However, assessment of the individual studies demonstrated a number of common themes, which the investigators felt were predisposing factors for a URV. This review was combined with a narrative and thematic analysis of the factors linked to the URVs (table 2).
Common themes related to unscheduled return visits (URV) to the ED
Discussion
The international data suggests that a URV rate of approximately 3% is not an unreasonable estimation of the average global URV rate, but it is apparent that there is a large variation in the literature (0.4–43.9%). However, inherent differences in the methodology and definitions, together with the lack of standardisation in the time periods by which a URV was defined, are likely to have a major impact on the rates reported. Some investigators used the number of individuals who reattend, whereas, others used the number of reattendances, while some did not state the method of calculation. Furthermore, global organisational differences in the delivery of emergency care services may also influence the overall URV rate including frequent attenders. There may be a reporting bias inherent in research studies as sites with perceived problems may be more liable to study URVs.
Defining the time frame used to define the URV period is one of the key factors that may determine the rate of the URV to the ED. The majority of studies used a 72 h window between initial and subsequent visits. It is possible that shortening the time span will result in some patients being missed, whereas, a longer time span may increase URV rate by including patients who are either chronic disease patients, frequent attenders or have an unrelated attendance. None of the four UK-based studies that were identified defined a time period between the initial presentation and subsequent visits, and despite this, the URV rates were comparable to those studies that had used a cut-off of 48–72 h.
There is also a marked variation in the literature in regards to the time frame over which the data was collected. This is not related to the reported URV rate. It is possible that studies that collected data for short periods of time may have been exposed to bias, such as seasonal variations in attendances as well as the impact of other changes, such as the change over of junior doctors or seasonal illness. Studies using manual methods for identifying reattending patients showed a lower reattend rate than those using computerised ED records, suggesting it is possible that some patients may have been missed in these studies12 ,15
A graphical representation of the data looking at the URV rate versus the cut-off time in days shows that there is a stable baseline between 0% and 5%, with four studies acting as outliers giving a URV rate of more than 10%. (figure 2) Furthermore, three of the four studies, which found a URV rate of more than 10%, had a cut-off of 14 days. This supports the view that increasing the cut-off period may influence the overall URV rate. It is also possible that these differences suggest that the overall URV rate actually has a more complex composite structure, and by measuring the URVs separately for each of the factors listed in table 2 will give a more representative determination of the URV. The aim of such a composite would be to determine the variety of factors that could be addressed to create improvement rather than to assign a specific cause or to blame any one single component. However, as the methods used across these studies were highly variable it is difficult to make any precise observations from these studies. Similarly, defining what counts as reattendance was rarely clear in manuscripts. Exclusion and inclusion criteria were rarely given. This may involve excluding those with a perceived unrelated attendance, or those with a new diagnosis, both of which have inherent advantages and disadvantages but add further incongruity in the application of the URV as a quality indicator. It is important to distinguish URVs that are related to those patients who are classified as either ‘frequent’ or ‘regular attenders’. Although frequent attenders contribute to the overall URV rate, high volumes of reattendance may skew the data and ideally should be considered as a separate entity. Local audit has shown 2.7% of patients account for 11% of ED visits. Furthermore, a significant proportion of frequent attenders have complex psychosocial issues, which are likely to be a major underlying cause for this type of URV. For this reason, studies looking specifically at frequent attendance, as well as those relating to specific disease processes, were excluded from this review. Literature analysing the rates and causes of URVs to the ED has not been subject to rigorous review. A further limitation of the studies is that they also do not consider the proportion of URVs related to patients who present to other health facilities following their initial presentation, or patients whose initial presentation to the ED may be a URV related to a previous attendance at another hospital. As a result, it is likely that the URV figures may underestimate the actual scale of representation to healthcare and the subsequent impact it may have on delivering quality care across the NHS.

Distribution of unscheduled return visits (URV) rate to timescale of measurement (log scale).
A thematic analysis of the factors related to URVs revealed four broad and not exclusive contributory factors. Those relating to the
-
patient
-
illness
-
system/organisation
-
clinician-related factors.
A detailed analysis and understanding of how these criteria contribute to URVs within the ED is essential before developing interventions to reduce URV rates and to use URV rates as a reliable and reproducible quality metric. Furthermore, the adoption of standardised classification and measurement system will also assist investigators to develop studies that will be more comparable.
Patient factors (inherent characteristics/expectations/health-seeking behaviour)
Patient factors are central in understanding the mechanisms underlying URV to the ED. Psychosocial factors, cultural beliefs, level of education, health-seeking behaviour and previous experiences of emergency care services are all likely to significantly influence a patients decision to attend the ED. Patients at the extremes of age, such as the children and the elderly, may also be at a higher risk of URVs due to complex medical as well as social problems. A study of adults over the age of 65 years found that 43.9% of these patients returned to the ED within 6 months of their index visit.23 Furthermore, any discrepancy between the patients’ expectations of their perceived health needs from what the services of the ED can/does offer may result in a URV. This, particularly, may be the case in patients with chronic conditions, which may be difficult to address in the settings of the ED. Some patients may also find it is more convenient to attend a 24/7 service. The degree of trust patients have in their primary care provider will also influence the patient's decision to re-present to the ED following an initial visit. A recent qualitative study found that factors such as anxiety about the clinical complaint as well as the patient’s perceptions related to the effectiveness and access to primary care were factors that can influence a patient’s decision to attend ED.34
Service/organisational factors
The design, access and the availability of the medical services available to patients is an important consideration in understanding URVs. Patients who are unable to access alternative services following an initial presentation may reattend to the ED. Additionally, the availability of specialist services at tertiary hospitals may also influence the patient's perceptions of the services available through the ED resulting in a URV. Furthermore, factors, such as access to out-of-hours care, or a long wait to see their GP following a visit to ED, may contribute to the rate of URVs.35 Factors relating to ED crowding, time targets and pressures on inpatient beds may also contribute to URVs arising from either premature or inappropriate patient discharges. However, a case-control study looking at the impact of ED crowding in relation to URV rates, where one population served as a control and a second population served as the test group. The test group was subjected to a number of interventions, such as additional ED staffing, coordinators to expedite ward admissions as well as several other measures to counteract the effects of ED overcrowding. The investigators looked at the time frame of 7 days and conducted the study over a period of 28 days for each group. Their results showed no difference in the URV rate for both groups, which were 6.8% and 6.9% of the preintervention and postintervention groups, respectively.22 Although this study suggests that ED crowding is not a significant risk factor for URVs, the study design and duration of data collection may have influenced their results.
Related to illness/complaint
The data from the literature suggests that this is the single largest cause of URVs, and a recent Taiwanese study found that 80.9% of their overall URV rate of 5.47% was related to the patient’s illness.13 Furthermore, problems, such as abdominal pain and respiratory complaints, rank quite highly as conditions which are related to URVs (table 2). It is possible that presentations like abdominal pain, where the signs and symptoms are vague and may change with time, are more likely to result in a URV compared to conditions such as chest pain which are potentially easier to risk-stratify and diagnose. Progression and non-resolution of symptoms are also likely risk factors for a URV, and patients with persistent symptoms which fail to resolve, may become frequent attenders to the ED if they cannot get a clinical resolution. The patients’ understanding of their illness, as well as expectations from the treatment provided in ED, will also influence the URV related to the illness. The natural history of disease processes will also dictate when patients return. With short histories, such as in appendicitis, a patient may return in a day or two after the initial presentation when the signs are more classical, whereas, a patient with a chronic back pain and slowly progressive neurology may present to the ED numerous times before a diagnosis of a prolapsed disc is made. This highlights the impact the defined URV time period has on measuring URV rates, as measuring URVs over 48 h may pick up all the missed appendicitis patients, but is unlikely to measure the URVs related to more chronic conditions.
Clinician factors
The data from the literature demonstrates that URVs related to clinician factors is variable between 5% and 45% of URVs.25 ,27 There are several factors that can influence the clinician as well as their decision-making process.
-
clinician grade and clinical experience
-
non-clinical skills, such as language and communication skills
-
workforce skill-mix and staffing deficiencies
-
specialty support and services available
-
availability and adherence of guidelines and care pathways.
The ability for ED clinicians to offer a patient a correct diagnosis and treatment on their initial presentation is based on the combination of the above factors with those related to the patient, illness and system. Clinical errors are an important source of URVs, and studies in the literature suggest that the percentage of URVs that may be attributable to clinical errors or clinician factors are in the region of 4–28.3%. The other aspect of URVs related to clinician factors is that many URVs may arise as a result of ‘safety-netting’, a mechanism which many EDs use to improve patient safety and minimise the risks of misinterpreting diagnostic tests. Safety netting can be defined as a process by which a patient is either recalled or returns to the ED if certain predetermined criteria are met. Examples include patients with minor head injuries who are sent home but asked to return if they develop specific symptoms which may be red flags for a serious head injury. As the process of safety netting is subjective, there is a risk of miscommunications as well as misunderstandings between the patient and the clinician, and this may contribute to a URV in certain conditions, such as head injuries, abdominal pains, or in childhood presentations such as pyrexia of unknown origin. This is particularly problematic where there are communication issues, such as language barriers or the presence of dementia in the elderly. Although none of the studies have specifically looked at this type of URV, safety netting has a beneficial impact on patient safety, and yet some cases are still preventable in the long term. ED review clinics are not unplanned but may mask some missed diagnoses when a patient is asked to return. Hence, a patient with a missed fracture may be recalled even if asymptomatic. Although it is arguable, if this is strictly a URV as the patient has been recalled, it clearly represents another source of system failure.
The role of URVs as a quality indicator
URV rates are used as an indicator of quality performance and have been implemented by a number of healthcare systems including the NHS. However, as the literature demonstrates, the complex relationships between the different components that make up the overall URV rate suggests that a single overall URV target may be unreliable and potentially misleading measure of performance. Furthermore, it is essential that any resulting quality indicator is used intelligently, and uses accurate data to demonstrate continuous improvement in patient care as well promoting a culture of change in the ED on how quality indicators should be implemented and interpreted.36
In order to develop the URV as a reliable and reproducible indicator, it is essential that there is consensus view on how investigators define a URV and standardise their definitions and methodologies. We believe that these should at least be agreed nationally, if not internationally, so that a more meaningful comparison of the URV rates can be made. This would allow benchmarking across the four core URV domains, which are not mutually exclusive, as is summarised in table 3. Additionally, by adopting a composite approach to URVs, organisations can also develop potential targeted interventions. This approach could also help to identify any early system failures arising at the organisational or system level down to the individual clinician who may be performing poorly.
Benchmarking the thematic components of the unscheduled return visits (URV) as potential quality indicators
Although this study specifically excluded URV studies that looked at just children, it is important to consider this population. A US study involving over 97 000 paediatric attendances demonstrated a URV rate of 1.1%.37 Although this is not dissimilar to the URV rates found in the adult studies, a detailed understanding of the factors resulting in URVs in children requires careful consideration before implementing URVs as a quality indicator in a paediatric emergency population.
Conclusions
This review was undertaken using a ‘rapid evidence assessment review’ approach with four policy-specific questions, and has informed the development of the national A&E clinical quality indictors in England by demonstrating highly variable unplanned reattendance rates internationally.
Unplanned reattendance to the ED is now being used as a national quality in England. The Francis enquiry has highlighted the need for accurate and reliable measures of quality of care.38 This work has demonstrated the potential of this indicator and also the need for more development work.
References
Supplementary materials
Supplementary Data
This web only file has been produced by the BMJ Publishing Group from an electronic file supplied by the author(s) and has not been edited for content.
Files in this Data Supplement:
- Data supplement 1 - Online table
Footnotes
-
Competing interests None.
-
Provenance and peer review Not commissioned; externally peer reviewed.