Article Text

Abstract
Objective To evaluate how rating of perceived capacity (RPC) is related to maximal oxygen uptake (VO2max) and examine VO2max at onset of training in healthy adults.
Methods In total, 125 newly registered fitness centre members, equally men and women, answered the RPC scale and performed a treadmill test for measurement of VO2max. Eligible criteria were <4 weeks of fitness centre membership, physically inactive, ≥18 years and not pregnant. The RPC is a one-page scale (1–20) based on metabolic equivalent tasks, where the individual chooses the most strenuous activity that can be sustained for at least 30 min.
Results The Bland-Altman plot demonstrated a tendency of overestimation, meaning that the participants ranked their own aerobic capacity 17.5% higher than objectively measured values of VO2max. The mean difference between the two methods were +4.92±1.96 and +6.35±1.96 mL/min/kg VO2 in men and women, respectively. The Pearson correlation coefficient was moderate, with r=0.426 (p<0.01). A linear regression analysis showed that both age and VO2max were significant predictors of RPC (p<0.01). Measured VO2max at onset of fitness centre membership was in men aged 38.7±11.7 and women aged 34.7±9.9, 40.5±7.2 and 35.0±6.0 mL/min/kg, respectively. Estimated VO2max from the RPC scale was 45.7±9.8 and 41.4±10.1 mL/min/kg in men and women, respectively.
Conclusions The RPC seems less accurate at the individual level and may overestimate VO2max. Still, it may be considered useful in large-scale studies.
- rating of perceived capacity
- RPC scale
- measured VO2max
- estimated VO2max
- exercise testing
This is an Open Access article distributed in accordance with the Creative Commons Attribution Non Commercial (CC BY-NC 4.0) license, which permits others to distribute, remix, adapt, build upon this work non-commercially, and license their derivative works on different terms, provided the original work is properly cited and the use is non-commercial. See: http://creativecommons.org/licenses/by-nc/4.0/
Statistics from Altmetric.com
What are the new findings?
To the authors knowledge, this is the first study validating the rating of perceived capacity (RPC) against VO2max, measured on a treadmill (gold standard).
The results showed a moderate correlation (r=0.426) between the RPC scale and VO2max.
Untrained healthy adults overestimated their aerobic capacity 17.5% higher than objectively measured values of VO2max.
How might it impact on clinical practice in the near future?
The RPC scale may be used for the estimation of VO2max in large-scale studies, but may be somewhat inaccurate at the individual level.
The RPC scale may be considered a useful and valuable tool for estimation of aerobic capacity in the general healthy adult population without the major costs associated with exercise testing.
Introduction
To date, it is scientific evidence linking low cardiorespiratory fitness to cardiovascular disease and all-cause mortality,1 and higher levels of cardiorespiratory fitness are associated with a lower risk of mortality from cardiovascular disease, independent of age, smoking and body composition.2–5 Cardiorespiratory fitness is usually expressed as maximal oxygen uptake (VO2max) measured by exercise testing or in metabolic equivalent tasks (METs).
VO2max is defined as the highest rate the body can transport and use oxygen during exercise, and cardiopulmonary exercise testing (CPET) is one of the most common and valid measurements of cardiorespiratory fitness.6 However, CPET is time consuming, expensive and requires exercise to volitional exhaustion. Therefore, it is not advisable for all individuals.7 Thus, several different submaximal testing protocols have been developed to reduce testing time, costs and increase the individuals motivation for strenuous exercise.8
Still, it would be advantageous to predict an individuals cardiorespiratory fitness without having to perform CPET. Wisen et al have developed a one-page scale based on different activities that are linked to a MET.9 An estimated VO2max is obtained by asking the individual to choose the most strenuous activity that can be sustained for at least 30 min. The corresponding selected MET value can then be transformed into oxygen uptake or workload, valuable when questionnaires are conducted in epidemiological studies.9
To our knowledge, only one study has investigated RPC and the relationship with VO2max. Wisen et al compared the RPC scale with work capacity assessed by a ramp cycle test, which is not considered the gold standard to examine cardiorespiratory fitness.9–11 In addition, CPET are important to evaluate exercise programmes and to encourage individuals to have a physically active lifestyle.6 10 12 Despite this, it is rarely measured in new beginner exercisers. To our knowledge, no study has investigated aerobic capacity at onset of fitness centre membership.
Hence, the aims of the present study were to (1) validate the RPC scale against VO2max measured on a treadmill (gold standard) and (2) assess VO2max at onset of training in healthy men and women.
Materials and methods
Design
This study was part of a longitudinal prospective cohort study, following up a group of new members at 25 fitness centres in Oslo, Norway, to gather repeated measures of physical activity level and health status, including a wide range of psychosocial and physiological parameters. The present study was financed by and conducted at the Norwegian School of Sports Sciences in Oslo, during the period October 2015 to April 2016. The study was reviewed by the Regional Committee for Medical and Health Research Ethics (REK 2015/1443 A), who concluded that, according to the Act on medical and health research (the Health Research Act 2008), the study did not require full review by REK. The study was approved by the Norwegian Social Science Data Service (NSD 44135). In accordance with the Declaration of Helsinki, all participants received written information about the projects purpose and procedures, and gave consent to participate. Further, it was emphasised that the participants could withdraw from the project at any time with no explanation required. No economic compensation was given.
Participants
Participants for the present study were recruited by an email invitation from the local fitness centre. Eligibility criteria were <4 weeks membership, untrained, ?18 years, healthy and not pregnant. Untrained was classified as exercising <60 min once a week at moderate or vigorous intensity. Being healthy was defined as no chronic serious disease or pathology (heart disease or severe hypertension).
Measurements
An electronic questionnaire including the RPC scale was answered before measurement of VO2max at the laboratory. The questionnaire also contained questions about background information, motives and barriers for physical activity,13 14 social support to physical activity,15 16 subjective health complaints,17 18 perceived quality of life,19–21 body image22 and exercise dependence.23
Rating of perceived capacity scale
To estimate and classify the energy cost of physical activity, it is usual to express the energy cost as METs.24–26 The MET value is defined as the ratio of work metabolic rate to a standard resting metabolic rate (RMR) of 1 kcal/kg/hour. One MET is considered the energy cost of a person at rest (3.5 mL/min/kg).24
The RPC scale is based on MET values, and each number on the scale is linked to different activities such as sitting, walking and running, derived from several sources (table 1).8 26 27 The scale is designed to be useful for both genders, with maximal MET values in gender differences (20 for men and 18 for women).9 The participants were told to select one distinct MET value, the most strenuous activity that could be sustained for at least 30 min.9 A Norwegian version of the scale was used in the present study.28
Rating of perceived capacity (RPC) scale9
VO2max
For accurate measurements of VO2max, body weight was measured with Inbody 720 (Biospace), in light clothing without shoes.29 Height and body weight were measured to the nearest 0.5 cm and 0.1 kg, respectively.
The stepwise modified Balke protocol started with a 3 min warm-up at an initial speed of 4.5 km/hour with no inclination.30 Then, the treadmill inclination increased by 5% every minute up to 20%, while the speed was kept constant (4.8 km/hour). Accordingly, the speed increased every minute with 0.5 km/hour, while inclination was constant (20%).30 The Borg scale (range 620) was used for rating perceived exertion.31 The exercise test was stopped when the participants reached maximal exhaustion (?19 on the Borg scale). An additional criterion was a respiratory exchange ratio (RER) between 1.10 and 1.30 according to age.32 The highest VO2max and highest RER measured before or corresponding to the last 30 s were reported.
Measurement of VO2max was registered with indirect calorimetry (Oxycon Pro; Jaeger). The participants breathed through a Hans Rudolph mask (US)covering both mouth and noseattached to a non-rebreathing hose. Expired air/gases were continuously sampled each 30 s during the whole exercise test. A heart rate monitor (Polar RS800) was used to record maximal heart rate (HRmax). Prior to each test day, all analysers were calibrated after the manufacturers guidelines and all exercise tests were supervised by the same research fellow.
Data processing
In prolonged periods of physical activity/exercise (approximately 30 min), a healthy untrained individual will be able to use about 70% of their VO2max.25 Hence, the MET value from the RPC scale may express about 70% of an individuals VO2max.25
The average RMR in adults is 3.5 mL/min/kg, and this is equal to one MET.24–26 In order to compare the RPC scale with VO2max, MET values from the RPC scale were transformed into METmax and then calculated to estimated VO2max using the following equations:
Statistical analysis
Data analysis was conducted with SPSS Statistical Software V.24.0 for Windows. Background variables, estimated VO2max (RPC) and measured VO2max are presented as means with SD or frequencies and percentages. The strength of agreement between the two methods was analysed by Bland-Altman plot.33 Additionally, to enable comparison of these results with other studies, the Pearson correlation coefficient was used to evaluate the RPC scale (estimated VO2max) and measured VO2max. The correlation values were interpreted as good=0.501.0, moderate=0.300.49 and fair=0.100.29.34 35 A linear regression analysis was calculated to examine if RPC was predicted by VO2max, age or gender. Level of significance was set at p<0.05.
Results
Of 275 who contacted the research group, 146 were excluded due to exercising regularly and four due to various diseases. Hence, our final sample included 125 participants, equally men and women. Demographic characteristics and health factors are given in table 2. Age ranged from 18 to 71 and 2159 years in men and women, respectively. In terms of body mass index (BMI), 9.6% men and 9.5% women were classified as obese (BMI >30), and 58.0% men and 33.3% women were classified as overweight (BMI >25). Abdominal obesity (waisthip ratio >0.90 for men and >0.85 for women) was assessed in 50% of the men and 61.9% of the women.36 With respect to fat percentage, 47.5% of the participants had measurements above reference values (>20% for men and >30% for women).37
Comparisons of demographic and health factors between men and women (n=125)
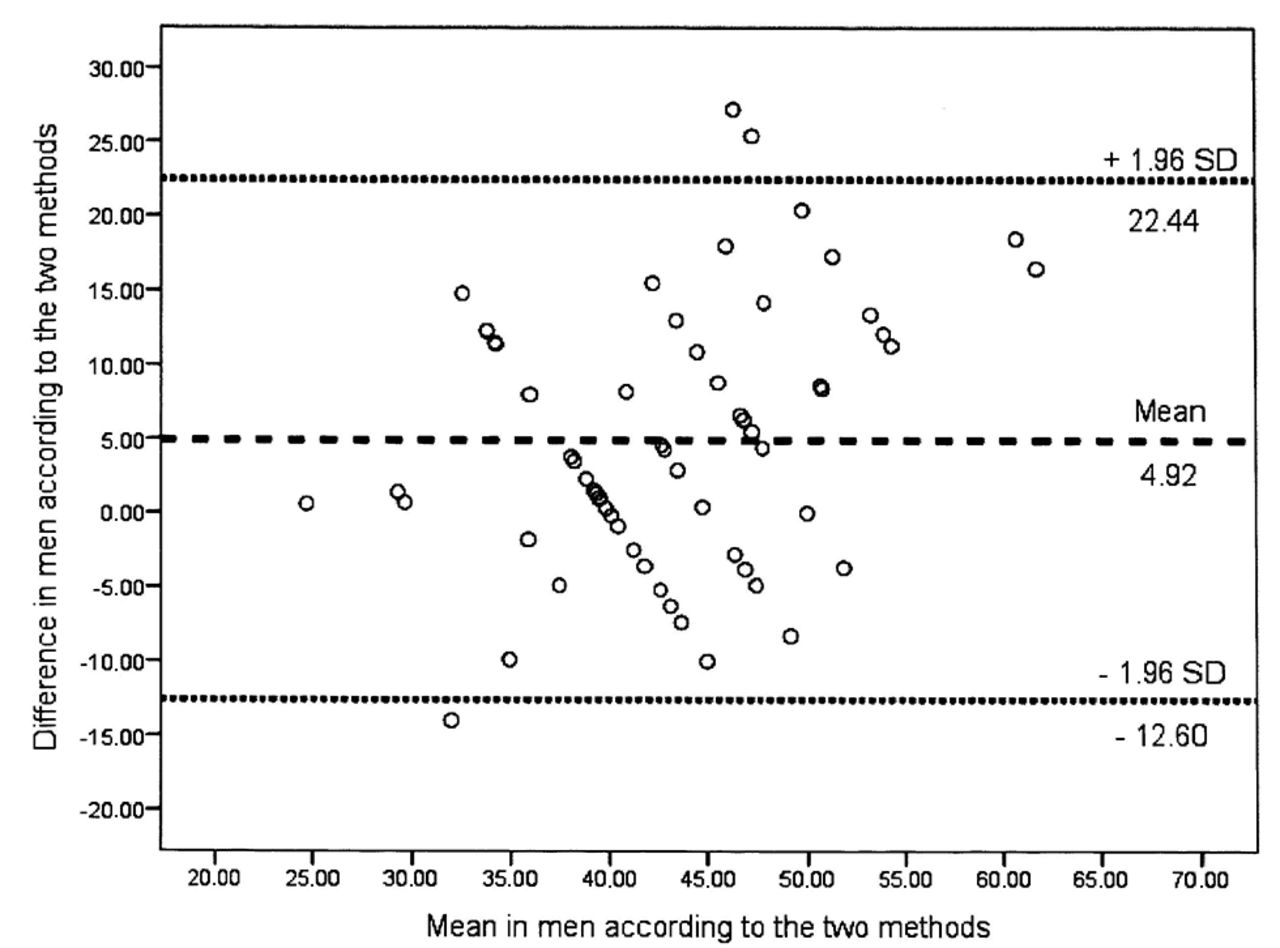
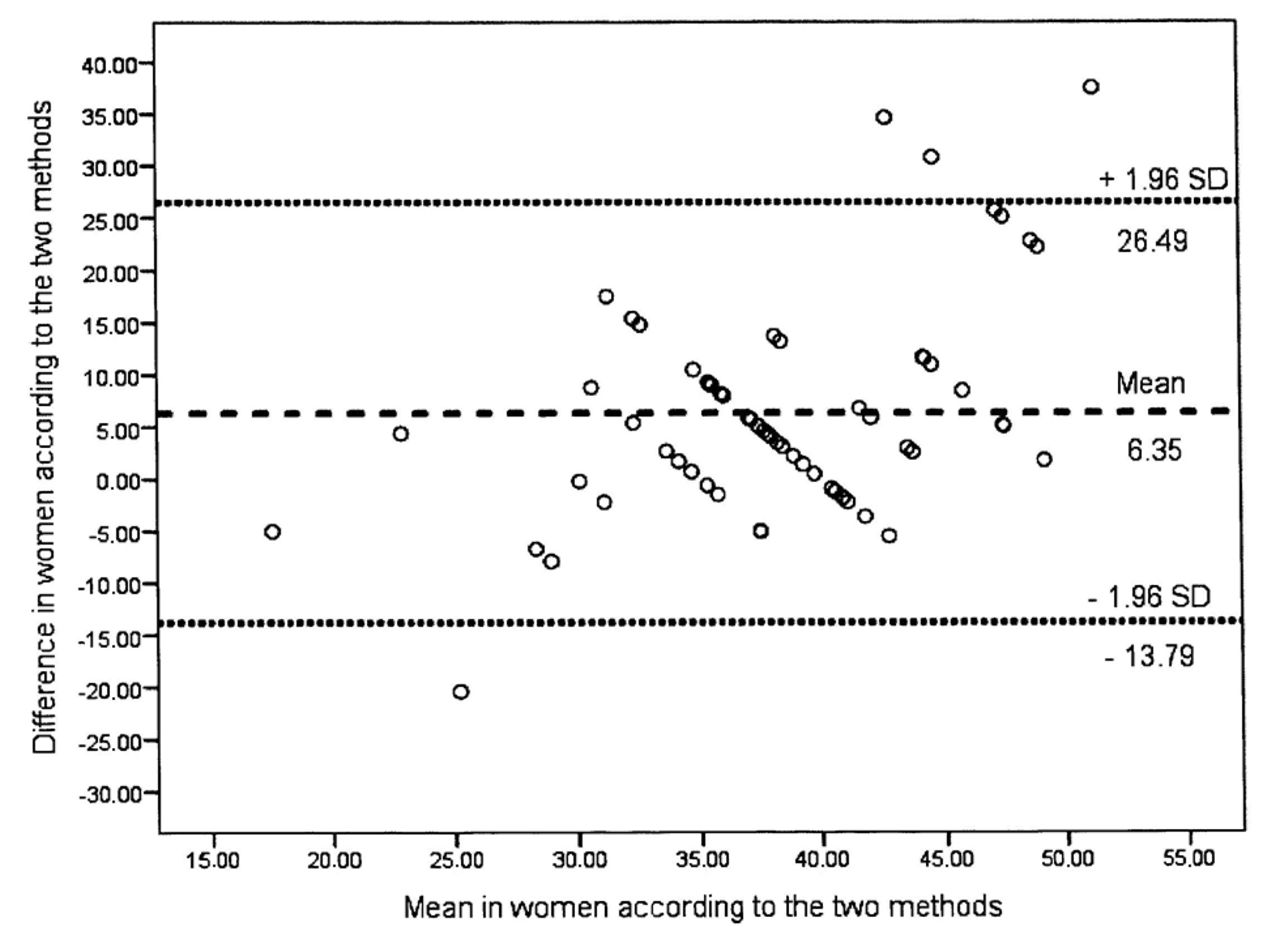
The visual agreement of the Bland-Altman plot demonstrated an overestimation (figures 1 and 2). The mean difference between the two methods was 4.921.96 and 6.351.96 mL/min/kg VO2, with 95% confidence limits of agreement varying from +22.44 to 12.60 and +26.49 to 13.79 mL/min/kg VO2 for men and women, respectively. Three men and four women were outliers of the 95% limits of agreement. The Pearson correlation coefficient between the two methods was moderate, with r=0.426 (p<0.01).

Bland-Altman plot for men showing the difference plotted against the mean of the two estimates assessed with the RPC scale and measured with a stepwise modified Balke protocol.

Bland-Altman plot for women showing the difference plotted against the mean of the two estimates assessed with the RPC scale and measured with a stepwise modified Balke protocol.
The linear regression analysis showed a significant association between age (p<0.01), VO2max (p<0.01) and the prediction of RPC. The beta coefficient was 0.26 and 0.55 for age and VO2max, respectively. No significant association was found between gender and RPC (p=0.53).
We had no dropouts or error at measurement with respect to the stepwise modified Balke protocol. Measured and estimated VO2max at onset of training are shown in table 3. Women had on average 13.6% lower measured VO2max compared with the men (p<0.01). The participants ranked their own aerobic capacity 17.5% higher than objectively measured values of VO2max. The mean duration of the stepwise modified Balke protocol was 10.431.50 min and 9.031.19 min for men and women, respectively (p=0.07) (table 3).
Measured and rated values from VO2max and rating of perceived capacity (RPC)
Discussion
In this study, we compared estimated VO2max (RPC) with directly measured VO2max on a treadmill using a stepwise modified Balke protocol until exhaustion in 125 healthy untrained adults. The Bland-Altman plot of the two methods showed an overestimation in aerobic capacity at the individual level. Overestimation of estimated VO2max was 14.5% and 20.3% in men and women, respectively. The correlation between the two methods was moderate (r=0.426, p<0.01). VO2max at onset of training was 40.5 mL/min/kg and 35.0 mL/min/kg for men and women, respectively.
Participants
All participants were defined as untrained, possibly influencing the participants estimation of their own aerobic capacity. Knapik et al showed that trained individuals are more capable to predict their aerobic capacity subjectively.38 Still, a sedentary lifestyle is becoming more and more common worldwide, and the majority of participants in large population-based studies are physically inactive or insufficiently physically active, with a low VO2max.39–42 Our participants may therefore be considered representative of a general urban European population.40–43
Measurements
Rating of perceived capacity scale
The RPC scale has a limited number of aerobic activities, which is believed to make it easier to evaluate aerobic capacity. Still, there may be a challenge in relation to the interpretation of the RPC scale. The aerobic activities presented in the RPC scale include walking, running and cycling at different speeds. It may be a limitation if an individual has no appreciation to perform these activities. The risk of over-reporting or under-reporting may also be present when an individual is asked to subjectively assess their aerobic capacity based on a simple scale.8 42 For example, running fast will not necessarily have the same meaning to an untrained and a trained individual.9 10 44
VO2max
Assessment of VO2max using CPET is considered the most valid measure of cardiorespiratory fitness, and an increase in VO2max is the most common measure of demonstrating a training effect.6 10 11 However, CPET may not be suitable for individuals who have different health challenges related to pain or fatigue.6 Further, the method requires exercise to volitional exhaustion, qualified personnel, as well as being expensive and time consuming.6
The secondary aim of the present study was to evaluate VO2max at onset of training in healthy men and women. To verify a valid VO2max, RER had to be between 1.10 and 1.30 according to the age-dependent results reported by Edvardsen et al.32 In addition, the Borg scale had to be ?19, reflecting a combination of exhaustion from central and peripheral factors, as well as psychological factors.31 Both physiological and psychological end criteria are of importance to determine maximal exhaustion due to that untrained individuals often overestimate perceived exertion.45 Our participants expressed more muscular fatigue than shortness of breath. One explanation for this may be the chosen test protocol, and lower anaerobic threshold in untrained individuals, meaning that local muscle fatigue was a determining limitation more than central factors.46–51
Results
VO2max related to the RPC scale
The present results showed large individual differences, with 17.4% overestimation in subjectively estimated VO2max compared with measured values. This is in contrast to the findings of Wisen et al, where the participants underestimated their aerobic capacity by 17%. It should be noted that Wisen et al compared RPC with a ramp cycle test.9 Myers et al also found an underestimation in self-rated aerobic capacity, using veterans specific activity questionnaire and maximal exercise testing on a treadmill in 212 elderly.9 52
Prieto et al compared VO2max on a treadmill with Subjective Appraisal of Aerobic Capacity (SAAC) scale and found that 94.4% of the participants with a low VO2max (<43.0 mL/min/kg) classified their aerobic capacity as high or very high.53 54 The major difference between the RPC and SAAC scale is how the participants rank their aerobic capacity. The SAAC scale uses values related to aerobic capacity levels from 1=Very poor to 7=Excellent. Furthermore, the scale is not related to MET values. The RPC scale has multiple MET values (120), most likely making it simpler for each individual to predict their aerobic capacity.9 Hence, we believe that the RPC scale may be more accurate and relevant to aerobic capacity in individuals with a low VO2max.9 25 Still, the present study found an overestimation in estimated VO2max, with an average of 17.5%.
Differences in self-reported and objectively measured aerobic capacity may be explained by the variations in chosen questionnaires/scales, exercise tests (VO2max/submaximal, treadmill/bicycle) and participants (untrained/trained).9 52–54 In addition, it is not possible to sustain prolonged activity at the maximal level, and differences in perception of activity will affect the risk of underestimation or overestimation.
The difference in objectively measured VO2max and the RPC scale in the present study may be of importance at the individual level, but not in large-scale surveys, where the purpose is to get an overview of maximal aerobic capacity at the population level.53–55
Several mathematical non-exercise models have been developed with the aim of predicting VO2max.56 57 The studies of Jurca et al and Nes et al concluded that VO2max may be accurately estimated with a non-exercise model including several variables such as gender, age, body composition, physical activity level and resting heart rate.56 57 Still, the results of Nes et al indicated that the non-exercise model underestimated VO2max among the most fit subjects and overestimated VO2max among the least fit participants,57 in accordance with the findings in the present study.
It is suggested that for untrained individuals, direct measurement of VO2max should be used for a more accurate examination.57 Still, this method may not increase an untrained individuals motivation for exercise, mainly because it requires vigorous intensity and voluntary exhaustion.
VO2max at onset of training
Several studies have investigated VO2max in the general adult population (2090 years).39 58–61 The present study showed a lower VO2max than these studies.39 58–62 Compared with Norwegian data, the participants in the present study had in general 16.5% and 9.6% lower VO2max in men and women, respectively.39 60 This may be explained by the fact that our participants were classified as untrained by inclusion due to our secondary aim. Edvardsen et al and Aspenes et al had no inclusion/exclusion criteria with respect to physical activity level, and it is not unlikely that those who are physically active had more interest in participating in studies aiming to investigate aerobic capacity.39 60 Only one study showed a lower VO2max than our results. Mishra and Budholia compared VO2max between trained and untrained men, and found on average a VO2max of 37.2 mL/min/kg in the untrained group.62 Our men had a slightly higher VO2max (40.5 mL/min/kg). A limitation of Mishra and Budholia was a sample size of 24 untrained participants only and measurement of VO2max using a bicycle ergometer.62
Strengths and limitations
In this methodological comparison study, a sample size of 125 participants, with a wide range in age (1871 years), equal number of men and women, and valid and reliable exercise test (Balke protocol) to measure VO2max may be considered major strengths. In addition, the same personnel tested all participants. Furthermore, we used several statistical methods to enable comparison of our results with other studies.
A limitation of the study is that we should have included a more diverge group, counting both untrained and trained individuals with very low to very high VO2max. Even though the RPC scale is designed for both men and women, from the completely untrained athletes, the individuals perception of the the RPC scale may affect the individuals choice.
Conclusion
The RPC scale may be used for the estimation of VO2max in healthy adults in large-scale studies, but may be somewhat inaccurate at the individual level. Hence, it may be a valuable tool for monitoring the effects of endurance exercise programmes in the general population.
References
Footnotes
Acknowledgements We thank Ingar Holme, professor in biostatistics, and Morten Fagerland, professor in biostatistics, Norwegian School of Sports Sciences, for important guidance with the statistical analysis.
Contributors CG plotted all data, developed the questionnaire together with LAHH and outlined the manuscript. TS developed the treadmill protocol together with CG and LAHH and supervised the testing. CG and LAHH were responsible for data collection and recruited the participants. LAHH originated the idea for the present study, led on its design and supervised the project. All authors participated in discussing the design of the study, read and corrected draft versions of the manuscript and approved the final manuscript.
Competing interests None declared.
Patient consent Obtained.
Ethics approval The Norwegian Social Science Data Service (NSD 44135).
Provenance and peer review Not commissioned; externally peer reviewed.
Data sharing statement All published data from the present study are available to those who are interested (by contacting the first author). Unpublished data are currently only available to the projects group.