Article Text

Abstract
Objectives To describe objectively measured sleep characteristics in children aged 11–12 years and in parents and to examine intergenerational concordance of sleep characteristics.
Design Population-based cross-sectional study (the Child Health CheckPoint), nested within the Longitudinal Study of Australian Children.
Setting Data were collected between February 2015 and March 2016 across assessment centres in Australian major cities and selected regional towns.
Participants Of the participating CheckPoint families (n=1874), sleep data were available for 1261 children (mean age 12 years, 50% girls), 1358 parents (mean age 43.8 years; 88% mothers) and 1077 biological parent–child pairs. Survey weights were applied and statistical methods accounted for the complex sample design, stratification and clustering within postcodes.
Outcome measures Parents and children were asked to wear a GENEActive wrist-worn accelerometer for 8 days to collect objective sleep data. Primary outcomes were average sleep duration, onset, offset, day-to-day variability and efficiency. All sleep characteristics were weighted 5:2 to account for weekdays versus weekends. Biological parent–child concordance was quantified using Pearson’s correlation coefficients in unadjusted models and regression coefficients in adjusted models.
Results The mean sleep duration of parents and children was 501 min (SD 56) and 565 min (SD 44), respectively; the mean sleep onset was 22:42 and 22:02, the mean sleep offset was 07:07 and 07:27, efficiency was 85.4% and 84.1%, and day-to-day variability was 9.9% and 7.4%, respectively. Parent–child correlation for sleep duration was 0.22 (95% CI 0.10 to 0.28), sleep onset was 0.42 (0.19 to 0.46), sleep offset was 0.58 (0.49 to 0.64), day-to-day variability was 0.25 (0.09 to 0.34) and sleep efficiency was 0.23 (0.10 to 0.27).
Conclusions These normative values for objective sleep characteristics suggest that, while most parents and children show adequate sleep duration, poor-quality (low efficiency) sleep is common. Parent–child concordance was strongest for sleep onset/offset, most likely reflecting shared environments, and modest for duration, variability and efficiency.
- sleep
- actigraphy
- reference values
- children
- inheritance patterns
- epidemiologic studies
This is an open access article distributed in accordance with the Creative Commons Attribution Non Commercial (CC BY-NC 4.0) license, which permits others to distribute, remix, adapt, build upon this work non-commercially, and license their derivative works on different terms, provided the original work is properly cited, appropriate credit is given, any changes made indicated, and the use is non-commercial. See: http://creativecommons.org/licenses/by-nc/4.0/.
Statistics from Altmetric.com
Strengths and limitations of this study
This study used valid, reliable, objective, free-living measures of child and parent sleep.
We report, for the first time, concordance in sleep time characteristics other than duration and timing (onset and offset), including sleep efficiency and day-to-day variability.
The sample represents a limited age range for children (11.0–12.9 years) and adults (midlife).
Intergenerational concordance of parent and child sleep was examined for only one of the child’s parents, predominantly mothers.
Introduction
Sleep is essential for health and well-being.1 The importance of sleep duration, as well as sleep timing, variability and quality (often measured objectively as sleep efficiency), is increasingly being recognised.2–4 Characteristics of sleep time have been associated with a wide range of health outcomes, including cognitive function,5 6 mood,7 weight status,8 diabetes9 and cardiovascular risk.10 11
Despite the importance of sleep, concerns have been raised that many adults and children report inadequate, irregular and poor-quality sleep.12–15 The National Sleep Foundation (NSF)16 17 found that 45% of Americans reported poor or insufficient sleep that affects their daily activities at least once a week, while 58% of 15–17 year olds reported sleeping less than 7 hours per night, and 17% rated their sleep quality as fair or poor. Similarly, the 2016 Sleep Healthy Survey of Australian Adults18 found that 33%–45% of Australian adults said that they were affected by poor sleep (inadequate duration or quality). In a global review of 41 studies examining children’s sleep, Gradisar and colleagues19 found 53% of samples reported insufficient sleep (by their definition of <8 hours) on school nights.
Although relatively less examined and understood, sleep variability, the degree to which an individual’s night time sleep duration differs across a period of time, is increasingly being recognised for both physical and mental health.20
Given these concerns, interest has risen in better understanding determinants of sleep characteristics. Patterns of sleep are likely to be partly environmental21 and partly genetic.22 23 Environmental factors may be considered in terms of shared and non-shared parent–child environments. Shared local environmental factors, such as traffic noise, can affect sleep characteristics, such as sleep efficiency.24 Similarly, social factors,25 such as parenting style, household chaos and family routines, may also play a role, as may child-to-parent effects (ie, reverse causation), particularly when the child is young. Non-shared environmental factors, such as parental work schedules26 and school commitment,27 are also known to affect sleep characteristics. Genes are also likely to account for some of the interindividual variability in sleep duration.28 Personality factors with a strong genetic basis, such as higher levels of conscientiousness, openness and neuroticism, have been associated with shorter sleep.29 The rate and timing of melatonin and serotonin release, which are important regulatory hormones of the sleep/wake cycle, are also partially under genetic control. Shared environments and genetics should ensure a degree of concordance between parental and child sleep habits.
Understanding the concordance between parental and child sleep habits can cast some light on the relative importance of environmental and genetic contributors of sleep characteristics. For example, if the concordance is very weak, then shared environmental and genetic components must be relatively small. Similarly, if the concordance is not attenuated when covariates relating to shared or non-shared environmental factors are included, then it is likely that genetics may have a stronger contribution.
To date, few studies have examined the concordance between parents' and children’s sleep, most of which examine self-reported or proxy-reported sleep measures. Gau and Merikangas,30 in a study of 1479 children aged 10–16 years, found weak correlations between self-reported parent and children’s bedtimes (weekdays, r=0.08; weekends, r=0.22), wake times (weekdays, r=0.02; weekends, r=0.26) and sleep duration (r=0.02), with notable day-type differences. In a larger study of 4470 parents and their children aged 6–12 years, Zhang and colleagues31 also reported weak self-reported sleep-timing correlations; however, stronger correlations were observed for mother–child (bedtime, r=0.27; wake time, r=0.28) pairs, compared with father–child (bedtime, r=0.10; wake time, r=0.08) pairs. Iwata and colleagues32 examined 47 parent–child pairs and found that self-reported parent rise times were associated with their 5-year-old child’s objectively measured rise times (weekdays, r=0.38; weekends, r=0.39) but not sleep bedtimes or sleep period times.
Although self-reported sleep duration does correlate with objectively measured sleep, the level of agreement depends on the phrasing of the question and is limited by recall and social desirability bias.33 Other important elements of sleep, including estimates of the number and duration of nocturnal awakenings, correlate poorly with objective measures.33 Concerns about the societal as well as individual impacts of poor, inadequate and inconsistent sleep on populations as well as individuals justify accurate measurement of multiple sleep characteristics in population-based studies.
Ohayon and colleagues34 recently conducted a systematic literature review of 65 studies covering 3577 participants aged 5–102 years in an attempt to identify age-related changes in objectively recorded sleep across a lifespan. This review found that objectively measured sleep duration varied between 360 and 460 min for adults aged 40–50 years and between 450 and 550 min for children aged 11–12 years. Sleep efficiency, often defined as the percent of time spent asleep between sleep onset and sleep offset, also varied across studies, ranging from 87% to 96% for adults aged 40–50 years and from 89% to 98% for children aged 11–12 years, within the recommended range of greater than 85%.34 35 Though comprehensive, Ohayon and colleagues'34 review acknowledged a scarcity of objectively measured sleep studies among school-aged children, adolescents and middle-aged parents. Further studies that present normative, objectively measured sleep are needed for these age groups.
The current study examines objectively measured time-use data collected as part of the cross-sectional, observational CheckPoint study. Among this sample of Australian children and their parents, drawn from a national longitudinal study that was initially population representative, we aimed to
Assess the distribution of sleep-time characteristics (sleep duration, onset, offset, day-to-day variability and efficiency) in
Australian children aged 11–12 years, and
Their parents.
Describe the extent of intergenerational concordance for sleep-time characteristics.
Methods
Study design and participants
Data examined in this study were collected between February 2015 to March 2016 as part of the Child Health CheckPoint study, a one-off, comprehensive physical health and biomarker cross-sectional study nested between waves 6 and 7 of the Longitudinal Study of Australian Children (LSAC) at child age 11–12 years. The LSAC study commenced in 2004, when two cohorts (B and K—the latter not relevant to this paper) were recruited who have since been followed up biennially.36 Details of the initial LSAC study design and recruitment are outlined elsewhere.37 38
Of the 8921 families contacted to be part of the LSAC B cohort, 5107 families (57%) agreed to take part in the first wave of data collection in 2004; 3764 families participated in wave 6 in 2014. During the wave 6 LSAC home visit, B cohort families were introduced to the upcoming Child Health CheckPoint and were asked to consent to their contact details being shared with the CheckPoint team. A total of 3513 families provided permission to receive an information pack via mail, and an information and recruitment phone call regarding the CheckPoint study (78% of the wave 6 cohort and 69% of the original cohort). Of the families agreeing to receive information about the CheckPoint study, 1874 families took part (53% of eligible participants, 42% of the wave 6 cohort and 37% of the original cohort). Details regarding the CheckPoint study design and methods are available elsewhere.39 40
Consent
The attending parent/caregiver provided written informed consent for themselves and their child to participate in the study.
Procedure
The specialised CheckPoint assessment centre sequentially visited seven Australian major cities and eight smaller regional centres between February 2015 and March 2016.39 Each participating child attended the centre with one parent or caregiver (usually the biological mother) at which both participated in a wide range of measures relevant to non-communicable disease. Those families (n=378) who could not arrange a visit were offered a home visit. Sleep data were collected via accelerometers fitted at the end of the visit at the ‘End Games’ station by a trained research assistant. At peak centre throughput (mainly school holidays), accelerometer demand sometimes exceeded supply. Data for 67 (4.8%) children and 70 (4.9%) parents were therefore obtained from accelerometers that were mailed after the visit. Participants were asked to remove their accelerometers after eight continuous days of wear and to return them with their completed activity monitor cards (see below) using the prepaid postal bag provided.
Measures
Objectively measured sleep characteristics were collected using triaxial, wrist-worn GENEActiv accelerometers. Using a standardised protocol, the research assistant spoke with each parent and child at the same time, fitted the accelerometer to their non-dominant wrist, explained the importance of continuous 24-hour wear and asked them to wear it for eight consecutive days. They also showed participants how to complete a self-report record (activity monitor card) marking their bedtimes and wake times, as well as any times that they removed the accelerometer and the reasons for non-wear. Activity monitor card data were transcribed electronically to Research Electronic Data Capture (REDCap).41
Acceleration data were recorded at 50 Hz. To remove invalid data, days with ≥1000 min of sedentary time were excluded, because these were deemed to reflect undetected non-wear. We also excluded participants with less than four nights of sleep42 recorded and participants with ≤200 min average sleep time.
Sleep-time characteristics were derived from raw accelerometer data, using self-reported records of bedtime and wake time as a guide to locating sleep onset and sleep offset. Data were processed using Cobra custom software developed by coauthor Francois Fraysse. Further details of raw accelerometry data processing have been reported elsewhere.43 The sleep algorithm of van Hees and colleagues44 was used to detect sleep and wake between self-reported bedtime and get-up time. This method is based on the variability of the orientation of the device and classifies each 5 s epoch as either sleep or wake. Following this, sleep/wake data were further collapsed into 1 min epochs to align with the rest of the accelerometry data. Each minute was classified as sleep or wake if it contained a majority of sleep or wake 5 s epochs, respectively. Minutes containing equal numbers of sleep and wake 5 s epochs were classified as sleep. Sleep data for the first night were excluded, as recordings started at 23:00.
Following this, the variables below were calculated:
Sleep onset: the start of the first three consecutive minutes scored as sleep.
Sleep offset: the end of the last five consecutive minutes scored as sleep.
Sleep duration: the difference between sleep onset and sleep offset.
Day-to-day sleep variability: the coefficient of variation of duration.
Sleep efficiency: the percent of minutes scored as sleep between onset and offset.
Socioeconomic status was derived from the postcode of the participant’s primary address using the Socio-Economic Indicators for Areas 2011 Index of Relative Social Disadvantage, which measures relative disadvantage from variables like low income, low educational attainment and unemployment.45 The population mean score for Australia is 1000 (SD 100), with higher scores representing less disadvantage.45
Statistical analysis
Population summary statistics were estimated by applying survey weights and procedures, taking clustering in the sampling frame into account. SEs were calculated, taking into account the complex design and weights. More detail on the calculation of weights is provided elsewhere.39 46 All sleep characteristics were computed for each individual day, then averaged over days for each valid participant using a 5:2 weighting for weekdays (Sunday–Thursday) and weekend (Friday–Saturday). The key sleep variables of duration and efficiency were similar on weekdays and weekends (see table 1). Therefore, we examined a single mean score for each sleep variable examined, noting, however, that both sleep onset and sleep offset were somewhat later for children and parents at weekends.
Sleep variables for weekdays and weekends; all values are mean (SD)
Concordance between parents and children was assessed by (1) Pearson’s correlation coefficients with 95% CIs and (2) linear regression with the child variable as the dependent variable and the parent variable as the independent variable, adjusted for parent and child age and sex (in models including both sexes), relative socioeconomic disadvantage and day type (ie, mixed days, weekdays only or weekend/holidays only). In most children (n=1241) and parents (n=1346), measurements were taken on both weekends and weekdays (‘mixed’ days), while few parents (n=12) and children (n=20) had data on weekdays only, and no parents and children had data on weekends/holidays only. Non-biological caregivers were excluded from these analyses (n=12).
Patient and public involvement
Because LSAC is a population-based longitudinal study, no patient groups were involved in its design or conduct. To our knowledge, the public was not involved in the study design, recruitment or conduct of LSAC study or its CheckPoint module. Parents received a summary health report for their child and themselves at or soon after the assessment visit. They consented to take part, knowing that they would not otherwise receive individual results about themselves or their child.
Results
Of the 1874 families who participated in the CheckPoint, sleep data were available for 1261 children, 1358 adults and 1077 biological parent–child pairs (figure 1).

Participant flow chart. *Inability to assess due to equipment failure, poor-quality data or time constraints. **Participants excluded if valid days available did not meet the minimum criteria of at least 4 days of any type, ≥200 min sleep and ≤1000 min sedentary time. ***Data from 12 non-biological child–parent pairs excluded from concordance analyses. c, number of children; HV, home visit assessment; LSAC, Longitudinal Study of Australian Children; MAC, main assessment centre; mAC, mini assessment centre; n, number of families; p, number of attending adults.
Table 2 outlines the sample characteristics. While the numbers of boys and girls were approximately equal, most parents (88%) were mothers. Participants were slightly less disadvantaged than the general Australian population, with the mean Disadvantage Index score around 0.1 SD above the national average and showing a narrower spread (SD 64 vs the national value of 100) such that there were few very disadvantaged participants.
Participant characteristics (weighted means and SD)
Sleep characteristics
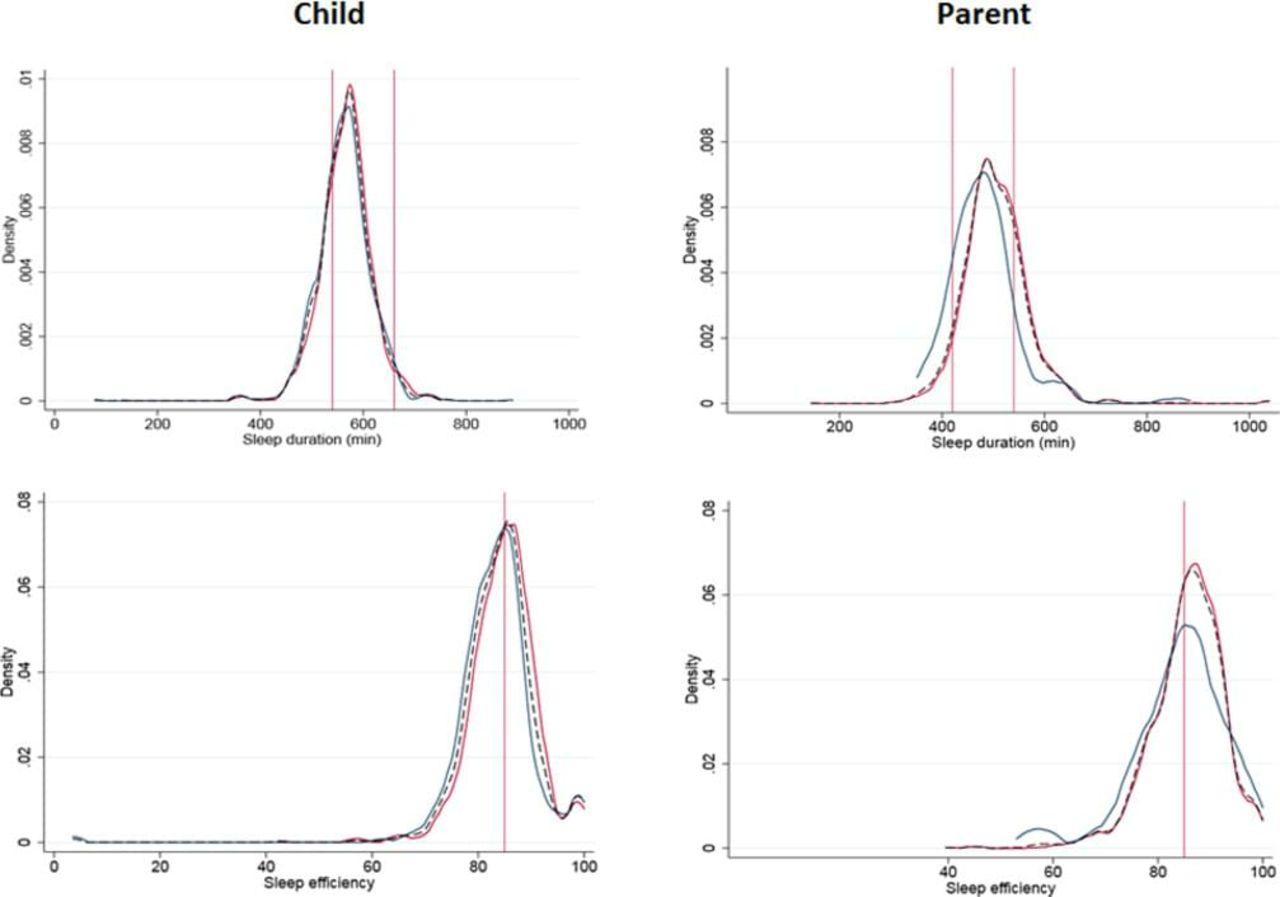
Table 3 presents the summary statistics for sleep characteristics (sleep duration, onset, offset, day-to-day variability and efficiency) in Australian middle-aged parents and children aged 11–12 years, while figure 2 shows the distributions graphically for sleep duration and efficiency, with lines dropped to represent US-based NSF recommendations.35 47
Density plots for sleep duration and sleep efficiency. Male sex (blue), female sex (red) and both sexes (thin dotted black line) plotted on the same graph for each outcome. X and Y scales common between child and parent, and between mean and maximum sleep variables. Vertical red lines indicate NSF sleep recommendations. The recommended range of appropriate sleep duration is 420–540 min for adults and 540–660 min for school-aged children.47 The NSF35 recommends a sleep efficiency of ≥85% for both adults and children. NSF, National Sleep Foundation.
Overall, 6.4% of the parent sample, but 27.8% of the child sample, fell below the NSF’s recommended range of appropriate sleep duration of 420–540 min and 540–660 min, respectively. The mean sleep efficiency was 85% for parents and 84% for children. This equates to 42.3% of parents and 54.5% of children falling below the lower end of NSF’s35 recommended range of ≥85%.
Overall, children and parents had a day-to-day sleep variability of 7.4% and 9.9%, respectively. This equates to an SD in night-time sleep duration of approximately 42–50 min for children and parents, respectively.
Summary statistics for sleep characteristics, stratified by sex for parents and children and weighted for day type
Intergenerational concordance for sleep-time characteristics
Table 4 presents the intergenerational concordance for all sleep-time characteristics. None of the associations were attenuated in adjusted linear regression models, suggesting that the concordance between parents and children did not change when adjusted for age, Disadvantage Index, type of day or sex. Estimates across the characteristics were more consistent for mother–child pairs than father-child pairs, perhaps reflecting the smaller father sample size (n=128, 11.9% of parent participants) and accordingly larger CIs and greater uncertainty (table 4); nonetheless, mother–child and father–child correlations were strikingly similar for three of the five characteristics (duration, efficiency and sleep offset). Higher correlations both for mother–child pairs and father–child pairs for sleep offset suggest a high degree of household synchronicity, which was also present but less marked for sleep onset.
Parent–child concordance
Discussion
Principal findings
To our knowledge, this is the first study to provide normative values and report parent–child concordance of multiple objectively measured sleep-time characteristics (sleep duration, onset, offset, day-to-day variability and efficiency) in a population-based sample.
By current accepted guidelines, sleep duration was adequate for almost all parents but for only 72% of children aged 11–12 years, while close to half of all parents and children experienced poor sleep quality on current recommendations.35 47 Sleep variability was 7.4% for children and 9.9% for parents, equating to an SD in night-time sleep duration of approximately 42–50 min. We provide estimates of both mother–child and father-child concordance at the population level and show parent–child correlations in all metrics, strongest for sleep offset and sleep onset and for mother–child pairs.
Strengths and weaknesses
This study reports valid, reliable, objective, free-living measures of child and parent sleep. Data were collected across the same week using the same protocols and devices for children and parents, strengthening our conclusions about parent–child concordance.
Despite study strengths, there are also study limitations. Limitations include the narrow age range for children (11–12 years), precluding generalisation to other childhood ages, the small number of fathers and participation of dyads rather than triads. Further, high attrition rates (53% of eligible participants took part) may have biased sleep estimates to reflect a relatively advantaged sample.
There are also a number of methodological issues that also need to be considered. First, sleep estimates are known to vary across actigraphy devices and analytical algorithms. For example, hip-worn monitors have been shown to overestimate sleep efficiency and duration when compared with wrist-worn monitors,48 and the need for further validity studies on the different algorithms that are integrated in the manufacturers’ software has been acknowledged.49 Second, it is often difficult to distinguish sleep from non-wear, and so there may be some residual upward bias for sleep duration and efficiency results. The algorithm used to detect sleep in this study has been reported to overestimate sleep by 31 min, when compared with polysomnography, the gold-standard method used to measure sleep.44 Lastly, since much of our understanding of sleep stems from self-report data, caution is needed when comparing objective sleep measures to previous literature. Sleep recommendations, for example, are based largely on normative self-reports and expert opinion.50 51 Self-reported sleep data are prone to recall, reporting and social desirability bias and may provide estimates about 30–60 min more than actigraphy-measured sleep.33 52–54
Meaning and implications for clinicians and policy makers
Sleep characteristics
Given widespread concerns that society is chronically sleep deprived and that people are not sleeping enough,55 56 it may appear both promising and surprising that our study finds almost all Australian middle-aged parents and more than 70% of children aged 11–12 years meet widely accepted sleep recommendations. However, we also find that sleep quality, measured as sleep efficiency, was less than recommended in 42% of Australian middle-aged parents and 55% of children aged 11–12 years. Although there are currently no clear guidelines on sleep variability, several publications have suggested that consistent sleep schedules are important57 and that day-to-day sleep variability should not exceed 1 hour.58 59 In this study, we find that 88%–92% of consecutive nights differ by less than 1 hour for parents and children, respectively.
Our findings are consistent with some, but not all, studies that objectively measure sleep duration and efficiency in children and adults of similar age groups.34 60–65 In a metareview, Ohayon and colleagues34 reported sleep duration of approximately 450–550 min and 360–460 min (vs 565 and 501 min) and sleep efficiency of approximately 87%–96% and 89%–98% (vs 85.4% and 84.1%) of children and adults of similar age groups, respectively. Discrepancies may be partly related to different sample characteristics and the use of different measurement and accelerometer devices and analytical algorithms. Few studies have examined sleep variability. Findings consistent with our own have been reported by Spilsbury and colleagues,66 who examined self-reported sleep duration in children aged 10–11 years, while Moore and colleagues67 reported higher sleep variability in objectively measured sleep, but in older children, which would be expected. Studies that have examined sleep variability of middle-aged adults have typically focused on clinical samples.20
Our study moves beyond the traditional approach of examining isolated sleep characteristics and provides normative sleep values for a wide range of sleep characteristics of a community-based sample, including sleep efficiency and variability, two sleep variables that are less frequently reported. This study is therefore in line with growing awareness that optimal51 healthy68 sleep may best be considered in terms of multiple sleep characteristic and is a step towards ongoing population sleep surveillance.69
Parent–child concordance
This study measures parent child concordance and found intergenerational concordance for all sleep characteristics: duration (r=0.22), onset (r=0.42), offset (r=0.58), day-to-day variability in duration (r=0.25) and efficiency (r=0.23). These findings are in contrast to previous studies, which reveal weaker correlations between self-reported parent and child sleep duration (r=0.02),30 onset (r=0.08–0.39)30–32 and offset (r=0.02–0.38).30–32 Given that previous studies mostly rely on self-reported sleep (open to recall, reporting and social desirability bias), our results should supersede earlier reports.
Twin studies have identified genetic factors as important determinants of habitual and disordered sleep,70 with the heritability of sleep duration and quality found to be 30%–40%.71 In our study, the strongest parent–child concordances were seen for those factors most likely to relate to household routines: bedtime, get-up time and day-to-day variability. Environmental factors may be extremely important determinants of sleep, given that sleep occurs within the constraints of the family home. For example, noise and lighting, as well as school and work start times, have been related to sleep and are likely to be strong determinants of family bed and rise times.69 Given that children aged 11–12 are dependent on their parents for care and transport, parents may, in a sense, be viewed as gatekeepers of their child’s day. Efforts to improve children’s sleep may therefore require a family-focused approach, whereby family sleep routines are considered, in addition to individual factors that may influence sleep (eg, homework).
Unanswered questions and future research
This study provides normative values for a wide range of sleep characteristics in a large, population-based sample of Australian middle-aged adults and children aged 11–12 years. These data provide reference values for future studies of LSAC participants and may contribute to a better understanding of the longitudinal association between sleep and health.
This study also identifies a need for further methodological studies to better understand and interpret objectively measured sleep characteristics. Calibration studies between different actigraphy device–algorithm combinations would be helpful to make meaningful comparisons of sleep measures attained from different methods. Given the growing awareness that sleep duration, as well as other characteristics of sleep, such as timing, variability and efficiency, may be important for health, future efforts are also needed to develop reference ranges for all objectively measured sleep characteristics.
To further decipher the role of environmental and genetic factors on population sleep, future studies that examine the concordance of sleep among biological and non-biological parent–child pairs, as well as differences in the concordance of sleep on weekdays and weekends, are needed. In the current study, we also report a weaker concordance for most sleep characteristics among father–child pairs compared with mother–child pairs; while a smaller father sample size may explain this finding, it is also possible that mothers continue to assume the traditional role of regulating household routines, such as meal times and children’s bedtimes and rise times. However, further research is also needed in this area.
In conclusion, we provide normative data of a wide range of different sleep characteristics for Australian middle-aged parents and their children aged 11–12 years. Our study suggests that both environmental and genetic factors may be important determinants of sleep timing.
Acknowledgments
This paper uses unit record data from Growing Up in Australia, the Longitudinal Study of Australian Children (LSAC). The study is conducted in partnership between the Department of Social Services (DSS), the Australian Institute of Family Studies (AIFS) and the Australian Bureau of Statistics (ABS). Research Electronic Data Capture (REDCap) electronic data capture tools were used in this study. More information about this software can be found at www.project-redcap.org. The authors thank the LSAC and CheckPoint study participants, staff and students for their contributions.
References
Footnotes
Contributors All authors conceptualised the manuscript. LM led the writing; FF, ACG, JM, MW and TO provided expert advice and critical review of the manuscript. ACG ran the analysis. MW is the principal investigator of the Child Health CheckPoint, planned the analyses and provided critical review of the manuscript. TO is a study investigator involved in the conception and oversight of the Child Health CheckPoint.
Funding This work was supported by the National Health and Medical Research Council (NHMRC) of Australia (project grants 1041352 and 1109355), The Royal Children’s Hospital Foundation (2014-241), the Murdoch Children’s Research Institute (MCRI), The University of Melbourne, the National Heart Foundation of Australia (100660) and Financial Markets Foundation for Children (2014-055 and 2016-310). MW was supported by the NHMRC (1046518) and Cure Kids New Zealand. The MCRI administered the research grants for the study and provided infrastructural support (IT and biospecimen management) to its staff and the study, but played no role in the conduct or analysis of the trial. The Department of Social Services played a role in study design; however, no other funding bodies had a role in the study design and conduct; data collection, management, analysis and interpretation; preparation, review or approval of the manuscript; and decision to submit the manuscript for publication. Research at the MCRI is supported by the Victorian Government’s Operational Infrastructure Support Program.
Disclaimer The findings and views reported in this paper are those of the authors and should not be attributed to DSS, AIFS or the ABS.
Competing interests None declared.
Ethics approval The CheckPoint study protocol was approved by The Royal Children’s Hospital Melbourne Human Research Ethics Committee (33225D) and the Australian Institute of Family Studies Ethic s Committee (14-26).
Provenance and peer review Not commissioned; externally peer reviewed.
Data sharing statement The Longitudinal Study of Australian Children datasets and technical documents are available to researchers at no cost via a licence agreement. Data access requests are co-ordinated by the National Centre for Longitudinal Data. More information is available at https://dataverse.ada.edu.au/dataverse/lsac.
Patient consent for publication Not required.