Article Text

Abstract
Objective Low neighbourhood socioeconomic status (NSES) has been linked to a higher risk of overweight/obesity, irrespective of the individual’s own socioeconomic status. No meta-analysis study has been done on the association. Thus, this study was done to synthesise the existing evidence on the association of NSES with overweight, obesity and body mass index (BMI).
Design Systematic review and meta-analysis.
Data sources PubMed, Embase, Scopus, Cochrane Library, Web of Sciences and Google Scholar databases were searched for articles published until 25 September 2019.
Eligibility criteria Epidemiological studies, both longitudinal and cross-sectional ones, which examined the link of NSES to overweight, obesity or BMI, were included.
Data extraction and synthesis Data extraction was done by two reviewers, working independently. The methodological quality of included studies was assessed using the Newcastle-Ottawa Scale for the observational studies. The summary estimates of the relationships of NSES with overweight, obesity and BMI statuses were calculated with random-effects meta-analysis models. Heterogeneity was assessed by Cochran’s Q and I2 statistics. Subgroup analyses were done by age categories, continents, study designs and NSES measures. Publication bias was assessed by visual inspection of funnel plots and Egger’s regression test.
Result A total of 21 observational studies, covering 1 244 438 individuals, were included in this meta-analysis. Low NSES, compared with high NSES, was found to be associated with a 31% higher odds of overweight (pooled OR 1.31, 95% CI 1.16 to 1.47, p<0.001), a 45% higher odds of obesity (pooled OR 1.45, 95% CI 1.21 to 1.74, p<0.001) and a 1.09 kg/m2 increase in mean BMI (pooled beta=1.09, 95% CI 0.67 to 1.50, p<0.001).
Conclusion NSES disparity might be contributing to the burden of overweight/obesity. Further studies are warranted, including whether addressing NSES disparity could reduce the risk of overweight/obesity.
PROSPERO registration number CRD42017063889
- neighbourhood socioeconomic status
- obesogenic environment
- overweight
- obesity
- meta-analysis
This is an open access article distributed in accordance with the Creative Commons Attribution Non Commercial (CC BY-NC 4.0) license, which permits others to distribute, remix, adapt, build upon this work non-commercially, and license their derivative works on different terms, provided the original work is properly cited, appropriate credit is given, any changes made indicated, and the use is non-commercial. See: http://creativecommons.org/licenses/by-nc/4.0/.
Statistics from Altmetric.com
Strengths and limitations of this study
This is the first meta-analysis study on the association of neighbourhood socioeconomic status with overweight/obesity.
The report is based on a large number of studies, covering over a million individuals, which improves the representativeness of the sample.
The studies included in this work are observational in design, precluding making causal inference.
The study shares the limitations of ecological studies.
All studies were conducted in high-income countries, which limits the generalisability of the findings to other setups.
Introduction
Obesity remains a major public health problem globally. While the current level of obesity has already posed a significant burden to the health system, the problem is still on the rise and causing more negative consequences at both individual and society levels.1 Worldwide, 39% of adults were estimated to be overweight in 2016. In the same year, 13% of adults were estimated to be obese; almost triple of the figure in 1975.1 WHO has prioritised the prevention and control of obesity as a central public health agenda and recommends nations to make a substantial improvement with regard to the current trend of obesity.2 However, the global progress to curb the rising overweight/obesity burden has been slow and frustrating, with each consecutive generation developing overweight/obesity at early ages and higher rates.3 4
Overweight/obesity is a multicausal problem, with risk factors originating from the various levels. It often arises from a complex interplay of individual, community, social and environmental factors. Ecological models of obesity causation have shown that the risk factors of overweight/obesity often interact with each other and might be of direct or indirect influences on the weight status of individuals.5–7 The main direct determinants are often unhealthy dietary pattern and insufficient physical activity, resulting in a positive energy balance and consequently high adipose tissue accumulation.8 9 The environment in which individuals live has a strong influence on one’s choice and adoption of health-enhancing behaviours.6 7 10 11 For example, residence in neighbourhoods of low socioeconomic status (SES) has been linked to a higher risk of overweight/obesity, irrespective of individual-level SES.12 There are various mechanisms through which neighbourhood’s SES (NSES) could influence residents’ weight status. One of the most frequently mentioned mechanisms is the ‘obesogenic environment’ hypothesis that low SES neighbourhoods promote an unhealthy dietary practice and sedentary lifestyle.12 13 In low SES neighbourhoods, health-enhancing facilities are often limited. However, energy-dense food items, alcohol and drug are often more readily available in low SES neighbourhoods.13 14 Another potential, but not a thoroughly examined mechanism, is the ‘stressful environment’ hypothesis that stressful area might increase the risk of overweight/obesity.14 Low SES neighbourhoods expose residents to more psychosocial stressors and higher risk of depression.14–16 Depressed individuals, compared with non-depressed, are more likely to adopt an unhealthy lifestyle, like unhealthy dietary practice and inadequate physical exercise, which might result in a higher risk of obesity.14 17 Besides, in low SES neighbourhoods, streets walkability and safety might be compromised; thus, limiting the residents’ movement.11 16 A multinational study in Europe showed that physical inactivity and unhealthy eating jointly accounted for almost a fifth of the association between NSES and body mass index (BMI).18
There are a number of empirical studies done on the link of NSES to overweight, obesity and BMI. The studies were, however, inconsistent in their findings. Some studies reported a null or weak association,19 20 while other studies reported a strong association between NSES and overweight/obesity.21 22 To date, there is no systematic review and meta-analysis report on the association of NSES with overweight, obesity or BMI. Thus, this study was done to provide summary estimates on the link of NSES to overweight, obesity and BMI. The findings would contribute to filling the gap in the literature and also facilitate evidence-based decision making as there is a better recognition of systematic review and meta-analysis findings in policy and decision-making processes.
Methods
This systematic review and meta-analysis work was conducted according to a priori published study protocol23 and following the recommendations of the Meta-analysis of Observational Studies in Epidemiology24 and the Preferred Reporting Items for Systematic Reviews and Meta-Analyses25 guidelines.
Literature search
Embase, PubMed, Scopus, Web of Sciences, Cochrane Library and Google Scholar databases were searched for studies published until 25 September 2019. The search terms were ‘neighborhood socioeconomic status’, ‘neighborhood socioeconomic condition’, ‘neighborhood socioeconomic index’, ‘neighborhood deprivation index’, ‘neighborhood poverty index’, ‘area deprivation’, ‘index of multiple deprivation’, ‘obesity’, ‘overweight’, ‘body mass index’, ‘weight’ and ‘central obesity’. A sample of the search strategy, PubMed search strategy, developed using a combination of MeSH terms and free texts is presented (online supplementary file 1). The PubMed search strategy was further adapted to the other databases. Additionally, handsearching of articles was done using the reference lists of the eligible studies and the ‘cited by’ function of PubMed. We aimed to include both observational and interventional studies (cross-sectional, case–control, cohort, longitudinal and randomised control studies). The literature search was not restricted by sex, age or geographical location.
Supplemental material
Study eligibility criteria
Articles found by the literature search were assessed for whether they fulfilled the predefined inclusion criteria of the study. The outcome variables of interest for this study were BMI (in kg/m2 and on a continuous scale), overweight and obesity. The exposure variable of interest was NSES (measured by composite index). There is neither a uniform nor a standardised approach of NSES measurement. However, in the existing literature, NSES has been often considered as a composite index, developed based on the results of principal component analyses of variables with the potential to indicate neighbourhoods’ economic conditions. The list of variables often used in the construction of NSES index includes the proportion of households owned by residents, the proportion of employed residents, the value of assets in the area, property ownership by residents, availability of health-promoting amenities and the literacy rate of the area. However, the specific set of variables used in the development of NSES indices often vary from study to study depending on many contextual and statistical factors, like data availability and the result of the principal component analysis. One of the criteria for including a study in this work was that the measurement of NSES in the study should be by composite indices like Neighbourhood Economic Status Indices (NSESIs), Neighbourhood Deprivation Indices (NDIs), Index of Multiple Deprivations or Neighbourhood Economic Hardship Indices. The commonly used indices are NSESI and NDI, both of which could be used to rank neighbourhoods into different SES categories, like low (deprived), middle and high (better-off) SES categories. Articles were excluded for any one of the following conditions: (1) animal studies, (2) study which focused on the physical, policy or social aspects of the environment, (3) language other than English, (4) citations without full text, (5) studies in which the outcome measure was not overweight, obesity or BMI, (6) studies in which participants’ nutritional status was not defined by BMI, (7) studies in which only crude (unadjusted) estimates were reported and (8) qualitative studies, book chapters, symposium and conference proceedings, essays, commentaries, editorials and case reports.
Study screening and data extraction
The results of the database search were exported to EndNote V.X8 software to remove duplicates and manage the screening processes. Then, the titles and abstracts of the retrieved studies were assessed by two reviewers (SHM and TDH), working independently and in duplicate, to determine their eligibility for full-text reviewing. The full-text reviewing was done by SHM and TDH, with disagreement resolved by consensus. The process of article screening and selection is presented in figure 1. SHM extracted the data, double checked by TDH. The data extracted from included studies were (1) study identification (first author, year of publication and title), (2) study characteristics (country, study design, sample size and follow-up period for longitudinal studies), (3) study participant’s characteristics (sex, proportion of men and mean age), (4) NSES assessment method, (5) outcome assessment method, (6) measure of association and reported estimate and (7) variables used for adjustment. The predefined measures of association were beta (β) of BMI, relative risk or OR. The beta (β) of BMI refers to the mean difference in BMI of individuals living in low and high SES neighbourhoods. The OR refers to the odds of overweight or obesity among individuals living in low SES neighbourhoods, compared with individuals living in high SES neighbourhoods. When a study reported two or more estimates on the same issue, we took the estimate that was adjusted for more variables and when a study reported multiple NSES comparisons, we took the estimate that compared the highest and the lowest NSES categories.

PRISMA flow diagram. PRISMA, Preferred Reporting Items for Systematic Reviews and Meta-Analyses.
Study quality assessment
The methodological quality of each of the included studies was assessed using the Newcastle-Ottawa Scale for grading the quality of observational studies.26 The tool uses three main parameters: (1) selection (assesses sample representativeness, sample size, non-response handling and exposure ascertainment), (2) comparability (assesses comparability of study groups and confounding control), and (3) outcome (assesses ascertainment of outcome and appropriateness of statistical tests). The quality grading was done out of 9, with scores from 0 to 3 indicating low quality, 4 to 6 medium quality and 7 to 9 high quality. The ratings for each study were compared between the two evaluators (SHM and TDH), with discrepancy resolved by consensus.
Statistical analysis
Separate meta-analyses were done for each of the three outcome measures: overweight, obesity and BMI. OR was used to pool the estimate of studies that reported on NSES–overweight and NSES–obesity associations, representing the odds of overweight or obesity among individuals living in low SES neighbourhoods, compared with individuals living in high SES neighbourhoods. Beta (β) values from linear regression analyses, representing the mean increase in BMI due to change in NSES from the highest to the lowest category, were used to pool the estimates of studies that used BMI, on a continuous scale, as an outcome measure. For all estimates, if p values were reported as p<0.001 with no 95% CI or SE, we assumed p=0.001 in calculating the corresponding 95% CI and SE
Heterogeneity among the studies was assessed by Cochran’s Q and I2 statistics, which quantify the proportion of variance attributable to between-studies heterogeneity. A non-substantial level of statistical heterogeneity was assumed when p<0.1 or I2 <50%.27 Sources of heterogeneity were assessed by conducting subgroup analyses using the predefined variables outlined in the study protocol,23 which were age category (adults vs children), study design (cross-sectional vs longitudinal), region (continent) and NSES measures. Due to a persistently high level of heterogeneity even after subgroup analyses, we calculated the summary estimates with random-effects model, which accounts for both within and between studies variations. Publication bias was assessed by both visual inspection of funnel plots and Egger’s regression test, unless the number of studies was inadequate and underpowered any of the statistical methods for assessing publication bias. A minimum of 10 studies is needed to ensure adequate power and assess publication bias.28 According to Egger’s test, publication bias is assumed at p<0.1.28 29 For estimates with evidence of publication bias, we aimed to do adjustment following the Trim and Fill method28 29 and provide both publication bias-adjusted and unadjusted pooled estimates. To evaluate the influence of each study on the pooled estimate, we conducted sensitivity analyses using the leave-one-out and analyse the rest method. For this purpose, we specifically used the ‘metaninf’ command of Stata, which provides a table and a graph of re-estimated results, omitting studies turn by turn. For a study to be excessively influential, the point estimate of the meta-analysis result, done with the omission of the study, should lie outside the 95% CI of the combined meta-analysis estimate, done with the inclusion of all studies.30 All statistical analyses were done using Stata software (V.15).
Patient and public involvement
This work was based on extracting data from published studies. There was no patient and public involvement in the development of the research question, design, outcome measures, study implementation and result communication.
Result
Search result and study characteristics
The search strategy generated a total of 6671 studies. Screening the title and abstract of these studies resulted in 94 studies eligible for full-text review. Reviewing the full text of the 94 studies, 18 studies were found eligible for inclusion. Through handsearching the references of the included studies and the ‘cited by’ function of PubMed, three additional articles were identified. The flow chart of the screening and selection process is shown in figure 1. The main characteristics of the 21 included studies12 19–22 31–46 are shown in table 1. The sample size of the studies ranged from 144 to 948 062 individuals, providing a total of 1 244 438 unique individuals, of whom 45% were males and 55% females. The studies were published from 2005 to 2018 and included both adults and children. The majority of the studies, 14/21 (67%), were cross-sectional in the design. The remaining 7 (33%) were longitudinal (cohort) studies. All studies were conducted in high-income countries: seven in USA, three in Canada, three in Germany, two in Australia, three in Sweden, one in France, one in UK and one in New Zealand.
General characteristics included studies
Association of NSES with overweight
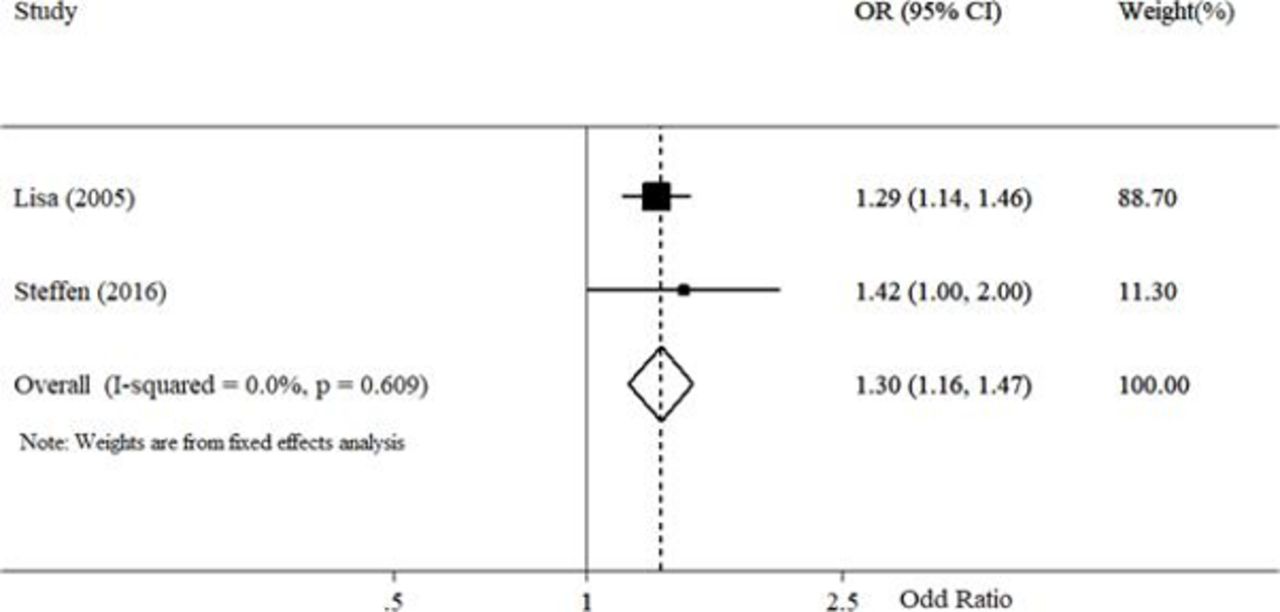
We found two studies that examined the link of NSES to overweight, as defined by 25≤ BMI<25 kg/m2. The summary odds of being overweight, compared with being not overweight (BMI <25 kg/m2), was 30% higher in individuals living in low SES neighbourhoods, compared with that of individuals living in high SES neighbourhoods (pooled OR 1.30, 95% CI 1.16 to 1.47, p<0.001). There was no evidence of significant heterogeneity (I2=0.00%, p=0.609). Figure 2 presents the result of the meta-analysis of the NSES–overweight association.

Forest plot of association of neighbourhood socioeconomic status (NSES) (low NSES vs high NSES) with overweight (overweight vs not overweight).
Association of NSES with Obesity
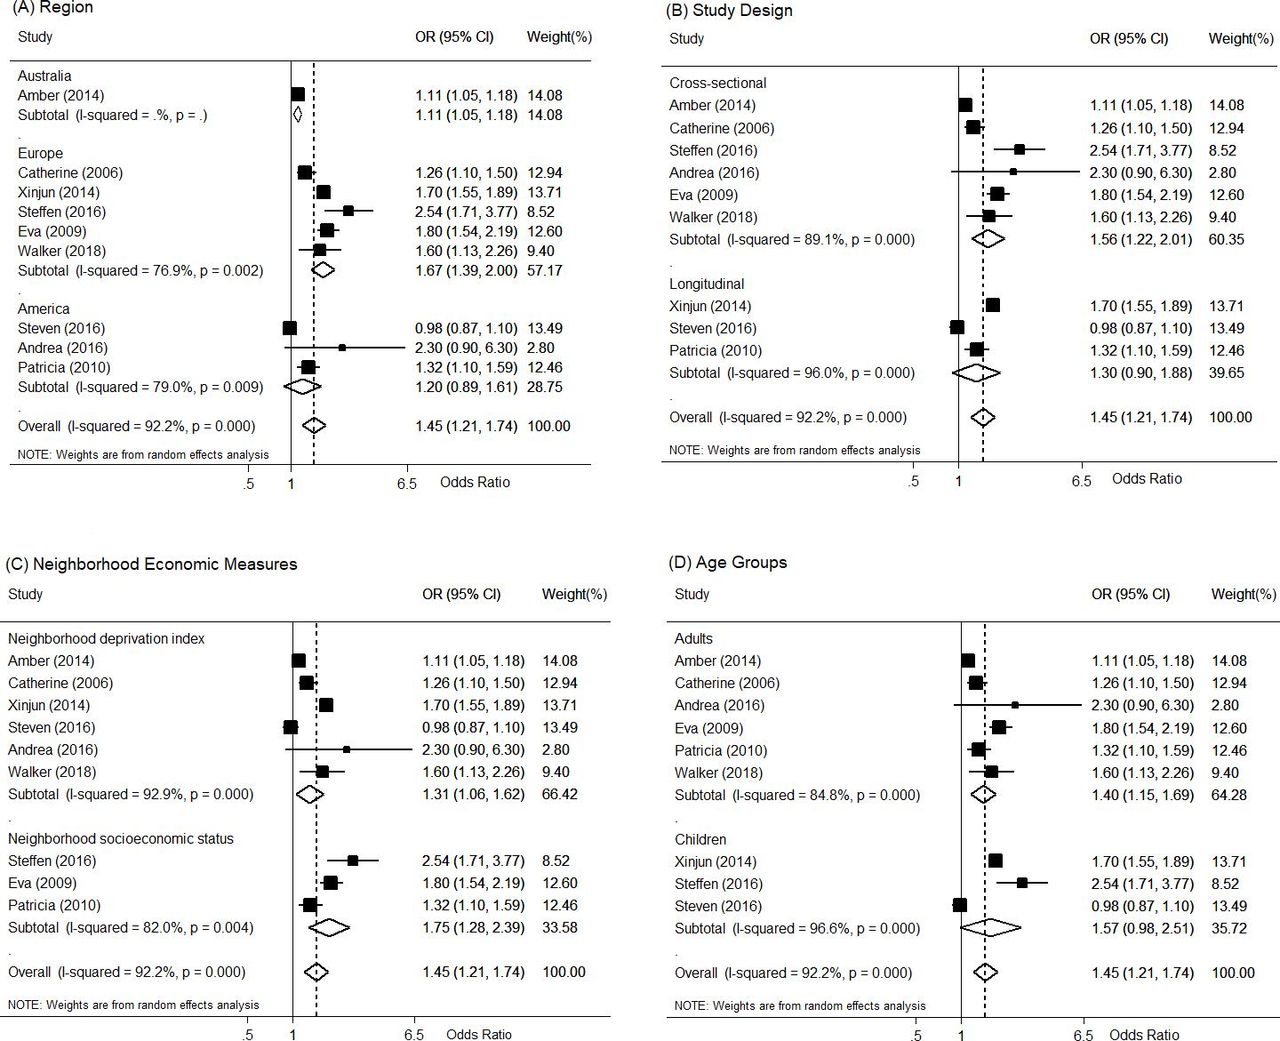
We found nine studies that examined the association of NSES with obesity, as defined by BMI ≥30 kg/m2. The odds of being obese, compared with being non-obese, was 43% higher in individuals living in low SES neighbourhoods, compared with that of individuals living in high SES neighbourhoods (pooled OR 1.45, 95% CI 1.21 to 1.74, p<0.001). Figure 3 shows the forest plot and the summary estimate of the meta-analysis of the NSES–obesity association done with all studies included. There was a high level of heterogeneity among the studies (I2=93.00%, p<0.001). We explored the sources of the heterogeneity by doing subgroup analyses. The subgroup-specific summary estimates with their corresponding heterogeneity levels are shown in figure 4. Across the three continents where the studies were done (Australia, America and Europe), NSES maintained a significant association with obesity (p<0.05). In children, residence in low SES neighbourhoods was associated with a 1.57 times higher odds of obesity, compared with residence in high SES neighbourhoods. However, the association was not statistically significant, although largely towards indicating the existence of a significant association (pooled OR 1.57, 95% CI 0.98 to 2.51). In adults, low NSES was associated a significantly higher odds of obesity, such that the odds of obesity was 1.40 times higher in adults living in low SES neighbourhoods, compared with that of adults living in high SES neighbourhoods (pooled OR 1.40, 95% CI 1.15 to 1.69). In terms of study design, NSES was significantly linked to obesity in cross-sectional studies, but not in longitudinal studies. It was not possible to assess publication bias for the NSES–obesity association as there was an inadequate number of studies, underpowering any of the statistical methods for assessing publication bias. The existing statistical tests require a minimum of ten studies to have adequate power to assess publication bias.28 To evaluate the influence of each study on the summary estimate, we conducted sensitivity analyses (table 2). Overall, no study notably changed of the direction as well as the magnitude the NSES–obesity association, with the summary OR ranging from the lowest 1.32 (95% CI 1.13 to 1.50) after excluding Li et al 43 to the highest 1.51 (95% CI 1.24 to 1.77) after excluding Alvarado et al. 41
Sensitivity analysis of studies on the association of neighbourhood socioeconomic status with obesityCoogan

Forest plot of association of neighbourhood socioeconomic status (NSES) (low NSES vs high NSES) with obesity (obese vs not obese).

Forest plot of association of neighbourhood socioeconomic status (NSES) (low NSES vs high NSES) with obesity (obese vs not obese), by subgroups.
Association of NSES with BMI
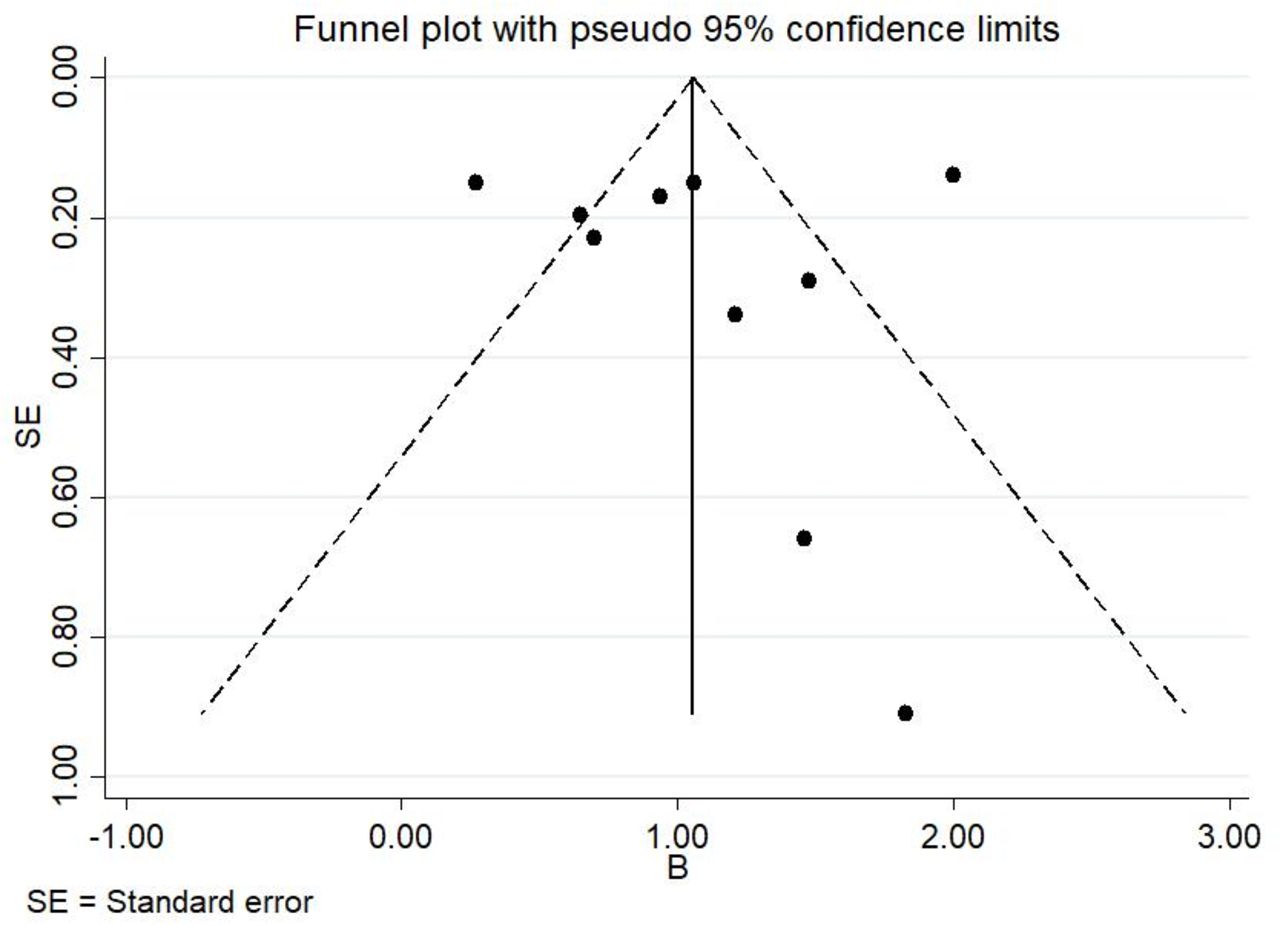
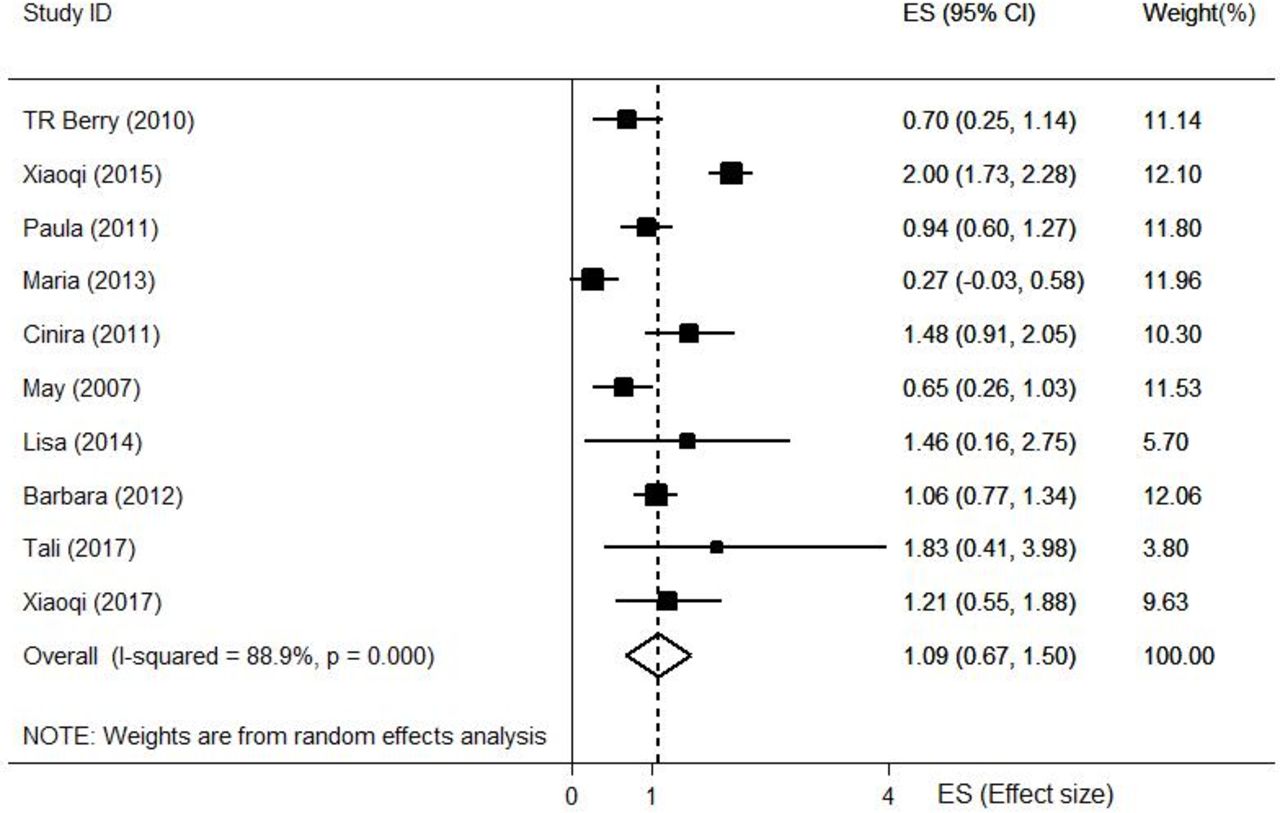
Ten of the 21 studies included in this work examined the relation of NSES with BMI, as a continuous variable. Overall, the summary estimate showed that NSES was significantly associated with BMI. The BMI of individuals living in low SES neighbourhoods was higher by a mean of 1.09 kg/m2, compared with the BMI of individuals living in high SES neighbourhoods (pooled β=1.09, 95% CI 0.67 to 1.50, p<0.001). Figure 5 shows the summary estimate of the association of NSES with BMI, calculated with random-effects model. There was a significant level of heterogeneity (I2 <0.001). Thus, subgroup analyses were conducted by the designs of the studies (cross-sectional vs longitudinal) and the methods of the NSES measures. In all subgroups, BMI was significantly higher in low SES neighbourhoods than in high SES neighbourhoods. Details of the results of the subgroup analyses by study design and NSES measurement methods are presented in figure 6. The result of the Egger’s regression test did not indicate the presence of a significant level of publication bias (p=0.903). The funnel plot of the NSES-BMI studies is shown in figure 7. The result of the sensitivity analyses of the studies on the NSES–BMI association is shown in table 3. Overall, no study notably influenced the direction as well as the strength of the NSES–BMI association, with the pooled β ranging from the lowest 0.90 (95% CI 0.62 to 1.19) after excluding Feng et al 32 to the highest 1.19 (95% CI 0.80 to 1.58) after excluding Gose et al.34
Sensitivity analysis of studies on the association of neighbourhood socioeconomic status with body mass index

Forest plot of association of neighbourhood socioeconomic status (NSES) (low NSES vs high NSES) with body mass index.

Forest plot of association of neighbourhood socioeconomic status (NSES) (low NSES vs high NSES) with body mass index, by subgroups.
Funnel plot of association of neighbourhood socioeconomic status (NSES) (low NSES vs high NSES) with body mass index.
Discussion
This study was done to pool the existing empirical evidence on the link of NSES to overweight, obesity and BMI. Overall, NSES was found to be significantly associated with the three outcome measures, such that low NSES was significantly linked to high odds of overweight, obesity and a higher mean BMI.
The findings of this work were consistent with the reports of previous studies that reported higher odds of overweight/obesity as well as other poor health outcomes in individuals living in low SES neighbourhoods than in individuals living in high SES neighbourhoods.22 43 44 The influence of neighbourhood deprivation is not limited to only body weight. It has also been linked to various poor behavioural and health outcomes like drug abuse, cardiovascular diseases and poor mental health.15 47 Thus, improving NSES has been recommended as a potential strategy for prevention and control of the current obesity epidemics and other chronic illnesses.15 47 The mechanisms through which NSES contributes to the development of overweight/obesity have not been thoroughly documented. Despite the ongoing debate on which of the mediating factors deserves the most responsibility for the link of NSES to body weight, most factors are, however, believed to influence weight mainly through influencing the energy balance, that is, the balance of calorie intake and loss.9–11 Low SES neighbourhoods have been associated with a high availability of energy-dense and junk food outlets, but a low availability of fruit and vegetable outlets and limited sporting facilities. Low SES neighbourhoods have also been related to a higher risk of depression, which could subsequently lead to a higher risk of overweight/obesity.14
In this work, there was discrepancy in the NSES–obesity association by study designs, that is, between cross-sectional and longitudinal studies. A statistically significant NSES–obesity association was demonstrated in the cross-sectional studies, but not in the longitudinal studies. However, it is worth noting that the NSES–obesity association was consistently demonstrated across the other subgroup analyses by age (adults vs children), NSES measures (NSESI vs NDI) and outcome measures (overweight vs obesity). The discrepancy by study design was also not observed in the NSES–BMI association, in which NSES demonstrated significant statistical links to BMI in both longitudinal and cross-sectional studies. There are a number of possible reasons that could explain the discrepancy in the NSES–obesity association between cross-sectional and longitudinal studies. First, it could be most probably due to the fact that only two longitudinal studies were included in the NSE–obesity association analysis. Second, there was no uniformity in how confounding was controlled among the included studies, in terms of both the number and the type of variables used for adjustment. This lack of uniformity across the studies in covariates adjustment might in part explain the discrepancy in the NSES-obesity summary estimates by study designs. Third, it could also be due to the use of a dichotomised outcome variable (obesity), instead of a continuous outcome variable (BMI). Unless it is mandatory, dichotomisation of continuous variables is not recommended as it reduces sample power by almost 50% and could result in false no association findings, particularly if the true association is weak.48 49 In support of this, we observed no discrepancy between cross-sectional and longitudinal studies in all NSES-BMI summary estimates, in which the outcome was BMI on a continuous scale. Fourth, it could be due to the differences in measures of magnitude and associations of events between cross-sectional and longitudinal studies. Classically, cross-sectional studies measure the prevalence of events (which includes both new and old events), but longitudinal studies measure the incidence of events (which includes only new events). In cross-sectional studies, risk could not be directly measured, unlike in longitudinal studies in which it could be directly measured. Besides, reverse causality could not be ruled out in cross-sectional studies.50 However, as none of the above reasons could definitively explain the NSES–obesity discrepancy by study design, we recommend further meta-analyses works when more longitudinal or quasi-experimental studies become available.
The finding of this study might indicate the importance of investigating as well as addressing the determinants of overweight/obesity comprehensively, that is, examining and addressing the proximal behavioural risk factors of obesity and its underlying environmental and other structural risk factors. However, the existing literature is largely focused on investigating and addressing the individual-level behavioural influences of obesity.7 For example, the evidence is limited about how, and to what extent, neighbourhood socioeconomic conditions influence individuals’ dietary practice and physical activity level. Whether improving neighbourhood economic deprivation could result in the adoption of health-enhancing lifestyle also remains largely unknown. Besides, the existing reports on the link of NSES to an unhealthy weight, including the report of this work, are largely based on observational studies. Thus, further investigations with better designs, like community-based longitudinal studies, are needed to reach into a better conclusion on the relationship. Meanwhile, it might be worthy of considering a comprehensive approach when developing obesity prevention and control strategies, including addressing neighbourhood economic disparities. So far, obesity interventions have been primarily focused on providing health information and strategies to address its individual-level determinants. However, unless supported by an enabling environment, the individual-level efforts or the provision of health information alone might not lead to the intended result as fast as needed. Thus, the lack of comprehensiveness and integration of interventions might partly explain the current non-promising progress of obesity prevention and control approaches.4 16 Low SES neighbourhoods often lack health-promoting amenities, like sport facilities and fruit/vegetable outlets.13 We believe that addressing neighbourhood deprivation, by availing healthier choices closer and affordable to everyone, might facilitate the adoption of health-enhancing behaviours, thereby reducing the risk of overweight/obesity. However, the proposition needs to be further examined.
Limitations and strengths
This work has many limitations. There was no uniformity among the studies in the way NSES was measured. Though NSES was treated as a composite variable in all included studies, the specific set of variables used to develop the NSES indices varied from one study to another. There was also variation across the studies in terms of the type and number of covariates used for adjustment of the reported estimates. The lack of uniformity in the NSES measures and the covariates adjusted for might have introduced heterogeneity and undermined the comparability of the studies. All studies included in this work were done in high-income countries. The lack of data from low-income and middle-income countries would limit the generalisability of the findings. NSES–obesity association would vary by countries’ SES. In low/middle-income countries, due to the traditionally held positive attitude toward overweight, low NSES might be associated with a lower risk of overweight/obesity, unlike the case in high-income or developed countries. Therefore, the findings of this work might not be applicable to developing countries. All studies included in this work were observational in design, making casual inference impossible. The possibility of reverse causality could not be ruled out, that is, instead of high SES neighbourhoods promoting healthy weight, it could be possible that individuals with a normal weight are more interested in health and therefore prefer living in high SES neighbourhoods. In this meta-analysis, ecological studies were included. Thus, it also shares the limitations of ecological studies. We also did not examine the relation of NSES with waist circumference and waist to hip ratio, though they are also measures of adiposity and nutritional status. To the best of our knowledge, this is the first systematic review and meta-analysis study on the link of NSES to overweight, obesity and BMI. Thus, it would be contributing to filling the existing gap in the literature. The inclusion of multinational studies, a large number of study participants and individuals of all age groups could improve the representativeness of the study.
Conclusion
We found that living in low SES neighbourhoods, compared with living in high SES neighbourhoods, was associated with higher odds of being overweight and obese as well as a higher mean BMI. Evidence on the association of NSES with weight status is limited in low-income and middle-income countries. The exact mechanism by which low NSES contributes to an unhealthy weight gain and whether addressing NSES disparity reduces the risk of obesity are largely unclear. Thus, further studies are warranted to better understand how NSES influences weight and whether addressing NSES disparity could reduce the risk of overweight/obesity. Meanwhile, addressing NSES disparity and bringing healthy choices closer and affordable to everyone might be important to curb the current trend of obesity.
References
Footnotes
Twitter @Tesfa Dejenie.
Contributors SHM conceived and lead the study, carried out literature search, performed quality assessment, analysed the data and wrote the manuscript. TDH, TAS, MMB, BST and SA performed literature search, screening, data extraction and quality assessment as second reviewers. AE supervised the work. All authors read, commented and approved the final manuscript.
Funding The authors have not declared a specific grant for this research from any funding agency in the public, commercial or not-for-profit sectors.
Competing interests None declared.
Patient consent for publication Not required.
Provenance and peer review Not commissioned; externally peer reviewed.
Data availability statement All data relevant to the study are included in the article or uploaded as online supplementary information.