Article Text

Abstract
Objectives The aims of this study were to: (1) describe alcohol industry corporate social responsibility (CSR) actions conducted across six global geographic regions; (2) identify the benefits accruing to the industry (‘doing well’); and (3) estimate the public health impact of the actions (‘doing good’).
Setting Actions from six global geographic regions.
Participants A web-based compendium of 3551 industry actions, representing the efforts of the alcohol industry to reduce harmful alcohol use, was issued in 2012. The compendium consisted of short descriptions of each action, plus other information about the sponsorship, content and evaluation of the activities. Public health professionals (n=19) rated a sample (n=1046) of the actions using a reliable content rating procedure.
Outcome measures WHO Global strategy target area, estimated population reach, risk of harm, advertising potential, policy impact potential and other aspects of the activity.
Results The industry actions were conducted disproportionately in regions with high-income countries (Europe and North America), with lower proportions in Latin America, Africa and Asia. Only 27% conformed to recommended WHO target areas for global action to reduce the harmful use of alcohol. The overwhelming majority (96.8%) of industry actions lacked scientific support (p<0.01) and 11.0% had the potential for doing harm. The benefits accruing to the industry (‘doing well’) included brand marketing and the use of CSR to manage risk and achieve strategic goals.
Conclusion Alcohol industry CSR activities are unlikely to reduce harmful alcohol use but they do provide commercial strategic advantage while at the same time appearing to have a public health purpose.
- alcohol industry
- harmful drinking
- Iard
- public health
- corporate social responsibility
This is an open access article distributed in accordance with the Creative Commons Attribution Non Commercial (CC BY-NC 4.0) license, which permits others to distribute, remix, adapt, build upon this work non-commercially, and license their derivative works on different terms, provided the original work is properly cited, appropriate credit is given, any changes made indicated, and the use is non-commercial. See: http://creativecommons.org/licenses/by-nc/4.0/.
Statistics from Altmetric.com
Strengths and limitations of this study
Use of a global database of industry activities that is likely to be comprehensive and representative of the alcohol industry’s corporate social responsibility activities.
A 30% sample was selected from the International Alliance for Responsible Drinking database. Different conclusions may have resulted with a larger sample.
Unable to determine whether the industry actions represented significant charitable contributions or were merely activities that in some cases would have been conducted anyway (eg, those required by law).
Although all raters were initially trained to an acceptable level of reliability, we cannot rule out differential bias in the raters recruited from different regions.
Introduction
Corporate social responsibility (CSR) refers to business practices that help companies manage their economic, social and environmental impacts, and their relationships in key areas of influence, such as the marketplace, the supply chain, the community and the public policy arena.1 2 The notion that commercial enterprises can ‘do well’ (eg, improve their brand image, increase their profitability) by ‘doing good’ (ie, contribute to socially beneficial groups and causes) has motivated this rapidly expanding global movement.3 4 While the motives behind CSR vary, they appear to be indirectly related to the financial performance of corporations.5 6 CSR has been described as one of the few remaining strategies for unhealthy commodity industries (eg, tobacco, alcohol, gambling) to present their products in a positive light and thereby improve their reputations.7 8 Evidence indicates that the tobacco industry used CSR activities to improve their image, deflect criticism, enable access to policy makers and mitigate legal risks, thereby increasing profits.7 9–11 Despite a substantial amount of published research that has questioned the motives of the alcohol industry’s CSR activities,12–15 little is known about the characteristics of these activities or their impact on public health.16
The alcohol industry has invested significant resources to promote CSR initiatives around the world. In what is perhaps the largest initiative of its kind, on 9 October 2012, 11 major global producers of alcoholic beverages and two major trade associations issued a set of ‘Producers’ Commitments’ to reduce harmful drinking (http://www.producerscommitments.org/default.aspx). To illustrate the industry’s efforts to fulfil these commitments, an industry-sponsored database (initially posted at initiatives.global-actions.org, but subsequently removed) was created by the International Centre for Alcohol Policies (ICAP), now called the International Alliance for Responsible Drinking (IARD). The database was an inventory of over 3500 industry actions conducted in support of the WHO Global strategy to reduce the harmful use of alcohol (Global strategy).17 The Global strategy is a menu of 10 evidence-based policy options that the WHO member states can use to achieve reductions in harmful alcohol use. Contributors to the industry-supported database included multinational producers of beer, wine and distilled spirits; alcohol distributors and wholesalers; members of related industries, such as hotels, restaurants, bars and advertisers; and industry-affiliated social aspect and public relations organisations (SAPROs).
The present study had three aims: (1) to describe the global distribution of the industry actions according to geographic regions and high-resource and low-resource areas; (2) to estimate the benefits accruing to the industry in terms of marketing potential, impact on regulatory policy and type of CSR strategy; and (3) to evaluate the public health impact of the industry actions in terms of their likely effectiveness and potential harm. We were particularly interested in the extent to which the industry’s actions conformed to options recommended by WHO and the evidence base that informed the Global strategy. This is the first comprehensive analysis of the 3500 industry actions posted on the ICAP/IARD website. Analyses of the drinking and driving initiatives18 and the marketing potential of the initiatives conducted in Latin America and the Caribbean15 have been published in prior reports.
Considering the significant contribution alcohol makes to global disease burden,17 this study evaluated whether the Global Producers’ actions reflect evidence-based approaches likely to reduce alcohol harm, or whether they are mainly conducted as a form of ‘stakeholder marketing’19 designed to produce favourable public perceptions and less restrictive regulatory environments. To answer this question, we conducted a systematic evaluation of a sample of the industry actions using a content rating procedure designed to evaluate their public health implications and commercial benefits.
Methods
From 2014 until 2016, 19 trained raters from Brazil, Argentina, the USA, the European Union (EU) and Australia analysed a sample of 1046 industry actions. Data were exported from the website’s print view from August 2013 to August 2015 prior to the database being shut down without explanation in April 2016. Actions were sorted by region according to the geoscheme created by the United Nations Statistics Division (UNSD), and then alphabetically by action title. Units were selected so that the sampling strata maintained the proportions of the ‘target population,’ which in this case is the total number of industry actions (n=3551). This means that each stratum (UNSD geographic region) has the same sampling fraction. Using data from two countries (USA and UK) and one region (Latin America and the Caribbean) where all industry actions were rated, we determined that a proportionate sample size of 30% provided an accurate estimate of the actual distribution. The random sample generator function in SPSS Windows V.24 was used to select the 30% sample from each United Nations (UN) region and those labelled by ICAP/IARD as ‘international’ or ‘global’ (n=1046).
Descriptive measures
An evidence benchmarking protocol was used to extract information on the sponsoring organisation, partners, year started, country and industry-reported evaluation (if applicable) for each industry action sampled from the database. Based on the short qualitative summaries of the actions (mean words per action=132) provided on the website, we assigned numeric codes for the type of partners listed (eg, government, non-governmental organisation, SAPRO, trade association, etc.) and for the type of evaluation reported by the industry (process evaluation, uncontrolled outcome evaluation, controlled outcome evaluation or ‘does not meet the minimum criteria’). We used country names to define geographic regions following the UNSD classification of geographic regions (eg, Africa, Asia) and subregions (eg, Latin America and the Caribbean) (https://unstats.un.org/unsd/methodology/m49/) and the World Bank database (https://data.worldbank.org/country) to define country income-level.
Estimated population reach refers to the number of people in the target group that could be served when an intervention is provided under real-world conditions. Coding options were none, small, moderate and large. This variable is relative and was coded after raters were trained using model scenarios. For example, if the action was implemented across the entire USA, but only reached 10 000 people, it was coded as small.
In addition to these descriptive characteristics of the industry actions, we also coded whether the activity was likely to produce benefits to the alcohol industry, and the ways in which society in general would benefit (or be harmed). These variables and their operational definitions are described in table 1.
Measurement domains, variables measured and coding options used in content analysis of alcohol industry corporate social responsibility activities
Measures of industry benefits (‘doing well’)
Each industry action was coded for marketing potential. If the action involved giving away promotional materials or marketed a specific product, it was coded as having ‘possible’ marketing potential. Actions that did not meet this criterion and all activities undertaken by trade organisations or SAPROs were rated as having no marketing potential.
The policy impact potential of each action (ie, whether the action had the potential to impact national or local policy) was coded as ‘none’ or ‘possible’. We coded only activities that had a clear political or policy impact as ‘possible’.
The type of CSR was coded based on previously published definitions.20 Coding options were ‘none’—not having a social or environmental responsibility interpretation or not reflecting positively on the company; ‘altruistic’—responsibilities that reflect giving back time or money to contribute solely to the well-being of a community or society at the possible expense of the business; ‘risk management’—legal or ethical obligations that are socially required; or ‘strategic’—aimed at achieving business goals while also promoting societal welfare. Coders were provided with examples and indicators for each type of CSR to minimise subjective bias.
Societal benefit measures (‘doing good’)
Raters assessed whether the initiative fit into any of the 10 WHO Global strategy target areas. If a clear match was not possible, based on descriptions in the WHO17 Global strategy, the initiative was coded as either ‘not classifiable’ because of insufficient information, or ‘not compatible with any of the ten categories.’
Activity type was coded for each action in order to identify actions that had evidence of effectiveness.21 Activities were coded according to a list of 67 interventions, campaigns, programmes and policies that had been evaluated in prior research for effectiveness.21 Actions that did not fit these activity types were coded as ‘other’, which had 12 subcodes. These included administrative changes by a particular company, online media campaigns, industry-sponsored research, conference sponsorships, information for parents, promotional events and activities unrelated to reducing the harmful use of alcohol, such as scholarships for students being trained in the hospitality industry.
Evidence of effectiveness was coded from the public health perspective21 22 by assigning scores to each coded activity to estimate its potential for reducing alcohol-related harm: 0=lack of effectiveness; 1=limited effectiveness; 2=moderate effectiveness; 3=high degree of effectiveness; 9=no studies have been undertaken or there is insufficient evidence on which to make a judgement.
Harm potential was also assessed for each action. If an action was considered likely to pose a risk of harm based on current theory or evidence, harm potential was coded as ‘possible’. Raters were instructed to code harm potential very conservatively, based on the available evidence.
Training of raters
Nineteen public health professionals with expertise in alcohol control policy from Latin America (9), USA (3), the EU (5) and Australia (2) analysed the industry actions within their respective regions. A rater training workshop was conducted by the protocol authors with each regional team prior to the start of the global project to ensure consistency. After the raters were trained at regional sites using a standardised protocol, they each rated the same 35 randomly selected actions from the database, compared their ratings to the ratings of the protocol authors and discussed discrepancies with experts until consensus was achieved. A second round of another 35 randomly selected initiatives was then conducted. After achieving an acceptable level of inter-rater reliability (kappa >0.60), the raters continued rating the remaining actions independently.
Statistical analyses
Data was analysed using SPSS for Windows V.24 (Armonk, New York, USA: IBM Corp.). Omnibus χ2 tests were used to determine significant differences in variables that were dichotomous (eg, marketing potential) or categorical (eg, sponsoring organisations) across UN geographic regions that conformed approximately to the WHO regions used for administrative and statistical purposes.
Significance was set at p<0.05. To understand the meaning of a significant omnibus test, several logistic regressions were used. In each model, a single UN region was compared against the rest of the world for a specific dependent variable. For instance, the prevalence of industry actions that had marketing potential in Africa was compared against the prevalence of industry actions with marketing potential in all other UN regions combined. Statistical significance was determined using 95% CIs of the resultant ORs. This method allowed for increased interpretability of the results, while limiting the impact of type I error, which would have been a serious concern had pairwise comparisons been implemented. χ2 tests and Spearman correlations were also used to determine whether population reach was correlated with marketing potential and effectiveness.
Results
Table 2 presents descriptive information about the actions. More than half of the actions were conducted in Europe (57.7%), and 76% were based in high-income countries (HICs). Less than 8% of actions were conducted in lower-middle and low-income countries. Despite the claims of ICAP/IARD that the actions were conducted ‘in support of’ the Global strategy,17 most (65.7%) were initiated prior to the 2010 release of the Global strategy, and some (10.4%) prior to 2000, according to the dates provided in the listings.
Characteristics of industry actions to reduce harmful drinking online compendium (n=1046)
Doing well: benefits accruing to the industry
The first three sections of table 3 show the regional percentages, ORs and CIs of three benefits accruing to the alcohol industry. Overall, 26.5% of the actions were rated as having a marketing potential, 15.2% had the potential to have a policy impact and 18.0% were classified as having a ‘strategic’ CSR function. The proportion of actions that were considered to have one or more of these benefits was 46.0%.
Percentages, ORs and 95% CIs by region for marketing potential, potential policy impact and strategic corporate social responsibility (CSR)
Activities coded as having a marketing potential included giving away branded merchandise and adding a responsible drinking message to the product’s commercial advertising materials. There were significant differences in industry actions that contained marketing potential across UN regions (χ2 = 47.44; df=6; p<0.01). Actions conducted in Latin America and Africa were significantly more likely to have marketing potential compared with actions conducted in all other regions (table 3). Actions conducted in Oceania had a significantly lower likelihood of marketing potential.
We also evaluated the association between estimated population reach and marketing potential. Of the 277 actions with marketing potential, 44.4% had moderate to large population reach (χ2 = 29.31; df=1; p<0.01). The Spearman correlation indicated a positive association, which was statistically significant (rs(1046)=0.158, p =<0.01).
Fifteen per cent (15.2%) of actions were found to have the potential to influence policies, for example, sponsoring of a traffic safety council or conducting workshops for policy makers (table 3). Actions with policy potential differed significantly among regions (χ2 = 26.58; df=6; p<0.01). Actions in Africa, Oceania and those conducted on an international scale were considered more likely to have a policy impact.
Regarding the type of CSR, the majority of sampled actions (77.4%) were coded as ‘risk management’ (eg, ‘responsible drinking message added to labels’) while 18.0% were coded as strategic CSR (eg, a conference promoting self-regulation of alcohol advertising) (table 3). The number of actions categorised as having a strategic CSR approach was significantly different across regions (χ2 = 36.15; df=6; p<0.01). A strategic CSR approach was more likely to be used on an international scale and in the African Region. Actions in North America were less likely to take a strategic CSR approach. Less than 2% (1.6%) of actions were coded as altruistic type CSR. Three per cent of actions were coded as not fitting any CSR approach.
Doing good: public health impact of the industry actions
Table 4 shows the regional percentages, ORs and CIs of industry actions that were consistent with the WHO Global strategy targets. Overall, only 27.1% were considered classifiable into the WHO target areas, which was significantly different between UN regions (χ2 = 34.68; df=6; p<0.01). Actions in Africa and North America were more likely to fall under one of the 10 Global strategy target areas, although the majority of actions remained inconsistent with the Global strategy.
Percentage, ORs and 95% CIs of actions rated as meeting WHO Global strategy target areas and actions with potential for harm, by region (n=1046)
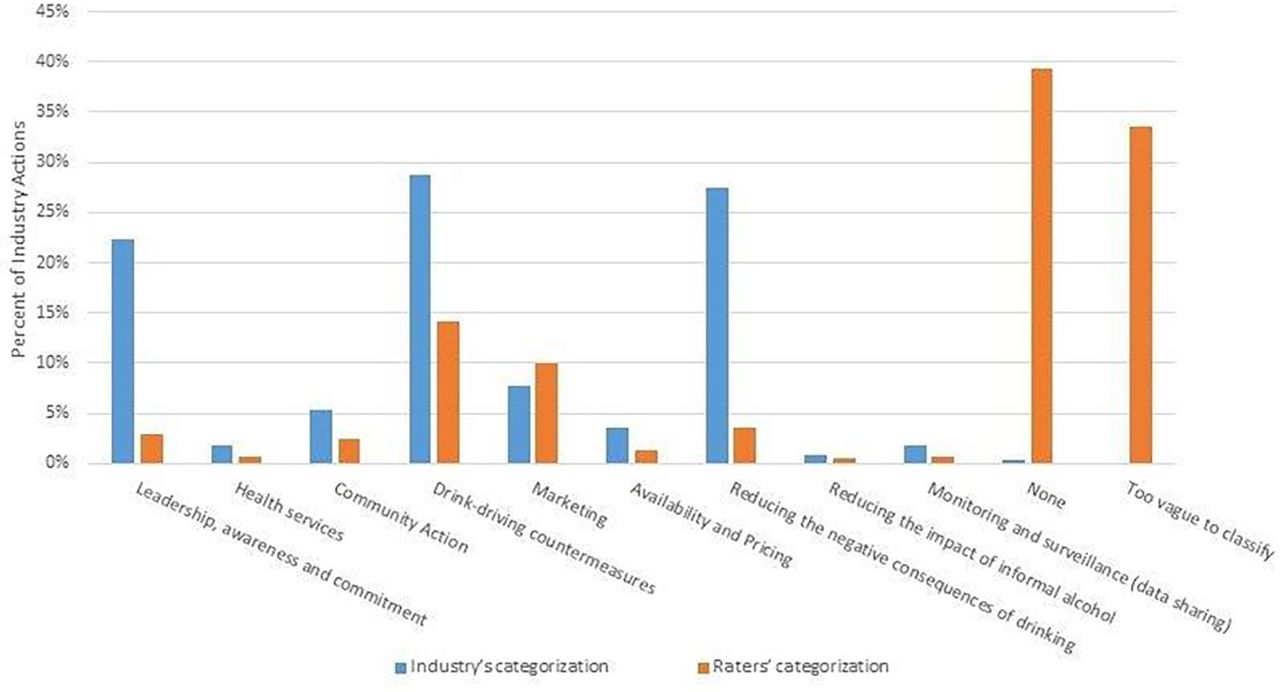
Figure 1 compares the proportions classified into the 10 WHO Global strategy areas by the public health raters with those classified by the industry and reported on the ICAP/IARD website. The table shows substantial discrepancies between the proportions assigned to three key areas: leadership (22.3% ICAP/IARD vs 3.0% public health raters), drinking and driving initiatives (28.7% vs 14.1%) and reducing negative consequences (27.4% vs 3.6%). The main reason for these discrepancies was that the public health raters, using WHO definitions of the target areas, were not able to classify 72.9% of the actions into any of the 10 categories, either because they clearly did not fit the definitions (39.3%) or they were too vague (33.6%).

Percent of industry actions classified by International Alliance for Responsible Drinking and by health professionals according to WHO Global strategy target areas.
In addition to the ratings based on the WHO target areas, separate ratings were conducted to classify the specific type of activity and to estimate its potential effectiveness. Table 5 shows how the actions were classified according to activity type and evidence for effectiveness. The majority of actions (75.9%) were coded ‘other’ activity types which have not been evaluated in the literature. Activities coded here include posters, leaflets and websites, industry-sponsored conferences, funding of SAPRPOs and updates to producer employee handbooks. Each activity code was assigned an effectiveness score based on expert consensus ratings.21 22 Since there were only 33 actions coded as limited, moderate or high effectiveness, these three categories were collapsed. There were considerably more ineffective actions or actions of unknown effectiveness (96.8%) compared with effective actions overall (p<0.01). Nearly half of the actions (46.8%) were activities that have not been evaluated in the research. Over 20% (21.0%) were activities that were not relevant to public health (ie, funding of SAPROs). Twenty-nine per cent of the actions have been evaluated in the alcohol literature21 and have been found not to be effective; 1.3% were found to have limited effectiveness. Only 1.8% of total activities sampled had evidence of moderate to high effectiveness (eg, minimum legal alcohol purchase age).
Activity type by level of effectiveness (n=1046)
Another part of the content ratings focused on the potential of the action to cause harm (eg, using the Grand Prix racing event to launch an awareness campaign). Eleven per cent of actions were found to have the potential to cause harm from a public health perspective, which was significantly different across regions (χ2 = 32.98; df=6; p<0.01). Actions that had a potential for harm were most likely to occur in Latin America and the Caribbean (LAC) and Oceania and were least likely to occur in North America (table 4).
Discussion
The present analysis of CSR activities conducted by alcohol industry bodies ostensibly in support of the WHO’s Global strategy adopted a perspective that contrasted public health interests with the commercial interests of the alcohol industry. While the actions were found to be conducted disproportionately in HICs of Europe and North America, actions in Africa and LAC were found to be significantly associated with an increased likelihood for marketing potential. This is consistent with research suggesting that competitive industries that depend on marketing to sell their products are more likely to include product marketing in their CSR activities,3 and that the large producers are targeting developing countries.23 24 The positive association found between marketing potential and population reach provides further indication that industry segments may be using the industry actions for marketing purposes.
Regarding the benefits accruing to the alcohol industry (‘doing well’), our analyses show that the industry’s CSR activities tend overwhelmingly to be oriented towards risk management and achieving strategic goals. Research suggests that industry-funded educational campaigns lead to positive views of that industry.25 As Bond, Daube and Chikritzhs26 note, alcohol industry documents further demonstrate the public relations benefit of ‘responsibility’ messages and education campaigns.
Although alcohol industry bodies promoted the online inventory as a reflection of their commitments to the WHO 2010 Global strategy, 72.9% of the industry actions we evaluated were scored as not conforming to the WHO recommended target categories. Some activities (eg, a brewery’s 60th anniversary celebration) seemed to contradict the intent of the Global strategy and were seemingly inconsistent with the stated purpose of the alcohol industry actions. There were also major differences between the industry’s classification of their own actions and those conducted by the expert raters. Whereas ICAP/IARD classified most (75%) of the actions under the areas of leadership, drinking-driving countermeasures and reducing negative consequences, the raters found that almost one-third were too vague to classify and another 38% did not fit any of the WHO categories. As an industry-funded SAPRO, ICAP/IARD had a clear conflict of interest that could have biased their interpretation of the actions, as had been demonstrated in prior analyses of their international activities.27 28 Of note, most of the actions had start dates before the WHO Global strategy was issued, raising questions about the screening process used and the aims of the database.
Estimates of the public health benefits and harms showed that the overwhelming majority (96.8%) of industry actions lacked scientific support of their effectiveness in reducing harmful drinking and a small percentage (11.0%) had the potential for doing harm. The Guidelines on Implementation of Articles 5 and 13 of the WHO Framework Convention on Tobacco Control propose a ban on all contributions from tobacco companies to any other entity for ‘socially responsible’ causes as ‘the aim, effect, or likely effect…is to promote…(the) product or use, either directly or indirectly’.29 Our analysis suggests that a similar ban would be appropriate for the alcohol industry. This caveat was reiterated by then WHO Director General Margaret Chan in her statement that alcohol companies should have ‘no role in the formulation of alcohol policies, which must be protected from distortion by commercial or vested interests’.30
One strength of this study is its use of a global database of industry activities that is likely to be comprehensive and representative of the alcohol industry’s CSR activities. Our analysis indicates that those activities contribute minimally to the public health efforts of the WHO. This research also had some methodological limitations. Because of resource limitations, we evaluated only a sample from the IARD database. Different conclusions may have resulted with a larger sample. In addition, we were not able to estimate the costs to the industry of the actions conducted to determine whether they represented significant charitable contributions or were merely activities that in some cases would have been conducted anyway (eg, staff training at breweries or actions which are already required by law). Although raters were all trained to an acceptable level of reliability, we cannot rule out differential bias in the raters recruited from different regions.
Conclusion
This analysis provides a window into the CSR activities considered by the alcohol industry to have relevance to their response to the WHO Global strategy. The magnitude and global scope of these initiatives speaks to the ability of the alcohol industry to mobilise its diverse commercial components in pursuit of a common cause, much like the tobacco industry did before them. Far from confirming industry claims that they can ‘do well’ by ‘doing good,’ the findings of the present study suggest that the public health benefits of their CSR activities are likely to be minimal, whereas the public relations benefits can be substantial.
Acknowledgments
We thank the following individuals for their assistance with this project: Jon Foster, Petrina MacNaughton, Neil Martin, Nils Garnes, Habib Kadiri, Melissa Fuelner, Diego Sendoya, Gustavo Sóñora Parodi, Aldana Lichtenberger, Karina Conde, Amy Ferguson, Michele Kosasih and Aveek Bhattacharya.
References
Footnotes
Contributors TFB contributed to the design of the study, recruitment of personnel, planning of statistical analyses and drafting of the manuscript. KR contributed to the design of the study, accessed the raw data, supervised the coding procedures, conducted the statistical analyses, trained coders and helped to draft the manuscript. KB supervised the coding of EU data and helped to draft the manuscript. JN contributed to the design of the study, conducted some of the statistical analyses and helped to draft the manuscript. MC and RIP recruited and supervised the Latin America and Caribbean (LAC) raters, conducted ratings, assisted with the statistical analyses and contributed to the drafting of the manuscript. DP supervised LAC raters, conducted ratings, assisted with the statistical analyses and contributed to the design of the study. IP contributed to the design of the study, obtained funding for the LAC data collection and analyses, conducted ratings and contributed to the drafting of the manuscript. All authors read, edited and approved the final manuscript.
Funding The research was supported by the Institute of Alcohol Studies and Dr. Babor’s Endowed Chair in Community Medicine and Public Health. The analysis of the Latin America and the Caribbean industry actions was funded by the International Development Research Centre (funding number 107203-001).
Competing interests None declared.
Patient consent Not required.
Provenance and peer review Not commissioned; externally peer reviewed.
Data sharing statement The industry action summaries are no longer available from the International Alliance for Responsible Drinking website. Copies can be requested from the authors or IARD. The data coded from these summaries, which were used in the current study, are available from the authors upon reasonable request.