Article Text

Abstract
Objectives The aim of this study is to categorise cancers into broad groups based on clusters of common treatment aims, experiences and outcomes to provide a numerical framework for understanding the services required to meet the needs of people with different cancers. This framework will enable a high-level overview of care and support requirements for the whole cancer population.
Setting and participants People in the UK with 1 of 20 common cancers; an estimated 309 000 diagnoses in 2014, 1 679 000 people diagnosed in a 20-year period and still living in 2010 and 135 000 cancer deaths in 2014.
Primary and secondary outcome measures Survival and stage at diagnosis data were reviewed alongside clinically led assumptions to identify commonalities and cluster cancer types into three groups. The three cancer groups were then described using incidence, prevalence and mortality data collected and reported by UK cancer registries. This was then reviewed, validated and refined following consultation.
Results Group 1 includes cancers with the highest survival; 5-year survival is over 80%. Group 3 cancers have shorter term survival. Five-year survival is not >20% for any cancer in this group and many do not survive over a year. Group 2 includes cancers where people typically live more than a year but are less likely to live >5 years. We estimate that the majority (64%) of people living with cancer (20 year prevalence) have a cancer type in group 1 ‘longer term survival’, but significant minorities of people have cancers in group 2 ‘intermediate survival’ (19%) and group 3 ‘shorter term survival’ (10%).
Conclusions Every person with cancer has unique needs shaped by a multitude of factors including comorbidities, treatment regimens, patient preferences, needs, attitudes and behaviours. However, to deliver personalised care, there needs to be a high-level view of potential care requirements to support service planning.
- cancer
- survivorship
- personalised-care
- quality Of life
- survival
- cancer services
This is an Open Access article distributed in accordance with the Creative Commons Attribution Non Commercial (CC BY-NC 4.0) license, which permits others to distribute, remix, adapt, build upon this work non-commercially, and license their derivative works on different terms, provided the original work is properly cited and the use is non-commercial. See: http://creativecommons.org/licenses/by-nc/4.0/
Statistics from Altmetric.com
Strengths and limitations of this study
The three cancer groups model provides a narrative that highlights the full spectrum of cancer journeys. This contributes towards planning for interventions as it ensures that sections of the cancer population are not forgotten. It also draws attention to the broad needs of each distinct section of the cancer population and their associated care requirements. The model has already influenced policy decisions as it is included in the English Cancer Strategy.
The study used routinely available, nationwide, population-based data to stratify cancers into groups. This makes it repeatable and open to further analysis by commissioners, policy-makers and researchers.
There are limited data on historical stage at diagnosis, cancer progression or serious treatment-related consequences for people living with cancer. This lack of data is a barrier to tailoring our categorisations more precisely or providing more accurate quantification. However the data available does give a strong impression of the variation in illness trajectories.
We are not able to include data on treatment regimens, patient preferences, needs, attitudes and behaviours in the description of the groups as this information is not routinely collected and linked to cancer registration data.
Due to the complexity and diversity of some cancer pathways and the small number of people diagnosed and living with some cancers not all cancers have been included in our stratification.
Introduction
Recent research highlighted that people were twice as likely to survive at least 10 years after a cancer diagnosis in 2011 than they were in the early 1970s.1 Given improved diagnoses and detection, a growing and ageing population, along with improvements in treatment and survival, it is estimated that 4 million people will have had and be living with a cancer diagnosis in the UK by 2030.2
Over the decades since 1970, the implications of what a cancer diagnosis means has also changed. In the 1970s, cancer was often a taboo subject and associated with end of life and terminal illness.3 Today, although many people still do die from their cancer, death rates have been declining since the 1990s and are predicted to continue this downward trend4 as survival improves. With this improved survival, the focus today is increasingly turning to how people survive after cancer, that is, their quality of life and their ability to live well. This changed focus is recognised in the recent cancer strategies and plans from the nations of the UK which include a foci on quality and experience. Recognising the importance of life after cancer diagnosis and treatment, ‘A strategy for England 2015–2020’ noted:
We need to support people with cancer to return to as good a quality of life as possible after active treatment has ended, or support them to achieve their personal goals if they will be living with either primary or secondary cancer for some time.5
The perception of cancer as a death sentence remains among many, particularly in the public mind, because some cancers have seen little improvement in survival rates since the 1970s. On the other hand, the idea that cancer can be eliminated with life going back to normal is also flawed. The experience of cancer is not binary: its outcome is not merely cure or death. The story of cancer now includes effects and consequences and in some cases the return of or a new cancer which makes for much more complex personal journeys and experiences. Therefore, we need a new simple way to describe this complexity.
What has not changed since the 1970s is the fact that cancer is not one disease but is made up of many different types of cancer and, along with the hundreds of thousands of people diagnosed with cancer each year, each cancer is different, behaves differently, warrants different treatment and has different outcomes. Cancer research, genetics and treatment have all developed and there is an increasing move towards personalised medicine. Here we aim to consider cancer in the context of care and support. It is impractical to plan at a population level the care and support requirements for every cancer type and journey individually. We must find ways of identifying people with similar needs and use this to guide our thinking about the interventions and conversations required to move towards more personalised care. For example, Deagle et al review the success of new roles piloted in Southampton to support people with active or advanced disease.6 Harley et al focused on the chronic cancer disease phase. They identified that care planning at the point of transition to chronic cancer should focus on evaluating symptoms and need for psychological, social and economic support, and regular re-evaluation.7
In the face of all this complexity, for most monitoring and planning we only have routine cancer incidence, mortality, survival and prevalence data at a whole-population level. This does not in its current form describe the complexity in quality of life and needs. Previous work has aimed to draw out some of the complexity using routine cancer data by dividing cancer survivors into needs-based segments with respect to their transitions into different phases of care.8 This identified patterns for different cancer types.
The aim of the current study is to identify a method to classify cancer types into groups that are associated with similar treatment aims, experiences and outcomes. The method needs to provide a numerical framework that allows researchers to estimate the size of each group in different populations. The aim is then to describe the size and characteristics of the three cancer groups. Finally, this will lead to an exploration of how care varies between the groups and the implications for personalised care.
We started by categorising cancer types into broad groups based on clusters of common experiences, needs, treatment aims and outcomes. We identified that these groups of cancer types link to the typical survival times for each cancer. This grouping of cancer types also had the advantage that information on cancer types and survival is routinely published. Once the cancer types were grouped we could use routine cancer data to describe each group in more detail. This framework will help service planners identify the types of conversations and interventions required to facilitate better planning of care and support services to meet peoples’ needs.
Materials and methods
Data on the survival, prevalence and stage at diagnosis for common cancers in the UK were reviewed alongside clinically led assumptions to identify commonalities between different cancer types. The commonalities included similar care pathways and the likely needs and outcomes of people with those cancers. Survival was used as an initial proxy for those factors as it often has an impact on the types of care and support needed. England-wide survival data were used where this was available. This was refined by clinicians reviewing the most prevalent cancers to identify the impact stage has on treatment pathways and survival. Where the differences by stage were agreed to be most significant, that cancer was considered separately by stage, for example, organ-confined prostate cancer and metastatic prostate cancer were considered separately. The analysis of commonalities and possible groupings lead us to a categorisation defined using cancer types, stage and survival rates.
After defining the three cancer groups, indicative estimates are made to quantify the size of each of the groups. We further use incidence, mortality and prevalence as well as stage at diagnosis to describe the estimated number of people in each group. Where official statistics are not available, we draw on the wider literature to provide estimates, in particular for 5-year survival by stage. We calculate weighted averages for survival where stage is grouped.
For the numbers of people diagnosed with cancer we sum incidence in each of the countries in the UK in 2014 to get 357 000 diagnoses.9–12 The incidence figures are then analysed by cancer type to calculate the total number of cancers diagnosed within each group. When cancers are separated by stage at diagnosis, the incidence numbers are divided using proportions derived from stage at diagnosis data. Staging data for people diagnosed in England13 was used apart from cervical cancer, which is not currently included in the England data, so was based on people diagnosed in Northern Ireland.12 The proportions by stage at diagnosis exclude people with an unknown stage from the denominator.
The prevalence estimates are based on work conducted by Public Health England’s National Cancer Registration and Analysis Service in partnership with Macmillan Cancer Support. It showed that there were 1.8 million people living up to 20 years after a cancer diagnosis in the UK in 2010.14 This work aimed to quantify and characterise the UK cancer population in detail. It used cancer registration data to identify people with a cancer diagnosis between 1991 and 2010 who were still alive on the 31 December 2010. The aims and methods are described in Macmillan/National Cancer Registration and Analysis Service.15 There is little historical data split by stage at diagnosis and only recent data on survival by stage. Prevalence by stage is therefore crudely estimated based on stage at diagnosis proportions, survival rates and a comparison of prevalence to cancer types with similar survival profiles. Our estimation of the total prevalence across the three cancer groups is based on the first diagnosis of each specific cancer. This means the sum will double count anybody who has more than one cancer at different sites within the 20-year follow-up. The level of double counting varies by cancer type, for example, almost 8% of first lung cancers were in people previously diagnosed with a cancer of a different site, within the 20-year period. By contrast, only 1% of first cervical cancers are in people who have had a previous cancer outside of the cervix.16 17 The estimated total prevalence of the shorter term survival group includes benign and uncertain behaviour brain and central nervous system tumours. The estimate of prevalence of cancers not included in the three cancer groups is the difference between the sum of prevalence of the cancers in the three cancer groups and the all cancer prevalence (1.8 million, ICD-10 C00-C97 excluding C44). The all cancer combined prevalence is a person count and does not double count people so the estimate of the prevalence of cancers not included in the three cancer groups may be an underestimate.
The numbers dying due to cancer is the sum of mortality counts in each of the countries in the UK in 2014, 164 000 deaths.10 18 19 The mortality figures are then analysed by the cancer type to calculate the sum of cancer deaths within each group. Mortality data are not published in the UK by stage at diagnosis. Therefore, we crudely estimate by dividing mortality by stage at diagnosis.12 13 This is likely to overestimate the number of deaths where the cancer was first diagnosed at an early stage as a larger proportion will ultimately die of non-cancer causes compared with those diagnosed with late stage disease.
Where necessary we assume stage at diagnosis and survival by stage are comparable across UK constituent countries and use England or localised data as a proxy to calculate data by stage for the UK. See table 1 for more details.
Key data sources by measure, year and coverage
The analysis included 20 common cancers (excluding non-melanoma skin cancer—ICD-10 C44) which account for the majority of people living with cancer in the UK.14 We exclude leukaemia (C91-95), head and neck (C00-14, C30-32), ill-defined, secondary and unspecified sites (C76-80) and some rarer cancers as the highly diverse cancer care pathways and limited survival and stage data make them difficult to stratify into the groups. These excluded cancers made up an estimated 13% of cancer incidence and 17% of mortality in 2014, and around 8% of 20-year prevalence as at the end of 2010.
Table 1 describes the measures and data sources used within the estimates to quantify our three cancer groups. We acknowledge variation in the quality of some of the data sources due to availability of data and we represent this in our results. In general, we have higher confidence when the survival rates are based on England-level data and lower confidence where the data are based on smaller populations or where we use a subset of a cancer as a proxy.
After defining and describing the size of each group we then presented the categorisation at one of Macmillan’s Clinical Advisory Board meetings. Macmillan’s Clinical Advisory Board membership comprises over 25 multidisciplinary professionals and senior Macmillan directors including surgeons, oncologists, palliative care consultants, allied health professionals and community nurses. At the Clinical Advisory Board, there was agreement that the cancers groupings were in general alignment to clinical practice, the sizes of the groups were realistic and the description of likely needs in each group reflected their clinical experiences of tailored care. The categorisation and description of the three cancer groups was then presented and discussed in six workshops at a Macmillan conference of medical professionals across primary and secondary care in 2015. This was attended by 167 healthcare professionals and around 45 additional colleagues working within cancer. Macmillan general practitioners and general practitioners advisors made up the majority of healthcare professionals (136), and the remainder consisted of consultants, practice nurses, primary care nurses and people affected by cancer. The three cancer groups model was presented in the workshops and discussion focused on how primary and secondary care providers can work better together to enhance the experience of people with cancer. Workshop groups were asked to identify ‘take-away ideas’ on how members of the medical community could better support people within each of the three cancer groups. Attendees at the workshops found the three cancer groups and their assumptions resonated well with clinical practice and was a useful model to help to disentangle the complexity of care.
The three cancer groups model was included in the English Cancer Strategy,5 and we discussed the model at recent cancer conferences, particularly with cancer registration and analysis colleagues (European Network of Cancer Registries 2014, National Cancer Research Initiative 2015, World Cancer Congress 2016, Cancer data and outcomes conferences 2015 and 2016). Subsequently, we validated and further refined the survival data used in the categorisation of cancers and incidence, mortality, prevalence and stage at diagnosis data used in quantifying and describing the three cancer groups as new data became available, in particular the stage data.
Assumptions
Every individual cancer journey is different because of a multitude of factors including comorbidities and treatment regimens, as well as psychosocial or holistic needs and preferences. This means treatment and care should be personalised to individual needs. However, we aim to identify broad clusters of commonalities and categorise cancers into three different groups to provide high-level overviews of care and support needed for the whole cancer population. The journey of someone living with cancer will be broadly influenced by outcomes (especially survival time) and cancer type and so can be used to establish the demand for different levels of ongoing support. Here we describe our assumptions based on clinical knowledge of treatment pathways and likely outcomes for each group.
Group 1: longer term survival
For this group peoples’ cancer is generally identified and treated successfully, typically after an acute episode of care involving surgery, radiotherapy and/or chemotherapy. The majority of this group include people who tend to live long term—often more than a decade. Most localised breast and prostate cancer, most colorectal cancer at stages 1 and 2, and most stage 1 cervix and uterine cancers are included in this group. However, many of this group will live with physical, practical, financial or emotional consequences of cancer or its treatment.20 21 Some people with cancers in this group could have long-term consequences of cancer or its treatment that appear many years after treatment, for example, an increased risk of cardiac problems in breast cancer survivors.
Group 2: cancer as a complex ongoing disease: intermediate survival
Cancers in this group are often treatable but not curable from diagnosis, and they may respond well to treatment initially but then relapse, recur or spread. There are two subsets in this group, first, those cancers where a majority of people have a treatable but not curable illness from diagnosis. Second, there are those who are initially diagnosed with cancers from group 1 where people have an apparently successful initial treatment, a gap of months or years and then metastatic disease develops, for example, some cases of hormone-sensitive breast or prostate cancer. People with cancers in this group are likely to live more than a year but are less likely to live >5 years and typically have multiple lines of treatment. Ongoing treatment or care is often required, survival is generally moderate and the acute effects and consequences of cancer and its treatment are likely to be prevalent in this group. This means that cancers in this group could be seen to be similar in behaviour and treatment requirements to a long-term condition. Myeloma, stages 2–4 uterus, cervix and kidney cancers, and metastatic breast and prostate cancer are in this group. Those who had a group 1 cancer that developed into a group 2 cancer cannot be easily identified in the current routine datasets.
Group 3: shorter term survival
For cancers in this group, prognosis is typically poor with over half of people dying within a year of diagnosis. Acute cancer episodes, treatment and palliative care dominate in this group. Survival rates for these cancers are the lowest and some have seen little or no movement in recent decades. Lung, pancreas, metastatic colorectal cancer, brain and stomach cancer are in this group.
Results
We review survival by cancer type using available data and allocate cancers into three cancer groups based on our assumptions of treatment pathways and according to survival outcomes. Figure 1 shows the 1-year and 5-year survival rates for cancers included in the study and by stage for those cancers identified by clinicians as having a greater influence on treatment pathways. Where possible we report unstandardised net survival from the most reliable source as noted in table 1. Figure 1 in its legend presents an assessment of the quality of the data used for each cancer and time period, for example, where data are not sourced from England or are estimated by proxy, such as from a subset of the cancer type for which we have less confidence in the data. It should be noted that survival rates by stage reported in figure 1 come from multiple sources (see table 1 for details) and so caution should be taken when making comparisons.
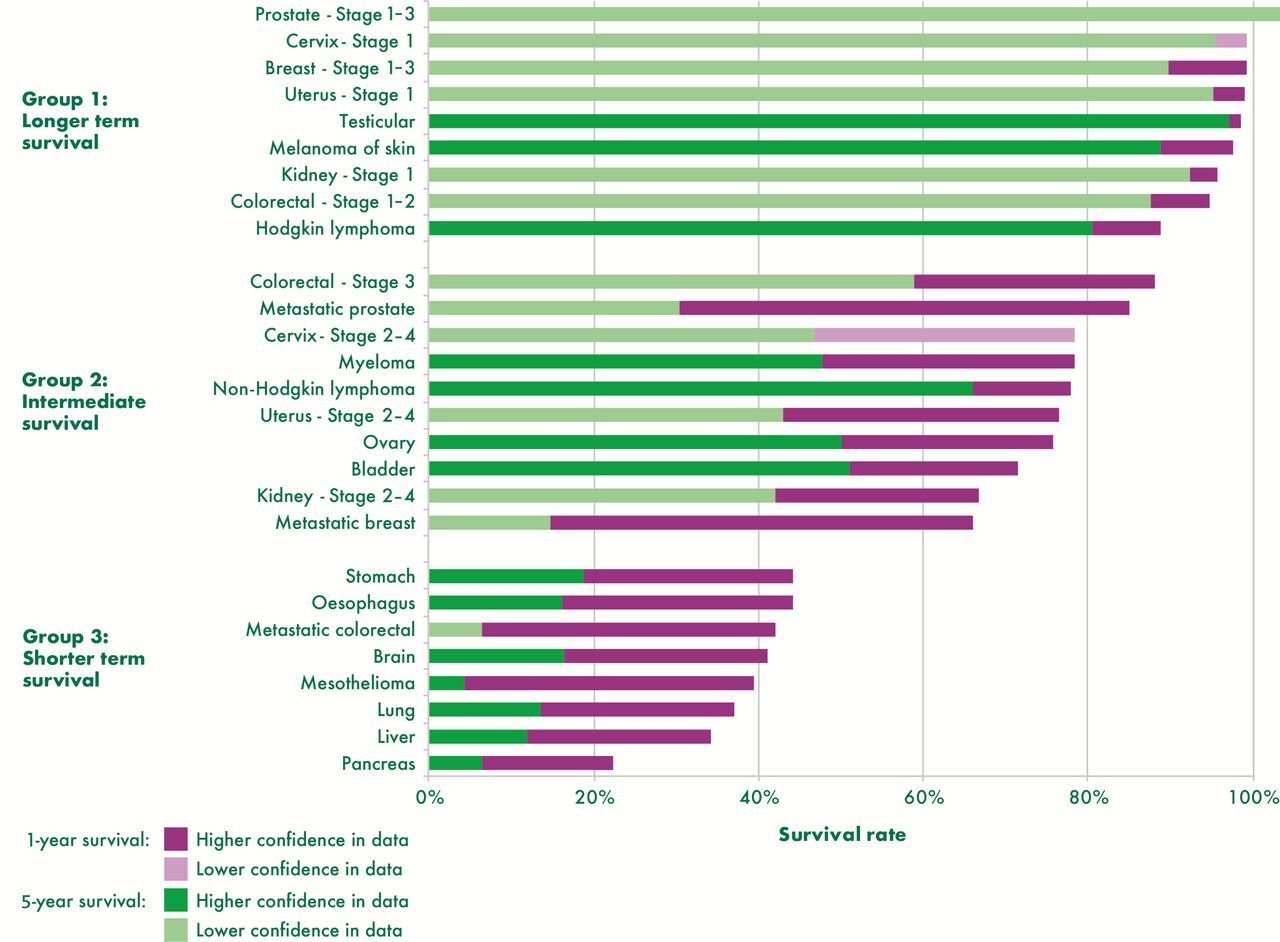
1-year and 5-year survival rates by cancer type, stage and group, England, up to 2011–2015. Data are for England except cervix cancer by stage which is Northern Ireland data and 5 year survival by stage which is regional data from the former Anglia Cancer Network or Northern Ireland data. The year of data varies with the earliest time period people were diagnosed as 2002–2006 followed up to 2011 for the 5 year survival by stage data and the latest as predicted survival for people diagnosed in 2015 for cancers with no stage split. See sources in table 1 for more details.
One-year survival is highest for group 1 and ranges from 89% for Hodgkin’s lymphoma to over 100% for early stage prostate cancer. Five-year survival is similarly high from 80% for Hodgkin’s lymphoma to over 100% for early stage prostate cancer. In general, the difference between 1-year and 5-year survival is smallest within group 1 compared with other groups in line with our assumption that people with cancers in this group are most likely to survive in the long term.
For cancers in group 2, 1-year survival rates are over 50% and range from around 66% for metastatic breast cancer to 88% for colorectal stage 3. Five-year survival is moderate for cancers in group 2 ranging from 15% for metastatic breast cancer to 66% for non-Hodgkin’s lymphoma. The difference between 1-year and 5-year survival is much greater than that of group 1 perhaps reflecting the increased complexity of cancer as an illness for people in this group. For metastatic breast and prostate cancer, the difference between 1-year and 5-year survival appears to be particularly stark (over 50 percentage points). However, it should be noted that there are limited data for 5-year survival by stage available.22
Group 3 cancers have poor survival with 1-year survival ranging between 22% for pancreatic cancer and 44% for stomach cancer. Five-year survival is not >20% for any cancer in this group with mesothelioma lowest at just 4%, closely followed by pancreatic cancer and metastatic colorectal cancer both 6% (although not all sources are directly comparable).
The three cancer groups categorised by survival rates (figure 1) give a good indication of the distinguishing features of the groups, but key to assessing the need for population level care and support services is understanding the numbers of people stratified into each group. Figure 2 provides estimates of the number of people in each group using incidence, prevalence and mortality data.
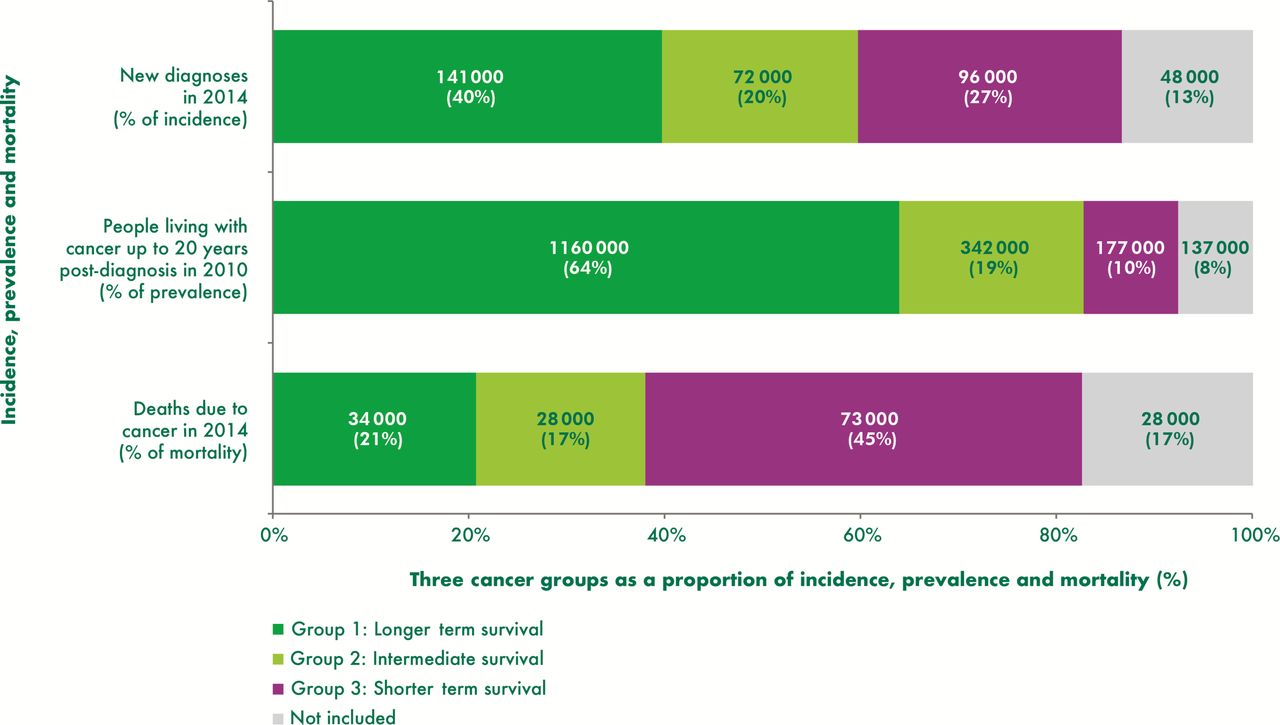
Proportion of people in each of the three cancer groups, estimates for the UK.
We estimate that the majority of people living with cancer (20 year prevalence), nearly 1.2 million (64%), have a cancer type in group 1 ‘longer term survival’, but significant minorities of people have cancers in group 2 ‘intermediate survival’ (19%) and group 3 ‘shorter term survival’ (10%) (figure 2). Group 1 is the largest group with incidence as well as prevalence accounting for the largest proportions, as might be anticipated with most people with cancers in this group expected to survive in the longer term. Cancer deaths in group 1 are proportionally much lower than incidence and prevalence. In contrast group 3, whose cancers have the poorest prognosis, had the highest proportion and number of cancer deaths and the lowest prevalence. Cancers in group 2, although proportionally the smallest group in terms of incidence and mortality, have nearly twice the prevalence of group 3 cancers and a significant number of people living with cancer—an estimated 342 000—at the end of 2010.
See table 1 for data sources. For prevalence and mortality, no direct data for cancers by stage are available, so some estimates rely on assumptions and simplifications.
Discussion
Cancer is made up of many different types and even between the most common cancers, variation in survival outcomes is large. We believe that variation in need is likely to have a similar spread. In order to demonstrate the need for support and service configuration, establishing the demand for different levels of ongoing support in stratified groups is essential. Table 2 summarises the three cancer groups in our model and notes the possible key concerns and interventions appropriate to support each group as informed by clinical input and the health professional’s workshops.
Summarising the features, needs and care requirements of the three cancer groups
The majority of people living with cancer in this model have a group 1 cancer, where most people will have one episode of treatment and a focus on managing the impact of treatment on recovery is key. The recovery package is an essential part of their care and support5 23 including practical, financial and emotional support, for example, to get back to work or an exercise programme. Some people with a group 1 cancer with longer term survival may have consequences of cancer or their treatment. For example, a study of women in America diagnosed with early-stage breast carcinoma who had not had a recurrence found that at 5–10 years postdiagnosis 34% experienced significant fatigue.24 There are limited data to quantify how many people consequences may affect overall but it is estimated around a quarter of all people living with cancer could have consequences.20 Bower recommends adult cancer survivors should be evaluated for the presence of fatigue and then offered specific information and strategies for fatigue management.25 The treatment strategies include physical activity interventions, psychosocial interventions and mind–body interventions. Patient-reported outcome measures also highlight that people report consequences and issues which affect quality of life for years after initial diagnosis.26 These people with later consequences may benefit from elements of care taken from the management of long-term conditions along with people with cancers in group 2. Additionally there is a subset of people we are currently unable to quantify with a group 1 cancer which develops and metastases months or years after initial diagnosis and so move to a group 2 cancer.
Our model and provisional estimates suggest that around one in five people living with a cancer diagnosis have a group 2 cancer, the intermediate survival group. These people usually have ongoing disease and will usually have more than one treatment episode with potentially complex care requirements. The large difference between 1-year and 5-year survival for group 2 could be interpreted as a particular concern in terms of managing care while maintaining quality of life at such an unpredictable phase of disease. Group 2 can be seen as having similar needs to those with a long-term condition as they typically experience multiple episodes of care and monitoring of disease is required. Reed and Corner use the example of metastatic breast cancer to predict that a model of care used to manage chronic illness could lead to more appropriate use of analgesics, anticancer treatments and hospital visits.27 The management of long-term conditions can include personalised treatment, care planning and supported self-management. There is an increased recognition by specialist charities of the particular needs of people with cancers in group 2 such Breast Cancer Care28 and the Lymphoma Association.29
For group 3, many people die quickly. While there must be a focus on improving diagnoses for late stage disease, it is also essential to have the right balance between anticancer treatment and palliative care. In the future as immunotherapy and targeted treatments emerge, some group 3 cancers have the potential to transform into group 2 cancers.
The three cancer groups model and the focus of care required for people in each group (table 2) can be used to guide thinking for the development of more personalised care. The three cancer groups are not designed to be directly discussed with people living with cancer or dictate the care each person must receive. Instead it provides a numerical framework to support service planning. In addition, healthcare professionals can use the characteristics of individuals and their tumours alongside the focus of care for each group of cancers to anticipate the needs of their patients. This alongside other techniques could guide supportive conversations with people living with cancer. Consideration of characteristics other than the three cancer groups are critical, for example, it is evident that cancer often coexists with a wide range of other conditions or comorbidities.30 31 This is particularly important to take into account in the understanding of care and support required to recover after treatment, especially for people with a group 1 cancer as well as when treatment decisions are made for all groups.
Limitations
As noted the quality of data available to report on cancers by stage is limited, although great gains have been made in recent years allowing us the confidence to report on our model here. Further data and research are needed to understand mortality, prevalence and longer term survival by stage and to understand tumour progression32 in order to specify the cancers and people in each group more precisely. The data are also limited in that reported statistics do not identify if people have had a previous cancer diagnosis.
At this initial stage of introducing our model we have not attempted to further sub-divide for simplicity’s sake. Current data and the small size of some tumour groups do not allow us to disaggregate within all tumours. As with any model not all individuals will fit perfectly into one of the groups and in reality people could move between groups. The model has also not been able to take into account serious treatment-related consequences or the implications of multiple morbidities on treatment and care. This is due to limited data and evidence to show how this could impact people in all groups. The three cancer groups are also not able to consider all aspects of a patient profile. Alternative questionnaire-derived segmentations of people living with cancer around psychosocial factors, patient preferences, attitudes and behaviours are likely to find people clustered around attributes such self-efficacy rather than treatment or disease characteristics (such as Foster et al 33). These alternative segmentations cannot easily be done systematically on the scale of all the UK and tend to highlight different aspects of diversity in people living with cancer.
The construct of our three cancer groups model is new and so there are limited further data and research to explore in more depth the commonalities and distinctions between the groups of cancers and the people within these groups. In order to ensure that care and support meets the needs of people living with cancer, further research into the links between clinical care, treatment and quality of life as well as patient-reported needs and outcomes in each of the groups would be beneficial. This along with further testing of the concepts with people living with cancer, commissioners, policy-makers and clinicians in a wide range of settings will help to further validate the three cancer groups.
Once the three cancer groups have been further developed and validated, further work to identify and test appropriate interventions for each of the three cancer groups should be carried out with a focus on measuring which elements of care have an impact on quality of life. A recent study piloting new roles to deliver supportive care for people with active and advanced cancer in Southampton shows promising results and found that >50% of people were supported to be able to return to independence through self-management.30 Work in England, thanks to the recent Cancer Strategy,5 is underway to develop a quality of life metric with the intention to monitor continuous improvement in long-term quality of life for people living with cancer. We hope to use the outcomes of this work to understand the groups in more detail in the future.
Conclusion
Every person with cancer is different, and treatment and support should be personalised to individual needs. We believe personalised care is key to improving survival and quality of life and that a shared understanding of the aim of treatment is required between people living with cancer and health professionals in order to tailor care appropriately. We believe the three cancer groups model provides a starting point for a broad framework and narrative that contributes towards personalising care through better decision making and application of interventions to ensure people do not miss out on the care appropriate for them and their cancer.
Stratifying cancers as we have done provides a new high-level quantitative view of potential care requirements and can help guide the thinking of planners and health professionals in order to personalise care. We aim to stimulate debate on this service challenge and shift perception from cancer as a binary life or death disease to that of the new reality, the new cancer story of three parts. Some cancers cannot be cured, some cancers keep coming back and most leave a lasting impact.
Acknowledgments
The authors thank Macmillan Cancer Support and the healthcare professionals who took part in discussion and workshops on the three cancer groups model. They also acknowledge cancer registration and mortality data owners across the UK who collected and made much of these data available. Data are collated and presented from publicly available sources published by Office for National Statistics, Public Health England’s National Cancer registration and analysis service, the Welsh Cancer Intelligence and Surveillance Unit (Health Intelligence and Knowledge Management Division, Public Health Wales), the Scottish Cancer Registry (Information Services Division), the Northern Ireland Cancer Registry (Public Health Agency for NI) and Cancer Research UK.
References
Footnotes
Contributors JM: responsible for the development of the concept of the three cancer groups and led on clinical engagement. HMC and RW: responsible for collating and analysing the data from across the UK and placing the topic within the wider cancer population narrative. All authors: contributed to the first draft of the manuscript and have reviewed the final version before submission. Colleagues within Macmillan Cancer Support provided review of draft papers. Further contributors provided data and clinical review are noted in the methods and acknowledgements.
Competing interests None declared.
Provenance and peer review Not commissioned; externally peer reviewed.
Data sharing statement No additional data are available.