Article Text

Abstract
Objectives The aim of this systematic review was to describe and analyse the performance statistics of validated risk scores identifying elderly inpatients at risk of early unplanned readmission.
Data sources We identified potentially eligible studies by searching MEDLINE, EMBASE, COCHRANE and Web of Science. Our search was restricted to original studies, between 1966 and 2018.
Eligibility criteria Original studies, which internally or externally validated the clinical scores of hospital readmissions in elderly inpatients.
Data extraction and synthesis A data extraction grid based on Strengthening the Reporting of Observational Studies in Epidemiology and Transparent reporting of a multivariable prediction model for individual prognosis or diagnosis statements was developed and completed by two reviewers to collect general data. The same process was used to extract metrological data of the selected scores.
Quality assessment of the included studies Assessment of the quality and risk of bias in individual studies was performed by two reviewers, using the validated Effective Public Health Practice Project quality assessment tool.
Participants Elderly inpatients discharged to home from hospital or returning home after an accident and emergency department visit.
Results A total of 12 studies and five different scores were included in the review. The five scores present area under the receiving operating characteristic curve between 0.445 and 0.69. Identification of Senior At Risk (ISAR) and Triage Risk Screening Tool (TRST) scores were the more frequently validated scores with ISAR being more sensitive and TRST more specific.
Conclusions The TRST and ISAR scores have been extensively studied and validated. The choice of the most suitable score relies on available patient data, patient characteristics and the foreseen clinical care intervention. In order to pair the intervention with the appropriate clinical score, further studies of external validation of clinical scores, identifying elderly patients at risk of early unplanned readmission, are needed.
PROSPERO registration number CRD42017054516.
- public health
- elderly
- readmission
- clinical risk scores
This is an open access article distributed in accordance with the Creative Commons Attribution Non Commercial (CC BY-NC 4.0) license, which permits others to distribute, remix, adapt, build upon this work non-commercially, and license their derivative works on different terms, provided the original work is properly cited, appropriate credit is given, any changes made indicated, and the use is non-commercial. See: http://creativecommons.org/licenses/by-nc/4.0/.
Statistics from Altmetric.com
Strengths and limitations of this study
Our systematic review includes clinical risk scores predicting elderly early unplanned readmission.
Clinical risk scores give a numerical result and a cut-off, which might be more convenient for the current use.
We identified potentially eligible studies by searching MEDLINE, EMBASE, COCHRANE and Web of Science.
The data extraction grid is based on the Strengthening the Reporting of Observational Studies in Epidemiology and the Transparent reporting of a multivariable prediction model for individual prognosis or diagnosis statements.
Introduction
Hospital readmissions in the elderly are particularly deleterious, as they increase their risk of dependence and decompensation of comorbidities.1 Moreover, these readmissions are a burden for the health system organisations. Therefore, it has become a priority to decrease hospital readmission rates and for this purpose, unplanned hospital readmission, within 30 days after discharge, is now recognised as a valid quality indicator for hospital performance as these readmissions are likely to be connected to the index admission.2 Among all inpatients, the elderly are reportedly at higher risk of unplanned readmission: 17.3% of readmission for patients aged 85 years and older, versus 16.6% for patients under 64 years old.3 Thus, it is important to implement evidence-based clinical care interventions focused on reducing unplanned readmission of elderly patients.4 A time scale needs to be defined in order to measure potential benefits of such clinical care interventions. Moreover, this time limit has been introduced in guidelines or programmes dealing with elderly hospital readmissions in the USA and France.1 5
In order to better rationalise resources, healthcare authorities have stated that it is neither ‘necessary nor efficient to intervene for every patient’. Moreover, as mono-faceted interventions only have a limited effect,6 care bundle interventions should be implemented. However, these interventions are costly in terms of time, money and caregiving and there is a need to determine who will benefit from those interventions in priority.1
In this vein, clinical risk scores, which are prognosis tools estimating the probability or risk of future conditions,7 can help physicians and pharmacists to identify elderly patients at high risk of unplanned readmission within 30 days after discharge. Building a clinical risk score requires three successive steps8 : (1) the development; corresponding to the construction of the score on a derivation cohort, (2) an internal validation, that is, testing the score on the same population (validation cohort) and (3) an external validation, that is, adjusting or updating the score in other patients. Internal and external validation studies evaluate the discrimination of the scores, using the c-statistic,9 and several metrological characteristics such as specificity or sensitivity. In our study, the c-statistic of risk scores that identify elderly inpatients at risk of 30-day unplanned readmission, will give the probability a randomly selected readmitted patient had a higher score than a non-readmitted patient. The specificity will give the ability to reject patients at low to moderate risk and sensitivity the ability to correctly include patients at high risk of readmission. In 2011, Kansagara et al 10 conducted a systematic review to identify risk prediction models for hospital readmission. This systematic review included thirty studies. Among the thirty studies, fourteen chose unplanned readmission between 31 days and 4 years after discharge as outcome, six studies focused on specific conditions and seven focused on adult inpatients. We chose to exclude this kind of studies and to focus on elderly patients and all-cause unplanned readmissions within thirty days after discharge. The three remaining studies presented prediction models with no calculation of discrimination. We chose to include only studies for which the expression of discrimination was made by calculating the c-statistic or the area under the ROC curves. In 2016, while updating the review from Kansagara, Zhou et al 11 included a total of 60 studies in their systematic review. Among the 60 included studies, only four focused on elderly patients and all-cause unplanned readmissions within thirty days after discharge, two were prediction models and one was a clinical risk score without calculation of the discrimination ability.
Therefore, these studies have not enabled us to select a clinical score suitable for elderly inpatients at risk of unplanned readmission within 30 days after discharge.
The aim of this systematic review was to describe and analyse the statistical performances of validated risk scores identifying elderly inpatients at risk of 30 day unplanned readmission.
Methods
This systematic review was registered in the PROSPERO database and is presented according to the Preferred Reporting Items for Systematic Reviews and Meta-Analyses guidelines (online supplementary file 1).12
Supplementary file 1
Eligibility criteria
We have systematically identified peer-reviewed original studies, with internally or externally validated clinical scores of unplanned hospital readmissions in elderly inpatients. We excluded reviews and studies identifying readmission risk factors, developing a statistical prediction model for readmission and clinical score not having been, previously, internally validated. Indeed, statistical prediction models give a probability of a patient being readmitted, whereas clinical risk scores give a number which can be compared with a threshold from which the patient is at high risk of readmission. Clinical scores are, thus, easier to use routinely.
We included studies:
In which participants were elderly inpatients (65 years old and over) discharged to home after a hospitalisation or returning home after an accident and emergency department (AED) visit.
In which the main outcome measured was unplanned readmission or return to the AED within a month (28, 30 or 31 days) after discharge. We excluded studies that focused on specific conditions.
Where the score discrimination was evaluated using the c-statistic. The graphic representation of the c-statistic is the receiving operating characteristic (ROC) curve. We excluded studies which had used neither the c-statistic, nor the area under the curve (AUC) of the ROC curves for the validation.
Information sources and search strategy
We identified potentially eligible studies by searching in four databases MEDLINE EMBASE, COCHRANE and Web of Science. Our search was restricted to original human studies, published in French or English, between 1966 and 2017. The search strategies of the four databases were approved by a university librarian (online supplementary file 2). The electronic search was conducted on 13 January 2017 and updated on 19 January 2018. In addition to searching databases, we checked reference lists of selected studies and researched also the studies citing the selected studies, on Web of Science.
Study selection
After identification, studies were screened independently by two reviewers (CS and VK-S) on the basis of title and abstract. Then, the full text was read for potential inclusion in the systematic review and agreement between the two reviewing authors (CS and VK-S) was assessed using Cohen’s κ statistic.13 A Cohen’s κ coefficient comprised between 0.60 and 0.74 was considered as good, and very good if superior to 0.75. In the case of disagreement, a third reviewer (PH) was a priori designed to be consulted.
Data collection process
We developed a data extraction grid based on The Strengthening the Reporting of Observational Studies in Epidemiology statement: guidelines for reporting observational studies14 and the Transparent reporting of a multivariable prediction model for individual prognosis or diagnosis (TRIPOD): the TRIPOD statement.15 General data extracted from full-text included: authors, year of publication, design, setting, participants, data sources, study size, quantitative variables and statistical analysis methods. For each selected study, CS extracted the general data and completed the grid. Independently, VKS checked all the data collected in the grid. Disagreements were resolved by discussion and consensus.
Using the same process, we extracted metrological data (AUC of the ROC curves, sensitivity, specificity, positive predictive value, negative predictive value, negative and positive likelihood ratio and accuracy) of the selected scores. Discrimination was considered fair for a c-statistic comprised between 0.5 and 0.69, and good when the c-statistic was superior to 0.7.
Quality assessment
Assessment of quality in individual studies was performed independently by two reviewers (CS and VK-S), using the validated Effective Public Health Practice Project (EPHPP) quality assessment tool.16 This instrument, usable for any quantitative study design, was adapted to our study design in order to evaluate the quality through five sections: selection bias, study design, data collection method, statistical analysis and withdrawals and dropouts. The quality was individually rated for each component (strong, moderate or weak) and added to assign a global rating to each study. The global rating followed the EPHPP guidelines: a strong global rating means there is no weak rating, a moderate global rating means there is one weak rating and a weak global rating means there are two or more weak ratings.
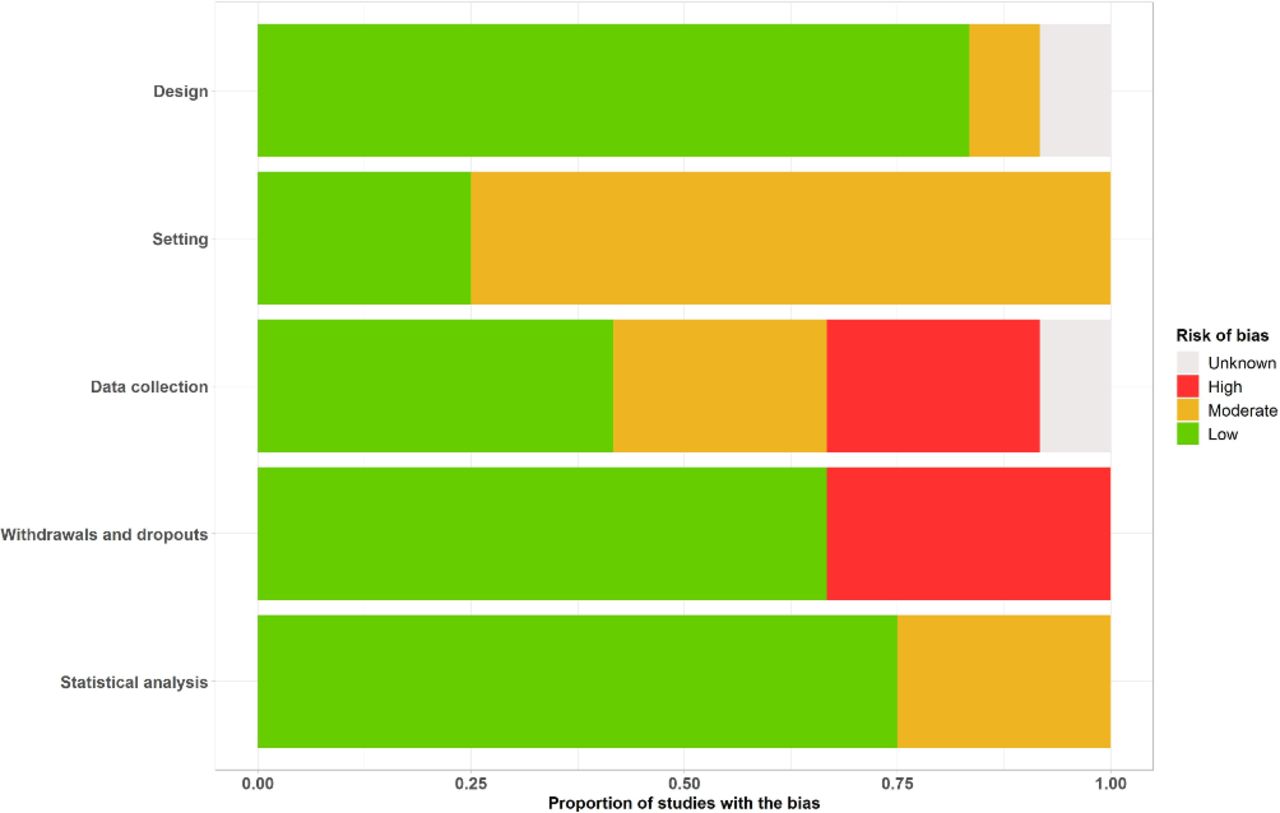
The quality across studies was assessed using a graphic representation of the percentage of studies with a strong, moderate or weak rating for each sections considered in the evaluation of the quality in individual studies.
Patient and public involvement statement
No patient was involved in this systematic review.
Results
Result of search strategy
From the four databases, we extracted 2484 references (online supplementary file 3). After removal of 320 duplicates, we screened 2164 studies on the basis of titles and abstracts leading to the exclusion of 2075 irrelevant publications. A total of 93 publications were reviewed for eligibility. Nine studies finally met the inclusion criteria. We found three additional records by manual search (by checking the reference lists). Thus, a total of 12 studies17–28 and five different scores were included in the present analysis. The degree of agreement between the two reviewers was good, with a κ coefficient of 0.72 (95% CI 0.50 to 0.93).
Study characteristics
Study characteristics are presented in table 1. The 12 included studies were published between 2000 and 2017. Six were conducted in Europe,17–20 26 27 four in North America (the USA and Canada),21–23 28 one in Asia (Singapore)24 and one in Australia.25 Design, population, interventions and outcome will be detailed below.
Study characteristics
Study design
All the studies were prospective observational cohort studies, except one which was a retrospective observational cohort study24 and one in which the design was not specified.27 Eight studies were monocentric17–20 24–27 and four were multicentric.21–23 28
Study population
Participants were inpatients, 65 years old and over in 10 studies17–25 28 or 75 years old and over in one study.26 For one study, the age for inclusion was not mentioned, but patients were admitted to a geriatric ward.27 The mean age varies from 74 to 84.8 years old. Participants were discharged to home after either an AED visit,17 19–23 25 26 28 a hospitalisation24 27 or after an AED visit followed by a hospital admission.18 The readmission rate varies from 12.1% to 28.4%
Intervention
Among the 12 studies, three internally validated a clinical score predicting hospital readmissions,22 23 25 meaning that included patients constituted validation cohorts. The other nine studies consisted of an external score validation, meaning that the scores were tested in a new cohort, different from the one used for validation. The validation cohort studies of these scores included adult inpatients and thus, they were not included in the present review.
Outcomes
The definition of readmission differs between studies: it was either an AED visit,17 19 22 25 an unplanned readmission18 24 27 or both (composite outcome)20 21 23 26 28 within 1 month (from 28 to 30 days). For the Identification of Senior At Risk (ISAR) and Triage Risk Screening Tool (TRST) scores, the outcomes were an AED visit or a composite outcome, except for the Braes et al study18 where the outcome was an unplanned readmission. In this study, the c-statistic was lower than in the other studies (0.445 for the ISAR score and 0.478 for the TRST). Regarding the lengths of stay, admission, Charlson, emergency (LACE) index, the outcome was only an unplanned readmission.24 27
Because of the large heterogeneity of the studies (data sources and definition of readmission, table 1), a meta-analysis was not possible.
Scores characteristics
The scores characteristics will be detailed bellow, by presenting predictors and measure of predictive performance (online supplementary files 4, 5 and 6).
Predictors
The median number of items included in the scores was 5 (range 3–8). As depicted in figure 1, the predictors composing the five scores can be divided into five categories: demographics, functional impairment, hospitalisation, polymedication and comorbidity. Functional impairment and comorbidity are the most used predictors, whereas demographics are used in one score (nomogram). The assessment of each category differs between scores, eg, the functional impairment can be measured with the capacity to walk (TRST), the ability to use a phone (variable indicative of placement (VIP)) or the presence of a home carer (nomogram). Likewise, polymedication varies from more than three drugs to more than 6. All the categories are not use in every score, eg, the LACE index assesses readmission risk with hospitalisation characteristics (length of stay, admission type and history of AED visit) and comorbidity.

Categories of predictors included in risk scores.
Each predictor can be obtained at admission, except for the length of stay (LACE index) which will be obtained at discharge.
Measure of predictive performance: As depicted in figure 2, the c-statistics for the ISAR score were close and comprised between 0.608 and 0.690, except for Braes et al study,18 whereas the c-statistics of the TRST score were scattered and comprised between 0.48 and 0.65. The TRST score had a better discrimination (AUC of the ROC curve of 0.647) in the internal validation study than in the external validation studies. The three other scores (VIP, nomogram and LACE) have fair discriminations: the c-statistics were comprised between 0.5 and 0.65, the nomogram having the best c-statistics (0.65). Moreover, the AUC of the ROC curves of the ISAR score were quite similar: 0.55 (95% CI 0.49 to 0.61) and 0.595 (95% CI 0.581 to 0.608), respectively.

c-Statistics and sample sizes of included studies.
As depicted in figure 3, TRST had a higher specificity and a lower sensitivity—the sensitivities varied from 0.62 to 0.871 and the specificities from 0.215 to 0.63—whereas ISAR has a higher sensitivity and a lower specificity—the sensitivities varied from 0.79 to 0.918 and the specificities from 0.19 to 0.40—and they showed good reproducibility. The two other scores, LACE and VIP, with only one study for each, showed better sensitivity and specificity than ISAR and TRST but had been externally validated only once. Finally, the specificity and sensitivity of the nomogram were not available.

Sensitivity, specificity and c-statistics of the scores Identification of Senior At Risk (ISAR), lengths of stay, admission, Charlson, emergency (LACE), Triage Risk Screening Tool (TRST) and variable indicative of placement (VIP).
In the external validation study by Braes et al,18 the VIP score showed an AUC of the ROC curve of 0.516, a sensitivity of 0.22 and a specificity of 0.81 (online supplementary file 6). The others metrological qualities are presented in the supplementary files, but they were not calculated for each score (online supplementary files 4–6).
The sensitivities and specificities were evaluated based on thresholds defined in the studies. Different thresholds could be defined to achieve different results for these two statistics.
Quality assessment within studies
All included studies were observational studies. Thus, we evaluated whether the study was prospective (low risk of bias) or retrospective (moderate risk of bias).
All the studies were at low risk of bias (prospective studies), except Low et al 24 which was a retrospective cohort study, and Cotter et al,27 where the design was not specified.
As we assume that multicentric studies have a more representative population than monocentric studies, we identified four studies with a low risk of bias (multicentric studies)21–23 28 and eight studies with a moderate risk of bias (monocentric studies).17–20 24–27
To determine if patients had an unplanned readmission, the data collection for these observational studies was made from the medical records (high risk of bias), with the patient (moderate risk of bias) or both or with a national clinical data base (low risk of bias). The medical records rarely indicated if an unplanned readmission occurred in a different hospital, because about 20% of readmissions can be to a different hospital to the index admission.29 But the telephone interview and the national clinical data bases, they make it possible to overcome this classification bias.
We then evaluated whether the withdrawals and drop-outs were reported in terms of number and/or reasons per group (low risk of bias) or not (high risk of bias). Four studies had not reported the withdrawals and drop-outs.20 24 25 28
We evaluated the quality of the statistical analysis as to whether the discrimination and the metrological data (low risk of bias), or only the discrimination (moderate risk of bias) were calculated.
Finally, we rated the global quality: three studies17 18 23 had a global low risk of bias, seven19–22 24 26 27 had a moderate risk of bias and two24 25 had a global high risk of bias (table 2).
Risk of bias within studies
Quality assessment across studies
The global quality assessment, as presented in figure 4, was assessed through a graphical representation of risk percentages for each source of bias. It shows a low risk of bias for the design, the withdrawals and dropouts and the statistical analysis. The risk was moderate for the setting and high for the data collection.
Risk of bias across studies.
Discussion
Summary of evidence
In this systematic review of the literature, we identified five validated risk clinical scores (ISAR, TRST, nomogram, LACE and VIP) identifying elderly patients at risk of unplanned readmission within 1 month after discharge. These five scores showed only fair discrimination (c-statistic less than 0.7). Among these five scores, the ISAR and the TRST are the most common scores, having undergone several external validations. Those two scores have used electronic medical records, and have predicted unplanned readmissions and AED visits. In the included studies, presenting similar design, the predictive validities of the ISAR and TRST scores were constant, showing that these scores are reproducible.
We have considered scores identifying elderly patients at risk of early unplanned readmission. Some other clinical scores identify adult inpatients at risk of unplanned readmission. For example, the HOSPITAL score, a clinical score developed in the USA in 2013, was internationally externally validated in an adult population, including elderly30 and has shown good performance with a c-statistic of 0.71. Unfortunately, it has not been specifically validated in an elderly population. Similarly, the LACE score was initially developed for adult inpatients.31 However, the LACE score showed, in the two external validation studies on an elderly population included in this systematic review,24 27 a lower discrimination (c-statistics of 0.55 and 0.595) than in the initial study (c-statistic=0.7).31 Thus, some clinical scores identifying patients at risk of unplanned readmission might be more effective on an adult population, rather than on an elderly population. In a recent study, Cooksley et al 32 externally validated the LACE score in an adult inpatient population from two hospitals in Denmark. In this study, the authors evaluated the modification in discrimination of LACE score by age group and found that the discriminatory power of the LACE score decreased with increasing age. The authors also evaluated the change in discrimination of the HOSPITAL score, and came to the same conclusion: the discriminatory power of the HOSPITAL score decreases with increasing age.
We only included studies dealing with general elderly population. On the contrary, some clinical risk scores focus on specific condition. For example, Pack et al 33 developed and validated a score predicting readmission after heart valve surgery and Echevarria et al 34 described a score predicting readmission after hospitalisation for acute exacerbation of chronic-obstructive pulmonary disease. These two scores predicted readmission with fair discrimination: c-statistic=0.67 and 0.70, respectively. Echevarria et al 34 also externally validated the LACE score for the prediction of readmission after hospitalisation for acute exacerbation of chronic-obstructive pulmonary disease and found a c-statistic of 0.65. The LACE score was also externally validated to predict readmission in patients hospitalised with heart failure, and showed a fair discrimination, with a c-statistic of 0.59.35 Hence, clinical scores focusing on specific patient populations or general risk scores used on specific patient population have not shown a better discrimination than general scores used on general populations.
For the ISAR and TRST scores, the c-statistics seem to be related to the outcome: the c-statistics appeared, indeed, lower for a prediction of an unplanned readmission, compared with an AED visit or a composite outcome.
Limitations
Our systematic review has some limitations. Unlike the review by Kansagara et al,10 we excluded risk prediction models, in order to include only clinical risk scores which might be more convenient for the current use. Clinical risk scores indeed give a numerical result and a cut-off, which could be automatically calculated by the medical software.
Moreover, we excluded validation studies on adult inpatients, which implies that studies with subanalyses that examine a score among the elderly population while the primary analyses were performed for a broad population were excluded. This is the case, for example, of the study of Cooksley et al,32 which have shown that the discriminatory power of the LACE index and the HOSPITAL score30 decreased with increasing age.
Similarly, we excluded validation studies that focus on specific conditions or where the outcome was readmission within more than 1 month. These exclusion criteria have limited the number of scores presented in this review, whereas some scores have shown good discrimination ability, and thus might be interesting to externally validate in other conditions. For example, the 80+score,36 an internally validated score on an elderly population which focuses on the patients ‘prescription, predicts the readmission within 1 year, with a good discrimination (c-statistic=0.72 (95% CI 0.66 to 0.77)).
Conclusions
This systematic review showed that several validated scores identifying elderly patients at risk of early readmission are available. Among all scores, ISAR and TRST scores have been extensively studied and validated and three promising scores (VIP, nomogram and LACE) need further examination, even if the choice of the best fitting score to our patients depends on the available data, the patient and intervention characteristics. Their use can facilitate the implementation of bundle interventions on high risk patients, given the limited resources available.
Acknowledgments
The authors would like to acknowledge Dr Agnes Dechartres and Dr Germain Perrin for their informed advice for the writing of this systematic review, Sophie Guiquerro, university librarian of the University of Paris Descartes for her support in developing the literature search strategy and Stella Ghouti for the correction of the manuscript.
References
Footnotes
Contributors Concept, design: CS, VK-S and PH. Data collection: CS and VK-S. Interpretation of results: CS, VK-S, PH and CF. Drafting of manuscript: CS. Critical revision of manuscript for important intellectual content: BS, CS, VK-S, PH and CF.
Funding The authors have not declared a specific grant for this research from any funding agency in the public, commercial or not-for-profit sectors.
Competing interests None declared.
Provenance and peer review Not commissioned; externally peer reviewed.
Data sharing statement It is a systematic review in which all the available data are presented in the manuscript or in the supplementary files.
Correction notice This article has been corrected since it was published. The affiliations and acknowledgement section have been updated.
Patient consent for publication Not required.