Article Text

Abstract
Objectives To investigate the accuracy, reproducibility and costs of different laboratory assays for the monitoring of unfractionated heparin (UFH) in clinical practice and to study test utilisation in Switzerland.
Design Prospective evaluation study and survey among Swiss hospitals and laboratories.
Setting Secondary care hospital in rural Switzerland (evaluation study); all Swiss hospitals and laboratories (survey).
Participants All consecutive patients, monitored for treatment with UFH during two time periods, were included (May to July 2014 and January to February 2015; n=254).
Outcome measures Results of activated partial thromboplastin time (aPTT), thrombin time (TT), prothrombinase-induced clotting time (PiCT) and anti-Xa activity with respect to UFH concentration
Results Spearman’s correlation coefficient (rs) with regard to anti-Xa activity was 0.68 (95% CI 0.60 to 0.75) for aPTT, 0.79 (0.69 to 0.86) for TT and 0.94 (0.93 to 0.95) for PiCT. The correlation (rs) between anti-Xa activity and heparin concentration as determined by spiking plasma samples was 1.0 (1.0 to 1.0). The coefficient of variation was at most 5% for PiCT and anti-Xa activity (within-run as well as day-to-day variability). The total costs per test in Swiss Francs (SFr) were SFr23.40 for aPTT, SFr33.30 for TT, SFr15.70 for PiCT and SFr24.15 for anti-Xa activity. The various tests were employed in Swiss institutions with the following frequencies: aPTT 53.2%, TT 21.6%, anti-Xa activity 7.2%, PiCT 1.4%; 16.6% of hospitals performed more than one test.
Conclusions The accuracy and reproducibility of PiCT and anti-Xa activity for monitoring of UFH was superior, and analytical costs were equivalent to or lower than aPTT and TT.
- heparin/therapy
- drug monitoring
- health care costs
- partial thromboplastin time
- thrombin time
This is an Open Access article distributed in accordance with the Creative Commons Attribution Non Commercial (CC BY-NC 4.0) license, which permits others to distribute, remix, adapt, build upon this work non-commercially, and license their derivative works on different terms, provided the original work is properly cited and the use is non-commercial. See: http://creativecommons.org/licenses/by-nc/4.0/
Statistics from Altmetric.com
Strengths and limitations of this study
We studied important aspects of heparin monitoring comprehensively in a joint investigation and compared the accuracy of activated partial thromboplastin time, thrombin time, prothrombinase-induced clotting time and anti-Xa measurements directly.
The study was conducted in the routine clinical practice of a rural secondary care hospital in Switzerland.
As an important limitation, our study was conducted in one institution only.
No clinical data were recorded and conclusions about clinical outcomes are not possible.
Introduction
Monitoring unfractionated heparin (UFH) treatment is common practice. This is mainly due to the experience that the patient’s response to UFH, measured with laboratory tests such as the activated partial thromboplastin time (aPTT), varies greatly.1 Clinical data supporting laboratory monitoring of UFH are however scarce and the evidence is limited. Observational studies have suggested that the occurrence of thromboembolism as well as bleeding is associated with the heparin dose applied.2–5 The occurrence of thromboembolism has been associated with lower aPTT values in small observational studies,6 7 and in a meta analyses of randomised controlled trials.8 9 Following these findings, monitoring of UFH is recommended by all scientific guidelines.1 10–12
There is however no consensus regarding the optimal laboratory test to be chosen in clinical practice.11–13 aPTT is suggested most often but the application of aPTT has important limitations. There is significant variability in sensitivity among different reagents and analysers12 and the aPTT measurement is influenced by many factors that vary in the critically ill.10 The thrombin time (TT), a clotting test performed by adding a known concentration of bovine thrombin to patient plasma, is used by a number of laboratories11 because TT is not influenced by factor VIII and other conditions associated with a prolonged baseline aPTT. However, the dose-response curve is not linear and at least two thrombin concentrations are needed to cover the full spectrum of drug concentration.11 14 15 Chromogenic anti-Xa activity assays were established16 17 but the reproducibility between the different assays is regarded as limited.18 In addition, the prothrombinase-induced clotting time (PiCT) assay was developed to facilitate the monitoring of different anticoagulants.19 The activated clotting time (ACT) is a rapid and easy-to-use point-of-care test widely applied in catheterisation labs and in cardiac surgery.20 21 It is however influenced by many factors other than heparin concentration.20 21 Overall, the clinical and laboratory data for the above-mentioned tests are limited and there is still no consensus regarding the optimal test to be used in clinical practice.
To contribute to the discussion and help resolve the uncertainties associated with the various UFH tests, we have conducted an evaluation study to investigate the diagnostic accuracy, reproducibility and costs of the various assays in clinical practice in a primary care hospital in rural Switzerland. In addition, we conducted a survey among healthcare institutions to study utilisation of assays in Switzerland.
Methods
Study design, setting and population
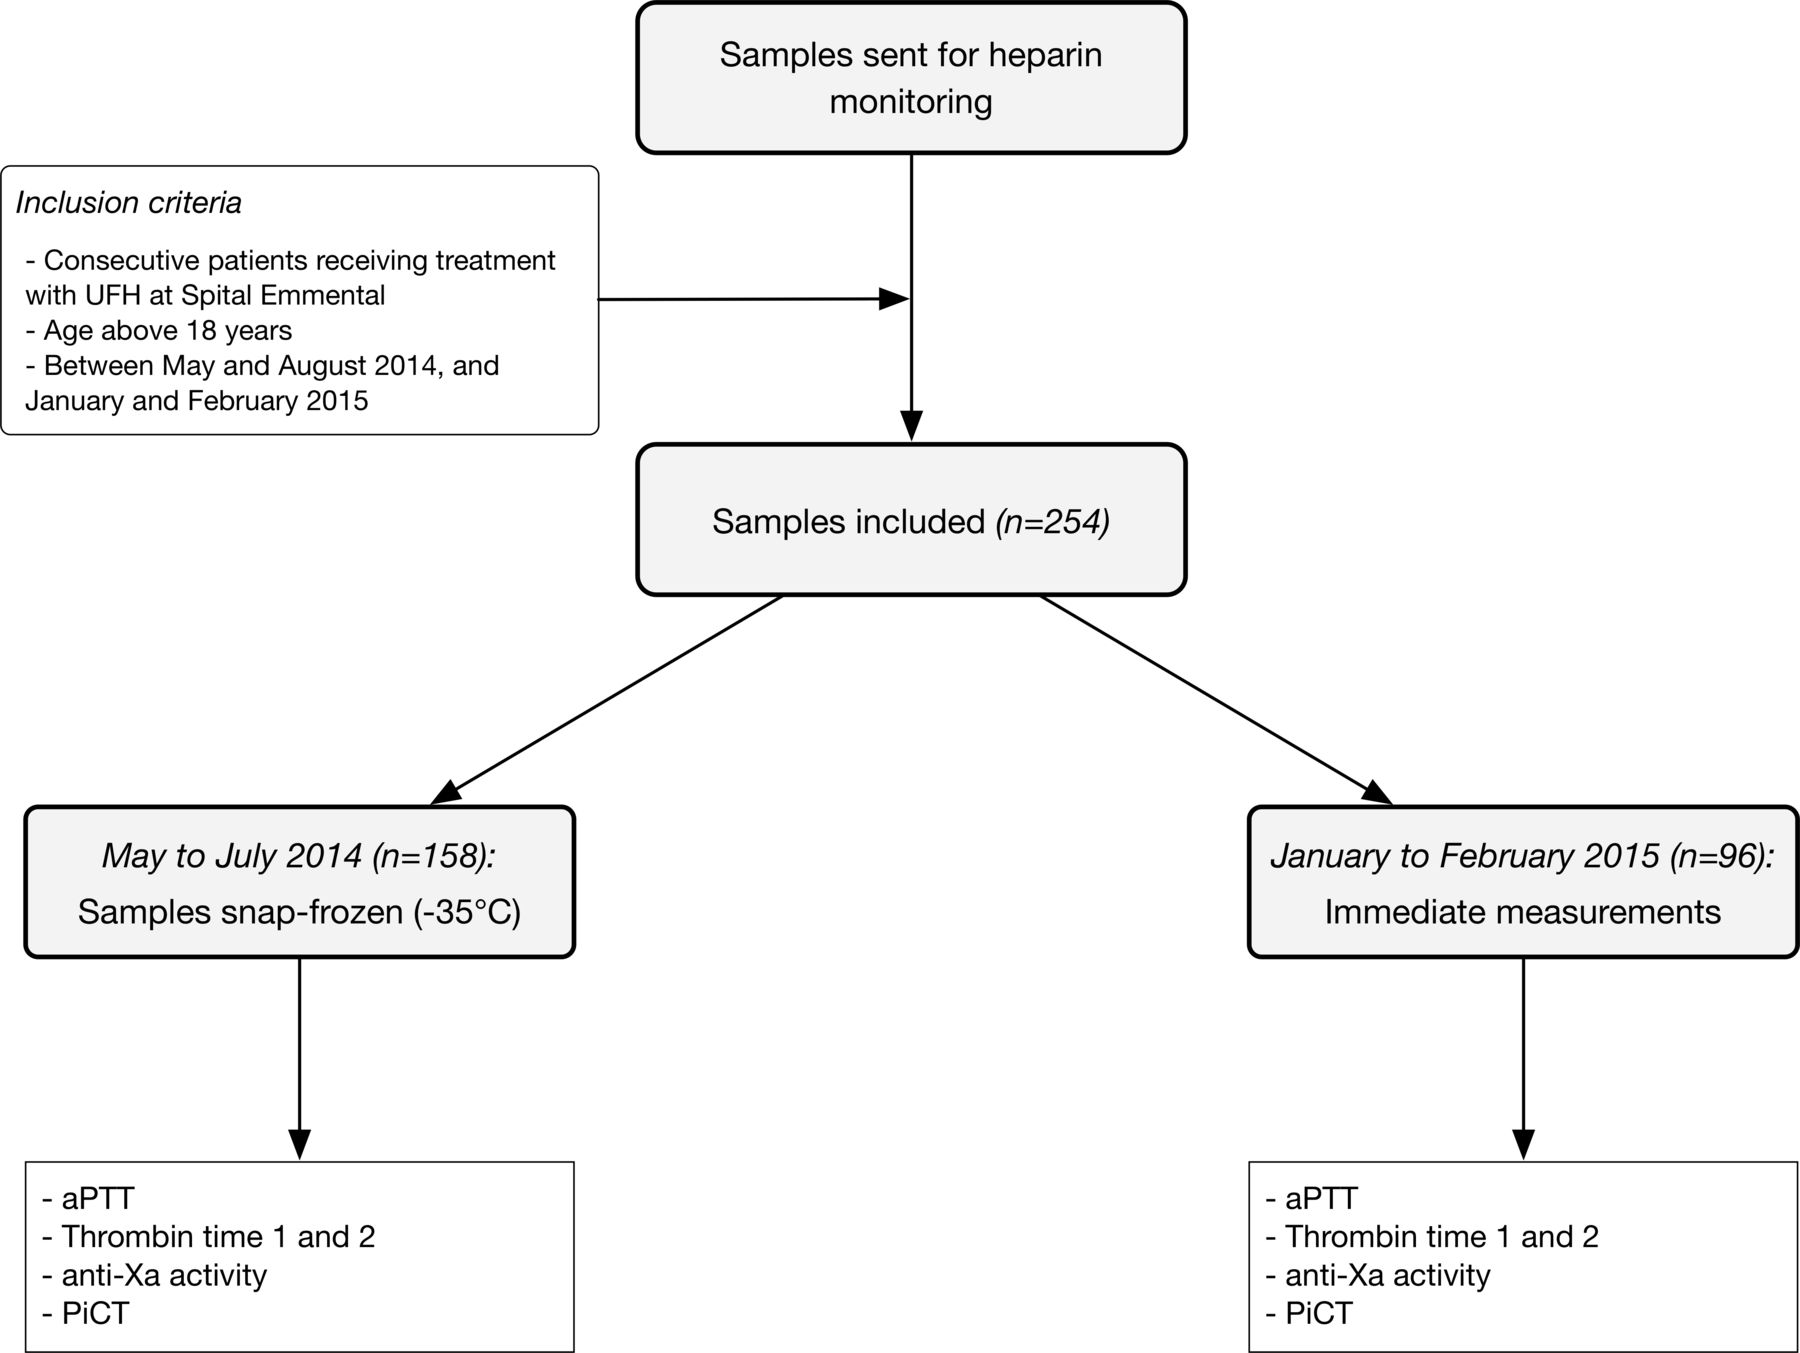
This prospective evaluation study was conducted in a secondary care hospital in rural Switzerland (Spital Emmental, Burgdorf, Switzerland) and all tests were performed during routine clinical practice. All consecutive patients, monitored for treatment with UFH during two time periods, were included (May to July 2014 and January to February 2015) and residual plasma samples were assessed with aPTT, TT, anti-Xa activity and PiCT. We did not apply ACT because it is used in special situations only (catheter lab, cardiac surgery) and not in a typical secondary care hospital. Patients were treated in hospital for a variety of medical and surgical diseases, and represent the typical mixed population of a secondary care hospital. The flow of the patients is shown in figure 1 and in line with official regulations no identifying or clinical data were retrieved. The laboratory of the hospital is accredited by the Swiss Accreditation Service.

Flow of the samples. aPTT, activated partial thromboplastin time; PiCT, prothrombinase-induced clotting time; UFH, unfractionated heparin.
Patient involvement
We did not involve patients at an early stage of this research project.
Collection and handling of blood samples
A standardised protocol for taking blood was implemented at Spital Emmental to ensure direct comparisons and to prevent preanalytical effects.22 Plastic syringes containing 1 mL trisodium citrate (0.106 mol/L) per 9 mL of blood were used (Monovette, Sarstedt, Nümbrecht, Germany). For practical reasons, samples were all frozen prior to conducting the various laboratory assays in the first group of patients in the study. Centrifuged plasma samples (1600 g for 10 min) were snap-frozen at −35°C, and analysed in batches. Analyses were performed within 4 weeks. For the second batch of patients, blood was taken but not frozen. The various laboratory assays were done within 4 hours of blood withdrawal (figure 1).
Determination of laboratory assays
aPTT was determined using HemosIL aPTT-SP (silicate activator; Instrumentation Laboratory, Bedford, Massachusetts, USA). Fifty microlitres of patient plasma were mixed with 50 µl of aPTT-SP. TT is a coagulation test measuring the time to fibrin formation after adding thrombin.23 Because of a high sensitivity for heparin, two thrombin concentrations are necessary to cover the full spectrum of heparin concentration. We used 3 U/mL (TT 1) and 7.5 U/mL (TT 2) of bovine thrombin (HemosIL TT; Instrumentation Laboratory, Bedford, Massachusetts, USA). TT 2 was determined in case of an unclottable TT 1 corresponding to a high concentration of heparin. Anti-Xa activity was determined using HemosIL liquid anti-Xa (Instrumentation Laboratory, Bedford, Massachusetts, USA), calibrated with HemosIL heparin calibrators. PiCT was measured using Pefakit PiCT (DSM Pentapharm, Basel, Switzerland). The test has been described in detail elsewhere.19 24 Briefly, 50 µL of patient plasma was incubated for 180 s with an activator containing activated factor Xa, phospholipids and Russell’s viper venom. Coagulation was initiated with calcium chloride and clotting time (s) measured. All analyses were performed on an ACL TOP 300 (Instrumentation Laboratory, Bedford, Massachusetts, USA).
Determination of the anti-Xa calibration curve
Scientific guidelines recommend calibration of laboratory tests used for heparin monitoring against plasma heparin concentration using methods such as anti-Xa activity or protamine titration.13 25 26 Whereas the accuracy of aPTT, TT and PiCT was investigated in relation to the anti-Xa activity, we demonstrated the accuracy of the anti-Xa activity assay with regard to the heparin concentration as determined using a titration study. A plasma pool was generated by mixing 5 mL of citrated plasma from 20 healthy volunteers demonstrated to have aPTT, PT, TT and fibrinogen concentrations within the reference range. A stock solution was prepared by adding 0.1 mL of UFH (HEPARIN Fresenius, 5,000 IU/mL, Fresenius Medical Care, Oberdorf, Switzerland) to 9.9 mL of plasma pool, resulting in a concentration of 50 IU/mL. This stock solution was diluted by 1:100 to obtain a working solution of 0.5 IE/mL. Decreasing volumes of the working solutions were added to increasing volumes of the plasma pool, resulting in samples with a heparin concentration ranging between 0.00 IU/ mL and 1.0 IU/mL. Anti-Xa activity was determined and a calibration curve created.
Reproducibility
We investigated the reproducibility of the above-mentioned laboratory assays by repeating the measurements one after another in one run using two samples, one with normal results and one with abnormal results (within-run variability). The day-to-day variability was studied by repeating the measurements using frozen aliquots of two samples (abnormal and normal, respectively).
Costs
We calculated the analytical cost of the various assays by taking the following factors into consideration: reagents, controls, calibrators, consumables and time taken. Labour costs were estimated according to the average wage of a qualified technician in Switzerland (SFr42, per hour). We considered the determination of TT 2 in 48% of cases (as done in our investigation) corresponding to a high concentration of heparin. For the determination of the time taken, we included the centrifugation time, time for analysis, as well as validation. Costs were based on the Swiss healthcare system.
Monitoring of UFH in clinical practice—a survey among Swiss healthcare institutions
Two sources were used to identify the Swiss healthcare institutions, which monitor UFH. First, the official list of hospitals, published by the Federal Office of Public Health (Federal Office of Public Health, Key figures for Swiss hospitals (Internet). 2013 (cited 01 November 2016). Available from: https://www.bag.admin.ch/bag/en/home/service/zahlen-fakten/zahlen-fakten-zu-spitaelern/kennzahlen-der-schweizer-spitaeler.html), and second, a list of laboratories providing training for laboratory specialists, issued by the Swiss Society of Medical Laboratories (FAMH) (The medical laboratories of Switzerland (FAMH), FAMH Weiterbildungsstätten (Internet). 2016 (cited 01 November 2016). Available from: https://www.famh.ch/weiterbildung-fortbildung/weiterbildung/famh-weiterbildungsstaetten/). The downloaded information was checked and duplicate entries were removed. A structured telephone interview was then conducted with the senior technician at each laboratory and the details recorded regarding the laboratory tests used to monitor UFH.
Statistical analysis
Numbers and percentages were reported as appropriate. We calculated the Spearman correlation coefficients to describe associations between results of aPTT, TT, PiCT, anti-Xa activity and heparin concentration. A linear regression according to the Deming procedure was additionally calculated. The coefficient of variation (CV) was used to describe within-run as well as day-to-day variability (mean is reported). No explicit power calculation has been done. Analyses were performed using the Stata V.14 statistics software package (Stata Statistical Software: Release 14; StataCorp, 2014; College Station, Texas, USA); figures were created using Prism V.6 (GraphPad Software, La Jolla California USA).
Results
Patient samples
Samples from 254 patients receiving treatment with UFH between May 2014 and February 2015 were evaluated. The flow of the samples is shown in figure 1. Between May to July 2014, blood samples were snap-frozen and analysed in batches; between January to February 2015, samples were analysed within 4 hours following the taking of blood.
Accuracy
The correlation between the different laboratory assays and anti-Xa activity is shown in table 1 which shows the values associated with all samples as well as the outcomes for the frozen or unfrozen batches. Figure 2 illustrates the distribution of the results and shows the regression line according to the Deming procedure. In relation to anti-Xa activity, the overall Spearman correlation coefficient (rs) was 0.68 (95% CI 0.60 to 0.75) for aPTT, 0.79 (0.69 to 0.86) for TT and 0.94 (0.93 to 0.95) for PiCT. Even though differences were noted between the frozen and unfrozen samples, the overall findings remain the same. Correlation (rs) between anti-Xa activity and heparin concentration was 1.0 (95% CI 1.0 to 1.0; figure 3).

Accuracy of different assays for heparin monitoring in clinical practice. (A) Activated partial thromboplastin time (aPTT), (B) thrombin time (high concentration), (C) prothrombinase-induced clotting time (PiCT). Scattergram with regression curves (Deming procedure) and correlation coefficients are shown.

Anti-Xa calibration curve according to titration studies using unfractionated heparin.
Accuracy of the various laboratory tests for heparin monitoring in clinical practice
Reproducibility
Measures of reproducibility are reported in table 2. Within-run variability, as determined by CV, was 5.7% for aPTT, 14.7% for TT (high concentration), 2.5% for PiCT and 3.4% for anti-Xa. Day-to-day variability was 3.7% for aPTT, 6.1% for TT, 1.1 for PiCT and 5.0 for anti-Xa activity.
Reproducibility of different laboratory tests for heparin monitoring in clinical practice
Time and cost estimates
The overall costs for each of the assays in Swiss Francs (SFr) were found to be SFr23.40 (aPTT), SFr33.30 (TT), SFr15.70 (PiCT) and SFr24.15 (anti-Xa activity). The times and costs required for each assay type were calculated are reported in table 3 with PiCT costing the least.
Laboratory tests for heparin monitoring in clinical practice: time and cost
Monitoring of UFH in Switzerland
One hundred and thirty-nine Swiss institutions were identified which conduct heparin monitoring in clinical practice. The vast majority of institutions implemented aPTT, TT or both assays (84.9%). Of the institutions 53.2 % relied exclusively on aPTT, 13.7% on anti-Xa activity and PiCT was used by just two institutions (1.4%). Further details are provided in table 4.
Laboratory tests used for heparin monitoring in clinical practice: a survey across healthcare institutions in Switzerland
Discussion
We found that concordance of laboratory measurements with heparin concentration was better for anti-Xa activity and PiCT compared with aPTT and TT. Reproducibility of anti-Xa and PiCT was at least comparable to aPTT. Analytical costs of PiCT were lower compared with aPTT. The majority of Swiss institutions conduct aPTT or TT for heparin monitoring.
Concordance of aPTT with heparin concentration is generally regarded as poor.26–28 The correlation coefficients we found are in line with previous studies. Bounameaux et al,14 in a study of 63 plasma samples, determined that Pearson’s correlation coefficient was 0.85 in case of TT and 0.67 in case of aPTT. In another analysis of 49 patients,15 a coefficient of determination (r2) of 0.63 for aPTT and 0.74 for TT was found. A multicentre study in 377 patients returned a correlation of 0.76 for aPTT with anti-Xa levels.24 A limited agreement has been observed in a prospective study in 569 patients.29 Several studies have demonstrated a dose-dependent prolongation of TT.12 14 15 In agreement with our results, alignment with heparin concentration was better with aPTT. Correlation of PiCT with anti-Xa levels was r=0.88 in a multicentre study in 377 patients.24 With regard to the anti-Xa activity, one small randomised controlled trial compared anti-Xa activity assay monitoring with aPTT and reported fewer complications in the case of anti-Xa.30
The strength of our investigation is that we have studied several important aspects of heparin monitoring in clinical practice in Switzerland in a joint investigation and compared the accuracy of aPTT, TT, PiCT and anti-Xa measurements directly.
Our study was conducted in one institution only. Therefore, we cannot exclude that results could be different if analyses were conducted in other laboratories. This issue should be studied in future investigations. Second, samples were treated differently between the two phases of our study; the first batch of samples were frozen prior to conducting the laboratory assays for practical reasons, and the second batch were not frozen. Although the results between these two batches of samples were found to differ (table 1), the differences found between the various assays nevertheless remained the same. And thirdly, correlation coefficient is not an ideal accuracy measure in case of TT, because correlation with heparin is not linear and two concentrations are needed to monitor UFH. Finally, there were no clinical data retrieved. Therefore, conclusions about clinical outcomes are not possible.
In conclusion, we have found that performance of PiCT and anti-Xa activity for heparin monitoring is superior to TT and aPTT in a single centre evaluation study in a secondary care hospital in Switzerland.
Acknowledgments
The authors thank the laboratory technicians of Spital Emmental for their support.
References
Footnotes
Contributors SB contributed to study design, conducted laboratory tests, conducted the survey, analysed the data and wrote the manuscript. BB contributed to study design and conducted laboratory tests. RE contributed to study design, provided infrastructure and reagents, and reviewed the statistical analysis. WAW contributed to study design and revised the statistical analysis. MN developed the study design and the statistical analysis plan, conducted the statistical analysis, and wrote the manuscript. All authors have reviewed and approved the final manuscript.
Funding This research received no specific grant from any funding agency in the public, commercial or not-for-profit sectors.
Competing interests MN has received research grants or lecture fees from Bayer, Axonlab and Roche Diagnostics.
Patient consent Not required.
Ethics approval The protocol was approved by the local ethics committee (Kantonale Ethikkommission Bern; 18 March 2014).
Provenance and peer review Not commissioned; externally peer reviewed.
Data sharing statement All requests should be directed to the corresponding author.