Article Text

Abstract
Introduction Early childhood is a key period to establish policies and practices that optimise children's health and development, but Canada lacks nationally representative data on social indicators of children's well-being. To address this gap, the Early Development Instrument (EDI), a teacher-administered questionnaire completed for kindergarten-age children, has been implemented across most Canadian provinces over the past 10 years. The purpose of this protocol is to describe the Canadian Neighbourhoods and Early Child Development (CanNECD) Study, the aims of which are to create a pan-Canadian EDI database to monitor trends over time in children's developmental health and to advance research examining the social determinants of health.
Methods and analysis Canada-wide EDI records from 2004 to 2014 (representing over 700 000 children) will be linked to Canada Census and Income Taxfiler data. Variables of socioeconomic status derived from these databases will be used to predict neighbourhood-level EDI vulnerability rates by conducting a series of regression analyses and latent variable models at provincial/territorial and national levels. Where data are available, we will measure the neighbourhood-level change in developmental vulnerability rates over time and model the socioeconomic factors associated with those trends.
Ethics and dissemination Ethics approval for this study was granted by the Behavioural Research Ethics Board at the University of British Columbia. Study findings will be disseminated to key partners, including provincial and federal ministries, schools and school districts, collaborative community groups and the early childhood development research community. The database created as part of this longitudinal population-level monitoring system will allow researchers to associate practices, programmes and policies at school and community levels with trends in developmental health outcomes. The CanNECD Study will guide future early childhood development action and policies, using the database as a tool for formative programme and policy evaluation.
- early childhood development
- social determinants of health
- Early Development Instrument
- data linkage
This is an Open Access article distributed in accordance with the Creative Commons Attribution Non Commercial (CC BY-NC 4.0) license, which permits others to distribute, remix, adapt, build upon this work non-commercially, and license their derivative works on different terms, provided the original work is properly cited and the use is non-commercial. See: http://creativecommons.org/licenses/by-nc/4.0/
Statistics from Altmetric.com
Strengths and limitations of this study
The Canadian Neighbourhoods and Early Child Development (CanNECD) Study will use whole-population pan-Canadian data to monitor developmental health trajectories in the child population. By creating a national database of Early Development Instrument (EDI) results, we can sample more than 700 000 kindergarten-age children.
The study provides opportunity for a broad overview of children's developmental vulnerability across Canada and over time while also allowing more in-depth analyses of the socioeconomic determinants of health and well-being.
Unique neighbourhood-level data linkages will allow us to develop measures that can be compared across all Canadian provinces.
Gaps or changes in data collection in some provinces and years (eg, the 2011 Census) may potentially be important limitations.
Introduction
The early years of childhood are a key developmental period. Early experiences become biologically embedded, shaping physiological pathways that have lifelong protective or detrimental effects on health, well-being, learning and behaviour.1–3 Many young children in Canada are affected by physical, mental, cognitive and social–emotional challenges, which, in turn, are associated with negative outcomes later in life, such as poor health, school failure, delinquent behaviour and unemployment.4–8 But even though children's developmental trajectories are strongly influenced by early experiences, their outcomes are not set in stone. Investment in early childhood has been shown to have substantial benefits on health and social functioning in adulthood.9 ,10 Thus, early childhood offers a window of opportunity that promises the greatest ‘return on investment’ in establishing policies and practices that optimise children's developmental health and help them succeed later in life.11
Measuring early childhood development
Current data on children's well-being that are available at local, regional, provincial and national levels, and over time, are essential for constructing and adapting social policies related to developmental health, and translating knowledge into action. Until recently, however, Canada has lacked nationally representative data on social indicators of children's developmental health. To address this gap in Canada's ability to holistically monitor child development trends over time and explore variability across jurisdictions, data collection initiatives have been implemented across most Canadian provinces and territories over the past 10 years using a common tool, the Early Development Instrument (EDI).12–15 The EDI is a kindergarten teacher-administered questionnaire that measures children's developmental health across five core domains: physical health and well-being; social competence; emotional maturity; language and cognitive development; and communication skills and general knowledge (table 1). EDI data, collected for each child individually, are reported at aggregate levels to provide an assessment of developmental vulnerability in a population. EDI developmental vulnerability rates may be interpreted as an estimate of the proportion which, without additional support, may experience future academic and societal challenges and lower levels of well-being. In Canada, the average rate of developmental vulnerability in at least one area of development is 26%, with a range between 17% and 36% for provinces and territories where these data are available.16
EDI domains and variables available from aggregated data
Developmental health outcomes are not equally distributed in our society, but rather follow socioeconomic gradients. Children who are born to teen mothers, are in families receiving income assistance or are involved with child welfare services are up to four times more likely to be vulnerable than children who are not in any of these subgroups.17 Previous research has shown that vulnerabilities in children's developmental health differ by as much as 10-fold across neighbourhoods, with vulnerability rates ranging from less than 5% to above 50%.18 Neighbourhoods, defined as discrete geographical units that share social, cultural, demographic and/or socioeconomic characteristics, appear to have an important influence on children's development, health and well-being. Neighbourhood effects are complex and may include, for example, social-interactive effects (such as social cohesion and family dynamics), geographical effects (such as proximity to child-family resources) and institutional effects (the distribution of power and the political economy, including the quality of schools in the neighbourhood).19 The underlying mechanisms that may explain the associations between neighbourhood characteristics and child development outcomes are, however, not well understood, and methods that allow researchers to account for the complex associations between health determinants and child development outcomes are under investigation by our team20–23 and others.24–26
Building a pan-Canadian population-based monitoring system for early childhood development
Australia and Canada are the only countries in the world that have collected population-based data on children's early development, akin to a census.27 Comparable data on the five core areas of early childhood development using the EDI exist for 12 out of 13 Canadian provinces and territories. The use of this common tool across Canada enables linking of child development data and Census-derived socioeconomic neighbourhood-level characteristics, and facilitates the analysis of developmental health patterns across Canadian jurisdictions. To this end, we have identified five key research questions that will guide the project:
Which (combinations of) socioeconomic variables are most strongly associated with developmental health outcomes at the neighbourhood level?
To what extent do the important social determinants and steepness of the social gradients of developmental health differ between jurisdictions (ie, health regions, provinces, rural vs urban) across Canada?
In what ways do the important social determinants and steepness of the social gradients of developmental health differ across subpopulations?
What are the sociodemographic characteristics and programmes that are associated with ‘off-diagonal’ neighbourhoods, or neighbourhoods that consistently show significantly higher or lower developmental health outcomes than would have been predicted by their socioeconomic status (SES)?
How do patterns of neighbourhood-level developmental health vary over time, and to what extent are increasing or decreasing trends associated with specific social and demographic contextual factors?
Thus, the purpose of this protocol is to describe the creation of a pan-Canadian EDI database as part of the Canadian Neighbourhoods and Early Child Development (CanNECD) Study. The database will be used to monitor developmental health trajectories of the child population, and by addressing the research questions, to demonstrate how the database will advance research examining the social determinants of developmental health. Establishing nationwide EDI data linkages will allow us to identify social determinants of childhood developmental health and the programmes and policies that work best for maximising healthy child development and family functioning.
Methods and analysis
Data sources and variables
Early childhood developmental health data
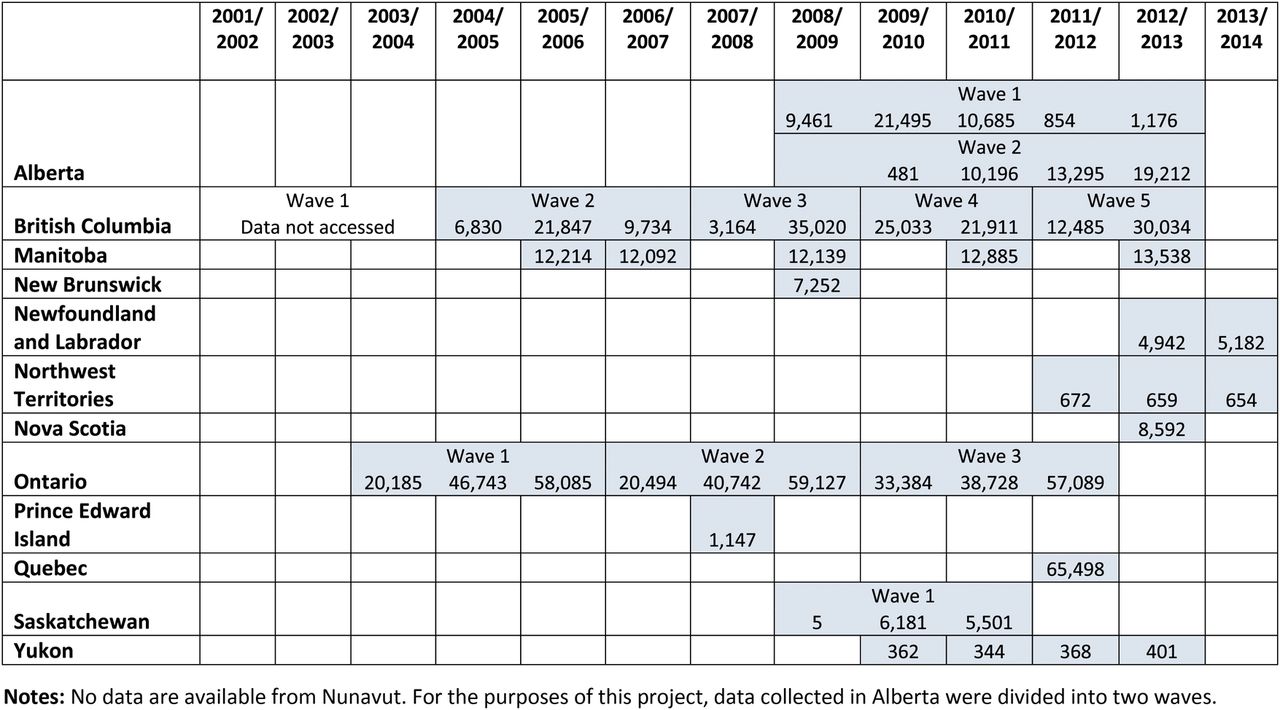
Data on early childhood developmental health have been collected with the EDI at population level since 2003/2004 in 12 of 13 Canadian provinces and territories, forming the database constructed for the CanNECD Study. Jurisdictions that have participated in EDI data collection have been provided government and/or foundation funding to have all kindergarten teachers complete the 103-item EDI questionnaire for each of their kindergarten children in the middle of the kindergarten year.13 The Canadian EDI database contains EDI data from 2003/2004 to 2013/2014, spanning 12 of the 13 Canadian provinces and territories. The database currently comprises 798 298 children of kindergarten age (figure 1). In some provinces, the EDI data have been collected in ‘waves’, where a subset of the provincial population was sampled each year until each neighbourhood within the jurisdiction had been sampled to complete full provincial coverage. EDI data are collected for individual children and are then aggregated according to geographic or demographic criteria (eg, by school, neighbourhood, school district or province/territory), and reported either as mean item scores for each of the EDI's developmental domains or subdomains, or as vulnerability scores (ie, percentage of vulnerable children) for each aggregate unit. The EDI score vulnerability classifications for each domain are based on a cut-off score at the 10th percentile for a nationally representative normative sample of Canadian children.13 The psychometric properties of the EDI have been validated extensively, including studies using multilevel covariance analysis and differential item functioning, showing that the EDI has high predictive validity for later school achievement.14 ,15 ,28 Table 1 lists the variables in the EDI included in the CanNECD Study EDI database accessible to Canadian researchers via this project.

EDI records collected across Canada by year.
Neighbourhood-level SES data
Small area-level data on SES and demographic information will come from the 2006 and 2011 Canadian Census and 2005 and 2010 Income Taxfiler databases. The smallest geographic areas for which population and dwelling counts are available are dissemination blocks (DBs). The area of a DB is equivalent to a city block bounded by intersecting streets, and these cover all the territory of Canada. Together, the Census and Income Taxfiler databases contain more than 1500 neighbourhood-level demographic and SES variables, including information on, for example, income, poverty, wealth, employment, education, immigration, donations, family composition, transience/residential stability, ethnicity and age distributions.
Data linkage
Defining geographic neighbourhood boundaries
To systematically examine associations between early childhood development outcomes and demographic and socioeconomic neighbourhood characteristics, this project has devised a systematic neighbourhood boundary definition process to create contiguous, discrete neighbourhood units for the analysis of the Canada-wide EDI data. Accordingly, neighbourhood boundaries are designed to optimally portray geographic and socioeconomic variability across neighbourhoods. We have developed a set of criteria (box 1) and designed a series of steps to establish neighbourhood boundaries (box 2). Throughout this process, we consulted with representatives from government departments and agencies (such as education and child health) and community organisations to align neighbourhood boundaries with those that are being used for local governance and community planning. We also consulted with academic groups conducting early childhood development research in each province, where available, to ascertain that neighbourhood boundaries meet scientific criteria for locally meaningful neighbourhood effects research. In addition, a criterion pertaining to the minimum number of EDI records of 50 per neighbourhood was based on previous EDI reliability research. Where a neighbourhood unit has more than 400–600 EDI records, it will be further divided to maximise the opportunity to display variance while prioritising pre-existing neighbourhood boundaries, where applicable. Larger rural areas will be maintained as individual units using Canada Census subdivisions, which exist across all provinces and are a proxy for rural municipality boundaries, as long as they meet the EDI record population size criteria (minimum 50 records). Where EDI record density is low, we will use Census subdivisions as the largest spatial unit. At the end of the neighbourhood definition process, each neighbourhood will be described by assigning it a name (eg, MB0020 for Manitoba neighbourhood number 20) and a label (eg, Dauphin).
Criteria for defining neighbourhood boundaries
Must have a minimum of 50 EDI records per unit (and maintain 50 records over time, if applicable)
Results should be verified with local contacts, where possible
Should have no more than 400–600 EDI records per unit
Must nest within Statistics Canada Census Divisions
Should use local ‘neighbourhood’ or other applicable administrative boundaries, where possible
Spatial units must be made up of the smallest viable geographic unit (DBs) that allows for linking with other sources of data (ie, Census data, Income Taxfiler data)
Neighbourhood definition process
Within each province, assign geographic coordinates for individual EDI records with two collection time points using the Postal Code Conversion File.
▸ Use postal code if the positional accuracy is high enough, or
▸ Use school location if the positional accuracy is too low
Identify geographic units with a minimum of 50 records for both points in time.
Erase the identified units with ≥50 records for both time points from next largest geography. This will ensure that records within a ‘neighbourhood’ identified in step 2 are not counted when repeating the process for the next largest geography.
Repeat the process for Census Subdivisions, Census Consolidated Subdivisions and Census Divisions. For the largest geography (Census Divisions), skip step 3, as there is not a larger geography to erase the results from.
Merge all of the resulting geographic units from steps 2, 3 and 4 together to create one neighbourhood network that covers the entire province.
Identify units that still have <50 children and dissolve them with appropriate neighbouring units:
▸ If a unit with <50 records is nested completely within a larger geographic unit, dissolve it with the surrounding unit
▸ When dissolving neighbouring features together, use other administrative boundaries and geographic features to determine which to group together (eg, road networks, water bodies, Census Division boundaries, Regional Health Authority boundaries, average income by DB and other socioeconomic factors)
Creating appropriate neighbourhood units in dense, heavily populated urban areas:
If any of the resulting units from the steps above have an EDI record count >400–600 children (ie, densely populated urban areas), they can be divided into smaller neighbourhood units.
▸ Use other administrative boundaries (eg, city planning neighbourhoods or school districts) or major dividing landmarks (eg, east/west of a highway or water body), or
▸ Group urban Census geographies by similar qualities (ie, average income)
Match the smallest viable geographic unit with newly created neighbourhood boundaries, and correct for any edge effects (ie, where DB boundaries and other administrative boundaries do not line up).
Integrating EDI and neighbourhood data
In order to obtain a semicustom profile of Census variables from Statistics Canada, we will create a correspondence file in Excel with three columns. The first column will list each of the approximately 479 000 DBs in Canada (using the official Statistics Canada DB name), while the second and third columns will list the corresponding neighbourhood name and label we assign, respectively. Separate correspondence files will be created for 2006 and 2011, as there were minor changes in the DBs between those Census years. These two files will then be sent to Statistics Canada, where analysts will attach the values of over 2000 requested semicustom Census variables to each DB, and then calculate a population-weighted aggregate for each variable for each of the pan-Canadian neighbourhood units. The resulting, custom-built data file with over 2000 Census variables will be sent back to the project team in Beyond 20/20 file format, for each of the 2058 neighbourhoods, stratified by Census year (2006 or 2011). Owing to the fact the Canadian government replaced the 2011 long-form Census with the National Household Survey (NHS), we will request two files for 2011: one with the variables from the short-form Census, and one with the NHS variables.
A similar process for creating a correspondence file will be employed for the Income Taxfiler variables. However, the Income Statistics Division of Statistics Canada requires postal codes (rather than DBs) for the correspondence files. As such, we will send Statistics Canada Excel files containing all postal codes in Canada, the corresponding neighbourhood name and the associated label for 2005 and 2010. Statistics Canada analysts will calculate the values of the requested Income Taxfiler variables for each postal code, and then aggregate the population-weighted results up to the level of the pan-Canadian neighbourhoods.
At the Offord Centre for Child Studies at McMaster University, we will aggregate individual EDI data to the neighbourhood level using the geocoded pan-Canadian boundaries. The EDI variables can then be merged with the Census and Income Taxfiler variables at systematically defined neighbourhood levels, using the neighbourhood variable name as the linking variable.
Data access and security
The national repository for all individual-level EDI data is securely housed at McMaster University in Hamilton, Ontario. For this project, the neighbourhood-level aggregated EDI, Census and Income Taxfiler data will be hosted in the secure database system operating in the Public Economics Data Analysis Laboratory (PEDAL) at McMaster University. Authorised and approved users gain access to PEDAL through a remote connection device, and data are protected through a double firewall security system, dual encryption and a user interface that prevents retrieval of data. Analyses are completed via remote access, and only outputs that meet data sharing requirements that protect confidentiality and allow for the deduction of meaningful statistics are exported for further research purposes. PEDAL will also enhance our ability to link the database with publicly available geographically aggregated provincial or federal data, such as health and education records.
Analysis plan
The planned analyses are designed to address each of the project's five research questions.
Developing an SES index: There are thousands of socioeconomic and demographic variables available at the neighbourhood level. Our goal is to identify a small subset of between 5 and 20 variables that represents an optimal compromise between maximising the variance explained in developmental health outcomes and restricting the included components to a number that can be reasonably interpreted. The initial choice of potential variables will be informed by several criteria, including the current Canadian health literature relating to SES indices;29–33 an intention to cover a wide variety of theoretically important social determinants; and the aforementioned desire to maximise the variance explained across all of our developmental health domains. Our method for selecting variables as components of an SES index will be based on the existing methodological approach used at the Human Early Learning Partnership at the University of British Columbia.34 The resulting SES index will be composed of the most important variables to account for variation in EDI scores across all of the neighbourhoods in Canada.
EDI–SES relationships across different geographical areas: This research question addresses the importance of geographic context in children's developmental outcomes through investigation of how well the SES index performs across different geographic units (neighbourhoods). There will almost certainly be marked differences in the amount of variance explained by the index, and in the steepness of the social gradients for each index component, when comparing one province/territory with another, urban neighbourhoods with rural ones and perhaps provincial/territorial capitals with other cities. We will explore and describe these varying results, test the influence of non-index variables on observed gradients and explanatory power, and try to develop theoretical explanations for the observed patterns. The relative predictive strength across provinces of child-related policy variables (from Taxfiler), for example, may provide important insights into social determinants at the societal level.
EDI–SES relationships across subpopulations of children: Just as we expect to find interesting geographic differences in the performance of the SES index, it is as likely that the influence of SES on children's developmental health will be a function of the child context. The EDI does capture these context variables to some extent; they include child gender, child special needs status and English (or French) as a second language (ESL/FSL) status. Therefore, it is possible, for most neighbourhoods, to calculate neighbourhood-level vulnerability rates for these subpopulations. These vulnerability rates could then be used to explore how EDI–SES relationships vary across these subpopulations, both in the strength of the relationship and the steepness of the social gradients. Similarly to Research Question 2, exploring these child-contextual differences will help us develop theoretical explanations for their role in overall developmental health.
EDI–SES relationships in off-diagonal neighbourhoods: Our SES index will be composed of a small number of theoretically relevant SES variables that collectively optimise variation accounted for in developmental vulnerability. This means that, for most neighbourhoods, there will be a close correspondence between the actual vulnerability rate and the vulnerability rate predicted by the SES index. These are the ‘on-diagonal’ neighbourhoods. However, there will be some neighbourhoods (which we label ‘off-diagonal’) where the actual vulnerability rate is substantially higher or lower than predicted from the index. There is no standard definition of ‘substantially higher or lower’, but in one jurisdiction, an off-diagonal neighbourhood has been defined as one that is among the 20% of neighbourhoods with the greatest discrepancy (half higher, half lower) between actual and predicted vulnerability, consistently over two time points.35 These off-diagonal neighbourhoods are particularly interesting because they represent places where the most important determinants of vulnerability are not the typical ones (ie, those that were included in the index). By looking more closely at these neighbourhoods, we can explore other potentially important determinants of children's health (particularly if these determinants are among those available from Census or Income Taxfiler data). One potential strategy would be to compare off-diagonal neighbourhoods with their on-diagonal counterparts that have been matched geographically and on components of the SES index. Comparisons would be made on other available SES variables. Future research could focus on identifying potential important non-SES variables (eg, social capital) that could be captured in sufficient numbers to provide reliable neighbourhood-level estimates.
Change over time in EDI–SES relationships: Five provinces and two territories have collected two or more waves of EDI data (figure 1), allowing for change-over-time analyses at the aggregate (eg, neighbourhood, school district or province) level. Our research team has previously developed a microsimulation technique that models the reliability of neighbourhood-level EDI vulnerability rates, taking into account the number of children in a given neighbourhood.28 Using a generalisability theory approach to measurement reliability, we are able to estimate the size of a ‘critical difference’ for EDI vulnerability rates, for any aggregate unit size. In other words, we can calculate the threshold for a statistically significant neighbourhood-level increase or decrease in EDI vulnerability rates over two time points. We will use this methodology to describe broad patterns of developmental vulnerability in the four jurisdictions, and explore regional differences in these patterns. We will also conduct analyses to examine the SES factors that are associated with particular EDI vulnerability trends over time. We will use latent class modelling to create a classification of neighbourhoods according to their patterns of change over time (eg, consistently low or high average developmental health outcomes; increasing or decreasing trends of EDI vulnerability rates over time). Then, we will statistically model which socioeconomic and demographic predictors are associated with each of the different patterns. Our analyses will thus explore the extent to which the trends over time reflect changes in the respective jurisdictions’ child population and/or social context.
Ethics and dissemination
Ethics approval for the CanNECD Study methodology was granted by the Behavioural Research Ethics Board at the University of British Columbia. Participant confidentiality is protected as the EDI, Census and Income Taxfiler data for this project are aggregated to the neighbourhood level, and hosted in a secure database system.
The study investigators have significant experience in knowledge translation and will ensure that the results are accessible and usable to researchers and policymakers. Substantial energy has been devoted to building the relationships required to ensure that the research is strongly connected with action. Currently, the results of each wave of EDI implementation are disseminated to each participating community and school district through a detailed reporting system that can be customised to specific knowledge users. The EDI outcomes have been incorporated by governments and agencies at various levels as a broad index of child well-being at school entry, or to investigate the association of community-level variables with child development for programme improvement.36 These activities have had a profound influence on the understanding of developmental health across broad audiences.
We will use a number of diverse approaches to meet our knowledge translation goals, including maintaining an online platform for the dissemination of knowledge generated by the project; creating new and engaging ways of visualising complex information to potential users, such as neighbourhood-level geographical mapping; reporting results in lay language to key partners, including provincial and federal ministries, school districts, schools and collaborative community groups; publishing peer-reviewed research articles; presenting findings at academic conferences; and maintaining a strong emphasis on continued community engagement and relationship-building to understand the need of knowledge users, and to ensure that new knowledge is being appropriately translated and disseminated. The new database will provide important national context to the existing local, regional and provincial reporting.
Discussion
The CanNECD Study brings together, for the first time, all of the Canadian EDI data collected at the population level since 2004, creates neighbourhood-level aggregate scores according to a systematic set of neighbourhood definition criteria and links the aggregate EDI vulnerability rates to a comprehensive suite of Census and Taxfiler data. In the long term, the longitudinal population-level monitoring network will allow us to associate practices, programmes and policies at school and community levels with trends in developmental health outcomes. Moreover, each of the institutions represented by the members of the research team has established consulting or collaborative links with relevant provincial governments. Thus, our project is well positioned to guide future early childhood development action and policies at a scale not possible thus far, by using the database as a tool for formative programme and policy evaluation.
Promoting positive early childhood development is a priority for Canada, but comprehensive data were lacking until the implementation of the EDI in the 2000s. Health-related research, practices and policies are most beneficial when they are informed by data that are representative at the population level, rather than relying on information limited to certain places or subpopulations. Understanding of the determinants of disease onset and progression has benefited greatly from studies based on cross-jurisdictional, population-based databases; the same benefit would accrue from conducting pan-Canadian research on the social determinants of children's developmental health in the early years. Specifically, by establishing a representative database on children's developmental health trajectories that is analysable at local, provincial and pan-Canadian levels, we can identify areas of developmental strength and needs across place, subpopulation and time. The answers to our research questions will provide highly contextualised information on as complete a population of Canadian children as pragmatically possible, and the social and economic factors that are associated with positive or negative developmental health outcomes. These answers can then be used at a variety of levels, from helping local early-year stakeholders in their decision-making and practices to guiding and evaluating effective social policies at the provincial/territorial and national levels.
The use of pan-Canadian data in the CanNECD Study is one of its greatest strengths. Using whole-population data maximises statistical power while minimising the selection bias associated with studies based on samples, making it possible to detect important relationships between exposures and outcomes in kindergarten-age children at local levels and for subpopulations. The study will give a broad view of children's developmental vulnerability across Canada while also allowing more in-depth analyses of the socioeconomic determinants of health and well-being. A second unique strength of the study is the national comparability of the outcome and exposure measures, as well as the geographic reference unit. Thus far, there have been no indicators of early development available for Canadian children beyond sample-based studies, such as the National Longitudinal Survey of Children and Youth (NLSCY), which has now been discontinued. While the NLSCY measures had the potential to explore child development in more depth than the EDI, for most jurisdictions, they were only available at a provincial level, without the possibility of disaggregation to a neighbourhood level due to small sample sizes. A third strength of our study is the purposeful use of Census and Taxfiler variables relevant to child development and customised for neighbourhoods based on the EDI data. This ‘fit-for-purpose’ approach has rarely been used (although see,)33 due to a lack of child-level data that could be used in this way. It remains to be seen whether the sociodemographic variables that will constitute the SES index we aim to develop are markedly different from those in other existing indices constructed largely to explain variation in adult-level outcomes. However, the potential for deeper understanding of the social determinants of children's development using this approach is unprecedented.
Although the unique linkages and use of comparable population data in our database have a number of advantages, there are also limitations. First, the EDI data in the database have not been collected at the same time point in every jurisdiction, and in many of them, the provincial ‘waves’ have been collected over 2–3 years. Moreover, in several provinces, data have only been collected once in the period covered by our study, thus potentially exposing these particular regions to a chance of a temporal bias. Second, as the Census happens on a regular basis every 5 years, the sociodemographic data were not collected contemporaneously with the EDI for many of the waves. In addition, as explained above, there was a major methodological change in the way the Census data were collected in Canada between 2006 and 2011;i therefore, any analyses using the 2011 cycle data will have to be interpreted with caution. Finally, while linkages to socioeconomic and demographic Census data (and potentially, to policy information, and education and health records) provide considerable depth and breadth to studying social determinants of early child development outcomes, the neighbourhood-level linkages may not be able to uncover sociological and psychological processes and mechanisms that could underlie associations between child development outcomes and social determinants. Parallel to our study, individual-level linkages need to be further explored to shed light on child development outcomes in the socioeconomic and demographic context.
In conclusion, we anticipate that population-based data linkages, such as the one described in this study, comprehensive longitudinal child development studies and policy analyses complement and inform each other to jointly address remaining questions in the field, and to inform best practices and policy decision-making in the area of early child development.
References
Footnotes
Contributors The study was conceived by Clyde Hertzman, MG and MJ, who were the coprincipal investigators on the original funded grant proposal; BF conceived the original analysis plan and wrote the analysis section of the paper. All authors are participating in the interpretation of findings and the drafting of manuscripts.
Funding This work was supported by an operating grant from the Canadian Institutes of Health Research (FRN 125965).
Competing interests None declared.
Ethics approval Behavioural Research Ethics Board at the University of British Columbia.
Provenance and peer review Not commissioned; peer reviewed for ethical and funding approval prior to submission.
↵i The mandatory long-form Census was reinstated for the year 2016.