Article Text

Abstract
Objectives To construct and internally validate a risk score, the ‘80+ score’, for revisits to hospital and mortality for older patients, incorporating aspects of pharmacotherapy. Our secondary aim was to compare the discriminatory ability of the score with that of three validated tools for measuring inappropriate prescribing: Screening Tool of Older Person's Prescriptions (STOPP), Screening Tool to Alert doctors to Right Treatment (START) and Medication Appropriateness Index (MAI).
Setting Two acute internal medicine wards at Uppsala University hospital. Patient data were used from a randomised controlled trial investigating the effects of a comprehensive clinical pharmacist intervention.
Participants Data from 368 patients, aged 80 years and older, admitted to one of the study wards.
Primary outcome measure Time to rehospitalisation or death during the year after discharge from hospital. Candidate variables were selected among a large number of clinical and drug-specific variables. After a selection process, a score for risk estimation was constructed. The 80+ score was internally validated, and the discriminatory ability of the score and of STOPP, START and MAI was assessed using C-statistics.
Results Seven variables were selected. Impaired renal function, pulmonary disease, malignant disease, living in a nursing home, being prescribed an opioid or being prescribed a drug for peptic ulcer or gastroesophageal reflux disease were associated with an increased risk, while being prescribed an antidepressant drug (tricyclic antidepressants not included) was linked to a lower risk of the outcome. These variables made up the components of the 80+ score. The C-statistics were 0.71 (80+), 0.57 (STOPP), 0.54 (START) and 0.63 (MAI).
Conclusions We developed and internally validated a score for prediction of risk of rehospitalisation and mortality in hospitalised older people. The score discriminated risk better than available tools for inappropriate prescribing. Pending external validation, this score can aid in clinical identification of high-risk patients and targeting of interventions.
- Prediction model
- Risk-estimation
- INTERNAL MEDICINE
- THERAPEUTICS (pharmacotherapy)
- GERIATRIC MEDICINE
- Organisation of health services < HEALTH SERVICES ADMINISTRATION & MANAGEMENT
This is an Open Access article distributed in accordance with the Creative Commons Attribution Non Commercial (CC BY-NC 4.0) license, which permits others to distribute, remix, adapt, build upon this work non-commercially, and license their derivative works on different terms, provided the original work is properly cited and the use is non-commercial. See: http://creativecommons.org/licenses/by-nc/4.0/
Statistics from Altmetric.com
- Prediction model
- Risk-estimation
- INTERNAL MEDICINE
- THERAPEUTICS (pharmacotherapy)
- GERIATRIC MEDICINE
- Organisation of health services < HEALTH SERVICES ADMINISTRATION & MANAGEMENT
Strengths and limitations of this study
-
The 80+ score is based on data from a population on which there are strong incentives to focus: patients at high risk of hospitalisation and also of mortality.
-
The score is constructed from a prediction model that includes aspects of pharmacotherapy. The use of drugs can be either positively or negatively causally related to a clinical outcome, and can also be important indicators for a certain condition, disease or circumstance.
-
Data from a limited number of patients being admitted to an acute internal medicine ward at one hospital only were used in the construction of the score. The generalisability of the score is therefore unknown.
-
The 80+ score was internally validated, but external validation is required before general use and recommendation.
Background
Hospitalisations of older people pose an increasing economic burden on healthcare systems in the developed world. During recent years, attempts have been made to identify risk factors for hospital readmissions in order to help target interventions and decrease readmission rates.1 ,2 Variables tested for their ability to predict readmissions have included patient demographic factors, medical comorbidity data, laboratory data, social determinants of health, patient functional status and prior use of healthcare services. However, the patients’ medication use has rarely been evaluated as potential predictors of readmissions. As adverse drug reactions are the main cause of up to a fourth of hospital admissions3–5 and are ranked as the fourth to sixth leading cause of death in the USA,6 this is surprising. In older people, multiple coexisting diagnoses and concomitant multidrug use are common. This group is also, due to pharmacokinetic and pharmacodynamic changes, at increased risk of adverse drug reactions7 ,8 and, hence, hospitalisations and mortality. For this population in particular, the use of medications should be considered as a potential prognostic factor for revisits to hospital and mortality.
There are several tools available for assessment of appropriateness of prescribing in older people,9–16 which can be used prospectively as guides to appropriate prescribing or retrospectively for evaluation of the quality of prescribing.11 ,17 ,18 The tools are either checklist-based or judgement-based. Examples of checklist-based tools are STOPP (Screening Tool of Older Person's Prescriptions), identifying drugs that should be avoided in certain situations, and START (Screening Tool to Alert doctors to Right Treatment), identifying irrational prescribing omissions.11 Medication Appropriateness Index (MAI)15 is a validated judgement-based tool and includes 10 aspects of appropriateness of prescribing: indication, effectiveness, dosage, correct and practical directions, drug–drug and drug–disease interactions, duplication, duration and costs. These tools have mainly been developed through literature search and expert opinion.11–14 ,19–21 However, the association between inappropriate medication use in older people and poor health outcomes still remains uncertain. The evidence for a link between the tools and clinical outcomes is not convincing for any of them.22–25 In Sweden, as an attempt to improve the quality of prescribing and reduce drug-related morbidity, a number of drugs and drug classes have been recognised as inappropriate to elderly people (Swedish Association of Local Authorities and Regions (SALAR) drugs),16 and there is a national initiative aiming to reduce the prescribing of these drugs with economic reimbursement as incentives. The association between the prescribing of these drugs and negative clinical outcome has not been investigated.
The aim of this study was to construct a tool for estimating risk of revisits to hospital or mortality for older people, incorporating aspects of pharmacotherapy. The secondary aim was to compare the discriminatory ability of this tool, or score, with three validated tools for appropriate prescribing: STOPP, START and MAI and with the SALAR drug list.
Methods
Study participants and data
Patient data from a prospective randomised controlled trial (RCT) were used.22 ,26 The main objective of the RCT was to study the effects of adding a ward-based pharmacist service to the healthcare team on clinical outcomes (number of rehospitalisations; readmissions or emergency department visits) for elderly patients. Four hundred patients, aged 80 years and older and acutely admitted to the internal medicine wards at Uppsala University Hospital, were included and randomised in the control or intervention group. The patients in the intervention group received an enhanced pharmacist service during the hospital admission. All patients were followed for 12 months after hospital discharge, and the number of and time for revisits to hospital and/or mortality was recorded. Each participant gave written informed consent. In this study, the group assignment was not taken into consideration in the analyses.
Outcome variables
A composite variable (combining the event of an unplanned rehospitalisation (emergency department visit or readmission) or death during the 12-month follow-up period) was chosen as the end point for the analysis. The outcome variable in the regression analysis and the goodness-of-fit analysis was the time to the end point from the day of discharge from index admission. The outcome variable in the assessment of discriminatory ability was the occurrence of an event (ie, the end point).
Statistical analyses
Identification of risk factors
Candidate variables were selected based on a combination of clinical judgement and statistical properties of the variables. Clinical and drug variables were included. The selected clinical variables were: gender, age, renal function (estimated glomerular filtration rate (eGFR)), level of social support and medical history (heart failure, diabetes mellitus, pulmonary disease (chronic obstructive pulmonary disease (COPD) or asthma), arrhythmia, malignant disease (past or present), coronary artery disease, cerebral vascular lesion (past), myocardial infarction (past), hypertension and dementia). The drug variables were the patients’ prescribed medications, categorised into groups based on the Anatomical Therapeutic Chemical (ATC) classification system27 and on similar effect and risk in elderly people, or categorised according to the SALAR drug list (SALAR drug list presented in etable 1). In case a SALAR drug variable was the same as an ATC-based category variable, one of them was excluded. The drug variables were also potentially inappropriate medications (identified by STOPP) and potential prescription omissions (identified by START). Variables with less than 10 patients in the smallest group were excluded from further analyses. In order to detect potential redundancies among the variables, a principal component analysis (PCA) was performed. If two variables were collinear, the variable with the most balanced categories were included for further study. The remaining clinical, drug-disease and drug variables were then subject to a backward stepwise Cox regression likelihood-ratio elimination procedure. To minimise type I errors, the p value limit for inclusion was set to 0.01. The set of variables extracted from this analysis, that is, the risk factors, makes up the components of our new score.
Development of point score system
We developed a point score system for risk estimation, the ‘80+ score’, following the Framingham Heart Study approach.28 ,29 First, the continuous independent variable, eGFR, was organised into categories representing different levels of renal function. Reference values were determined for each of these categories. The remaining independent variables were modelled by sets of dichotomous indicator variables. For each variable, a base category was determined (using their most prevalent category). We then calculated how far each category was from the base category by dividing the regression unit for the category by a constant (B) that was common to all variables. The resulting quotient was rounded to the nearest whole number, which was used as the points associated with that category. The point score system is the 80+ score. Last, the risk associated with each level of the score was calculated. For this last step, the following formula was used: risk  where S0(t) was the average 1-year event-free rate, and ∑ βχmean was the sum of the variables’ regression coefficients (β) multiplied with the means or proportions of the variables in the sample (table 1). ∑ βχ was approximated from multiplying the constant for the model (B) with the point score and adding back the base value (ie, the reference value for the base category) for the continuous variable eGFR.
Data used for calculation of point score system
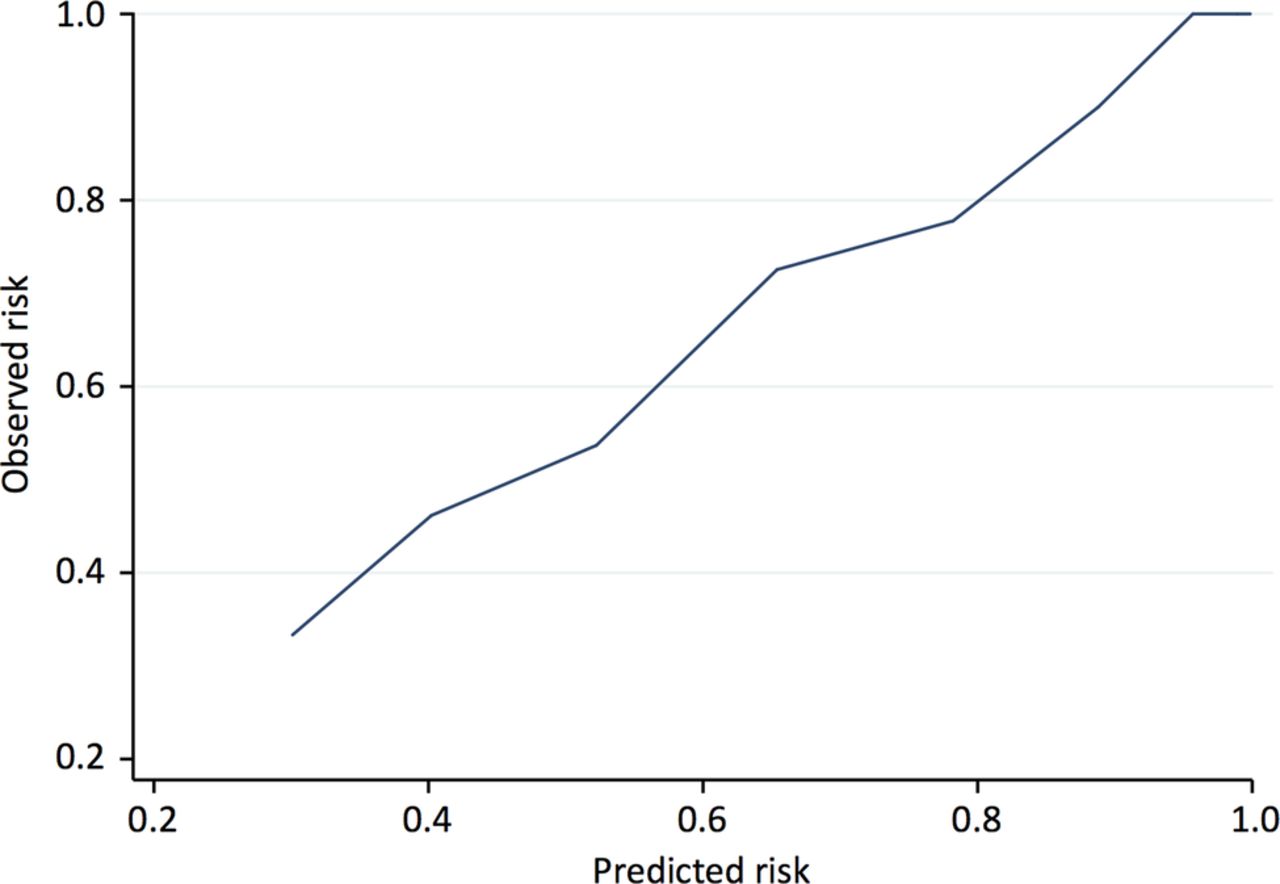
The goodness-of-fit of the 80+ score was assessed by the Grønnesby-Borgan test30 and calibration was assessed by plotting predicted risk versus observed risk. The discriminatory ability of the 80+ score was assessed using C-statistics. C-statistics, which can range from 0.5 (no discrimination) to 1 (perfect discrimination), provides the probability of the model giving a higher predicted risk to the patient that will have an event than the one that will not. We internally validated the score using an enhanced bootstrap with 1000 iterations, in order to quantify and account for the extent of overoptimism in our prediction model.31 We present optimism-corrected C-statistics for the 80+ score. The total STOPP, START and MAI scores and the total number of prescribed SALAR drugs were calculated for each patient. Their discriminatory abilities were also assessed using C-statistics, and these were compared with the C-statistic for the 80+ score.
The effect of the pharmacist intervention was not adjusted for in the regression analyses. The reason for this was that the intervention directly affected the results of the STOPP, START and MAI scores as well as the frequency of prescribing of SALAR drugs and the overall number of drugs. As a sensitivity analysis, the C-statistic for the 80+ score was calculated for the control group patients only. The proportionality of hazards was assessed using Schoenfeld's residuals and by inspecting cumulative incidence curves. We investigated the linearity of the association between eGFR and the outcomes by investigating models also including an ordinal variable for eGFR. Two-way interactions between the final set of variables in the score were investigated as deviations from multiplicativity. The score variables were also tested for the association with mortality only. All analyses were performed in IBM SPSS Statistics V.21 and STATA V.13.
Results
Out of the 400 included and randomised patients in the RCT, 368 were evaluable for further analyses (27 patients died during the index admission and 5 patients wished to be excluded after the randomisation). Table 2 presents baseline characteristics for these patients. Two hundred and fifty (68%) patients had an event (ie, either a revisit to the hospital or death) during the 12 months follow-up period. In the group of patients that had an event, 212 (85%) were rehospitalised and the rest (15%) died.
Baseline characteristics at the time of index hospital admission
Identification of risk factors
eTable 2A, B lists all variables taken into consideration in the analysis. Fourteen clinical variables and 64 drug variables met the inclusion criteria and were subject to the PCA. Three variables were excluded after the PCA: ‘B03B vitamin B12 and folic acid’ (collinear with ‘STOPP h5; long-term opiates in patients with recurrent falls’), ‘G03C oestrogens’ and ‘R03AC drugs for obstructive airway diseases; selective β-2-agonists’ (both collinear with R03B ‘drugs for obstructive airway diseases; anticholinergics +corticosteroids’).
Seventy-five variables were entered into the backward stepwise Cox regression. This procedure resulted in seven statistically significant variables, or risk factors, each having an individual association with the outcome variable. Four of the risk factors were clinical while three were drug-specific. Statistical information about the risk factors is presented in table 3. Past or present malignant disease and presence of pulmonary disease were both associated with an increased risk of rehospitalisation or mortality, as was impaired renal function. Further, living in a nursing home was linked to a higher risk of revisits to the hospital or death than living alone or with a spouse. Being prescribed a drug for peptic ulcer and gastroesophageal reflux disease (GERD) was associated with an increased risk (a vast majority of these prescriptions, 115 out of 120 (96%), were of a proton-pump inhibitor), as well as being prescribed a drug from the opioid class. Having an antidepressant drug (tricyclic antidepressants (TCAs) not included in this variable) was conversely associated with a lower risk.
Statistical information on 80+ score variables
Development of the point score system
Table 1 presents reference values (W and Wref) and regression units of each category of each risk factor variable—data that were used for development of point score. eGFR was organised into four levels of renal function, with >90 mL/min being considered a normal renal function. As reference values for these categories, the midpoints were chosen. For the other risk factor variables, the categories were assigned the value of 0 or 1. A referent risk factor profile was determined: a patient with normal renal function, living alone or with a spouse, without diagnoses for pulmonary disease or malignant disease and with no prescription of drug for peptic ulcer or GERD, no prescription of opioids and no prescription of antidepressant drugs. The constant for the point score system (B) was selected, which was the regression coefficient for the variable ‘drugs for peptic ulcer and GERD’, 0.362. By dividing the regression unit for each category by B, it was computed how far the categories were from the base category. The point scores for each category for each risk factor variable were thus calculated. The point scores for the 80+ score system are presented in the right-hand column in table 1.
The point total is the summated score for each patient. For example, a patient with a renal function of 65 mL/min, living in a nursing home, diagnosed with COPD and prescribed a drug for peptic ulcer and GERD, would be given a point total of 1+1+2+1=5. The estimated risk associated with each point total in the 80+ score is shown in table 4. The estimated risk was computed using the formula described in the methods, where the ∑βχmean was calculated to—0.106842 and the ∑βχ was approximated by multiplying B with the points and adding back the base value for eGFR (−0.012×10⁵ mL/min). An example of risk estimation from the Cox regression as well as from the point score system is illustrated in the online supplementary material.
Estimate of risk for each point total
The goodness-of-fit of the 80+ score was good and is illustrated in figure 1. This was confirmed by the Grønnesby-Borgan test (p=0.49). A model including both an ordinal and a continuous variable for eGFR did not provide a better fit than a model with only the continuous variable (likelihood-ratio test p=0.11). There was some evidence of interactions between eGFR and the drug use variables ‘drugs for peptic ulcer and GERD’ and ‘non-TCA-antidepressants’, but the groups were very small. No deviations from proportionality were observed (all Schoenfeld's test p>0.21).

Predicted risk versus observed risk for rehospitalisation or death.
When tested for their association with mortality only, the variables pulmonary disease, prescription of drug for peptic ulcer and GERD, and prescription of the non-TCA-antidepressant drug were not predictors of this outcome (p>0.05), while the link between social support and this outcome was strong (HR 3.107, 95% CI 2.081 to 4.640). The remaining variables showed similar predictive ability for the mortality outcome as they did for the combined outcome (rehospitalisation and mortality). Results are presented in etable 3.
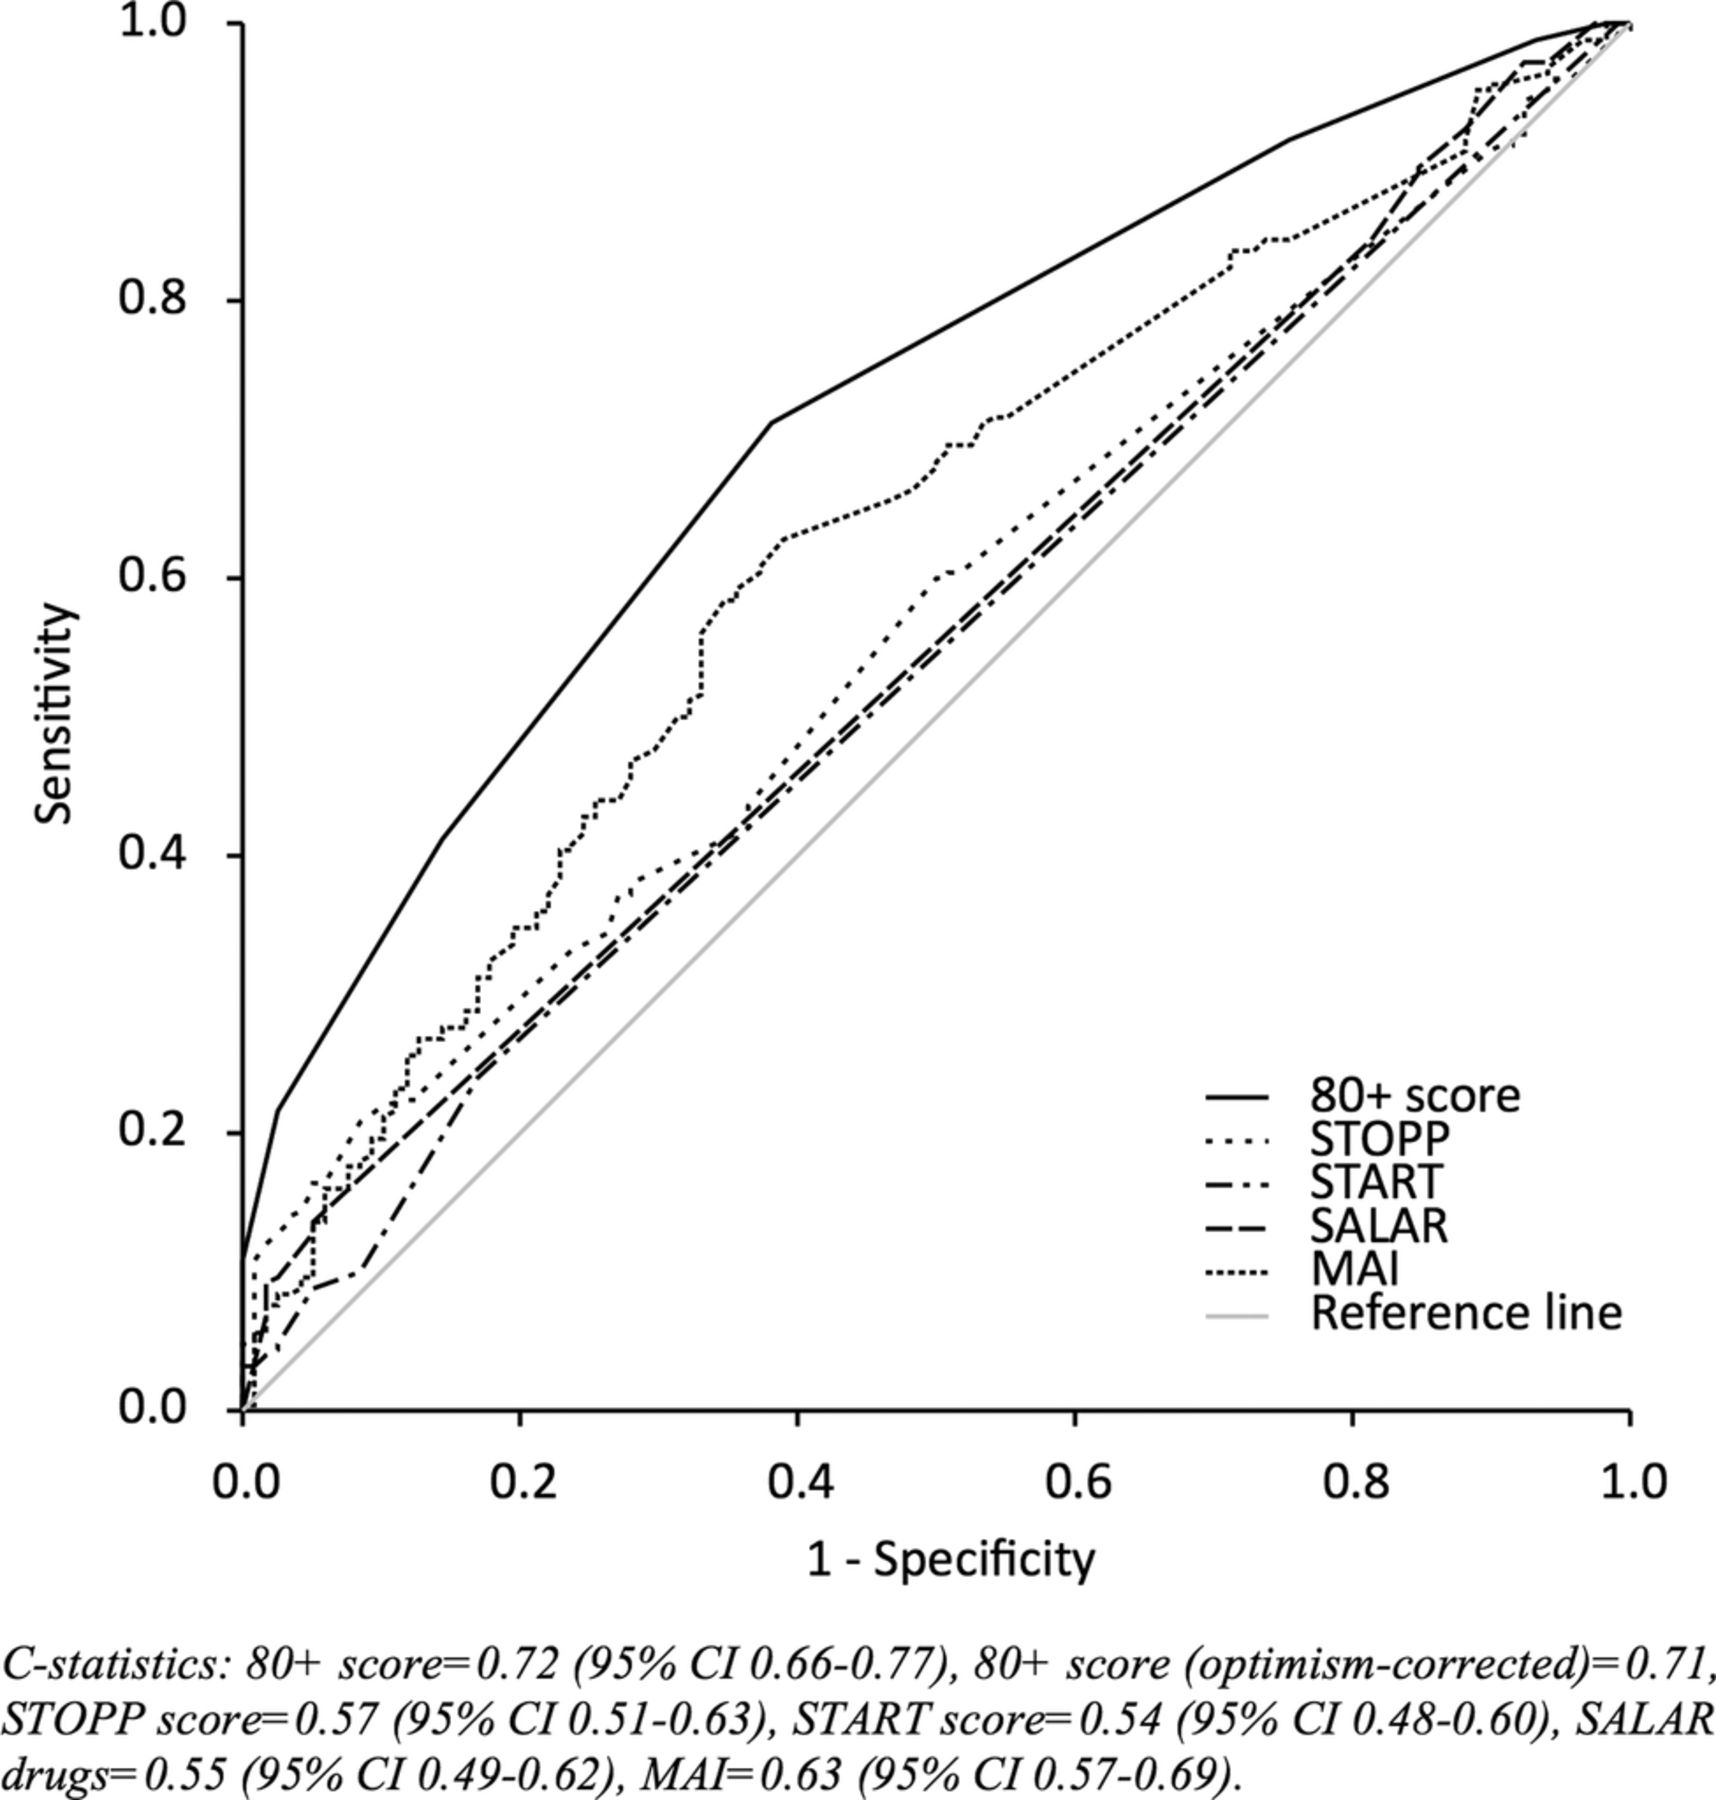
A logistic regression model with the seven variables of the 80+ score as independent variables had a pseudo-R2 of 0.13. The 80+ score demonstrated a satisfying discriminatory ability of the outcome, with a C-statistic of 0.715 (figure 2). The optimism was 0.001, rendering an optimism-corrected C-statistic of 0.714 for the 80+ score. This means that a patient with an event (revisit to the hospital or death) had a 71% probability of being given a higher risk score than a patient with no event. Figure 2 also shows that STOPP and START scores and the SALAR drug list were basically non-discriminating for the chosen outcome (with C-statistics just above 0.5). When tested in the control group only, the 80+ score had a C-statistic of 0.71, which is similar to the value for the group as a whole.

Area under the curve of sensitivity versus 1-specificity for rehospitalisation or death. STOPP, Screening Tool of Older Person's Prescriptions; START, Screening Tool to Alert doctors to Right Treatment; SALAR, Swedish Association of Local Authorities and Regions; MAI, Medication Appropriateness Index.
Discussion
Using a clinical trial database of hospitalised patients, aged 80 years and above, the most relevant factors for identifying those at risk of an adverse outcome were identified. A simple scoring system intended for clinical use was constructed and internally validated, pending validation in an independent cohort. The score is suggested as a tool for identifying patients at highest risk of readmissions and mortality, and ultimately as an aid in clinical decision-making for improving outcomes in these patients. Increasing age, usage of medical services and poor health pose a risk of rehospitalisation and mortality,2 and hence there are strong incentives for focusing on this population.
Various risk factors for rehospitalisation and mortality have previously been identified in prediction models based on data from a variety of populations and settings, and with different candidate variables.32–39 The 80+ risk score has a higher discriminatory ability for risk of rehospitalisation and mortality than most other prediction models of today. This is most likely due to the fact that we included drug variables as candidate variables—the drugs can either be causally related to the outcomes or serve as important proxies for certain conditions, diseases or circumstances. Further, the precision was most likely maximised by developing the score using data from a narrowly defined population—these patients were all aged 80 years or older and had been acutely admitted to an internal medicine ward. In the majority of risk prediction models of today, rehospitalisation has been chosen as the outcome measure, but this carries a high risk of bias due to competing risk by death. Therefore, in this study, event-free (ie, no emergency department visit or readmission) survival was used as the end point.
The use of drugs deemed inappropriate has been associated with adverse drug events40 ,41 and it is often proposed that patients prescribed inappropriate medications should be prioritised for interventions—aimed at improving the quality of prescribing—in order to reduce the risk of unwanted clinical outcomes. However, in this set of patient data, neither the STOPP nor START tools had an ability to discriminate between patients at risk of rehospitalisation or mortality that was better than chance. The numbers of prescribed SALAR drugs showed similar results. MAI, being a judgement-based tool, has a moderate discriminatory ability for risk in this population. However, owing to its time-consuming nature, with assessment times per patient of up to 30 min, MAI is not suitable as a screening tool for patients in clinical practice. As has already been stated, none of the STOPP, START and MAI scores or the SALAR drug system are designed as risk scores. Still, the lack of consistent evidence for their association with clinical outcomes is notable and needs to be further investigated.
Pulmonary disease as well as impaired renal function are known risk factors for readmissions to hospital.32–35 These variables also emerged as risk factors in our population. Many nursing home residents have multiple morbidities and are high consumers of healthcare,42 which explains the prognostic ability of this variable. The unique finding in this study is that three drug variables were individually related to the clinical outcome in the multivariate model: being prescribed a drug for peptic ulcer and GERD or being prescribed an opioid both appeared to increase the risk, while being prescribed an antidepressant drug was associated with a lower risk. The use of proton-pump inhibitors have in several studies been associated with various adverse events, such as Clostridium difficile infections and pneumonia,43 but another explanation for their association with the outcome variable is that the patients being prescribed these drugs have a history of ulcer (which was not among the candidate variables), which is a risk factor itself. This drug group may also function as a proxy for patients with multiple other comorbidities and polypharmacy since these patients have a potential need for preventive treatment for gastric disorders.43 Similarly, opioids can, as well as being a risk drug due to their potential to cause adverse drug reactions, be an indicator for pain or frailty (which are potential risk factors in themselves). The prescribing of non-TCA-antidepressants aims to provide relief from psychological symptoms and increase the patient's general well-being, which supposedly has a protective effect on rehospitalisation and mortality. An alternative explanation for the negative association between this variable and the outcome is that these drugs may be given more often to physically healthier patients with a longer life expectancy. The rationale for exclusion of TCAs in the antidepressant variable is that the safety profile in elderly people for these drugs differs from that of the other antidepressants. TCA drugs were not a candidate variable in the analyses—since only five patients were prescribed these drugs—but were included in the ‘SALAR a’ variable. The strong link between the level of social support and mortality is not surprising since patients often move to nursing homes for the last part of their lives. Interestingly, pulmonary disease or being prescribed a drug for peptic ulcer or GERD or a non-TCA-antidepressant drug was a predictor mainly for rehospitalisation.
A score for risk-identification purposes should have a satisfying predictive ability in the target population, and it should use data that are clinically readily available.1 ,44 The 80+ score meets these criteria. A simple and user-friendly point score system like this can quickly and easily identify high-risk patients. Yet, in order for this information to be useful, translation into suggested actions for reduction of this risk for these patients is crucial. This undertaking is obviously multifactorial. Nevertheless, by focusing on the patients with the highest risk, a pharmaceutical intervention, or other quality improvement effort, can be targeted more efficiently. For example, patients with COPD or asthma may benefit from a comprehensive patient education,45 and patients being prescribed an opioid or a drug for peptic ulcer or GERD may benefit from a thorough medication review.
The 80+ score was internally validated, but remains to be externally validated in another population before it can be generally recommended. A few limitations with this study need attention. Prior hospital visits have in several studies been associated with risk of rehospitalisation.33 ,34 ,36 ,38 ,39 This information was not available in this data set and has therefore not been included as a candidate variable. However, a potential weakness of having prior hospital visits as a variable in a clinical score is that this information may not be easily available on the patient’s admission to hospital. Another limitation is that the 80+ score is based on data from a limited number of patients being admitted to an acute internal medicine ward at one hospital only. This makes the generalisability unknown and increases the need for external validation. Finally, the limited sample size forced us to use the whole data set (both intervention and control group patients) for the development of the score. In this paper, we have discussed the role of prescribed drugs as potential risk factors for adverse clinical outcomes. However, it should be noted that the analyses do not take the potential risks of suboptimal use of drugs into consideration. Suboptimal drug use, such as patient non-adherence to treatment or lack of correct and complete transfer of information when patients are transitioned between different levels of healthcare, can cause adverse drug events and are risk factors of drug-related morbidity.46–48
Conclusion
We have developed and internally validated a score intended for use in clinical practice to identify the hospitalised elderly patients at highest risk of rehospitalisation and mortality, accounting for pharmacotherapy. The score outperforms scores for inappropriate medication use in risk-prediction ability and can ultimately aid in clinical decision-making for improving outcomes in elderly patients.
References
Supplementary materials
Supplementary Data
This web only file has been produced by the BMJ Publishing Group from an electronic file supplied by the author(s) and has not been edited for content.
Files in this Data Supplement:
- Data supplement 1 - Online supplement
Footnotes
-
Contributors AA, JS, MB and HM were involved in study concepts and design. AA, JS, MB, UG, HM and MH-U were involved in acquisition, analysis or interpretation of data. AA and JS were involved in the drafting of the manuscript. AA, HM, MH-U, MB, UG and JS were involved in a critical revision of the manuscript for important intellectual content. AA, JS and MB were involved in statistical analysis. HM and AA obtained funding. HM and UG provided administrative, technical or material support. JS, HM, MH-U and UG were involved in study supervision. AA had full access to all of the data in the study and takes responsibility for the integrity of the data and the accuracy of the data analysis.
-
Funding The study was funded by grants from Uppsala University Hospital.
-
Competing interests None.
-
Ethics approval The study protocol was approved by the Uppsala Regional Ethics Committee (Trial Registration: clinicaltrials.gov Identifier: NCT00661310).
-
Provenance and peer review Not commissioned; externally peer reviewed.
-
Data sharing statement The statistical code and data set are available from the corresponding author.