Article Text

Abstract
Objective The present study aimed to combine observational evidence with randomised controlled trials (RCTs) by using the Bayesian approach.
Data sources Electronic databases, including PubMed, Cochrane Central Register of Controlled Trials (CENTRAL), ISI Web of Science, EMBASE and EBSCO were searched from inception to January 2014.
Study eligibility RCTs and observational studies (OS) investigating the effectiveness of activated protein C (aPC) on mortality reduction were included for analysis.
Participants Patients with sepsis.
Intervention aPC.
Synthesis methods Observational evidence was incorporated into the analysis by using power transformed priors in a Bayesian. Trial sequential analysis was performed to examine changes over time and whether further studies need to be conducted.
Main results a total of 7 RCTs and 12 OS were included for the analysis. There was moderate heterogeneity among included RCTs (I2=48.6%, p=0.07). The pooled OR for mortality from RCTs was 1.00 (95% CI 0.84 to 1.19). In OS, there was potential publication bias as indicated by the funnel plot and the pooled OR for mortality with the use of aPC was 0.67 (95% CI 0.62 to 0.72). The pooled effect sizes of RCTs were changed by using different power transform priors derived from observational evidence. When observational evidence was used at its ‘face value’, the treatment effect of aPC was statistically significant in reducing mortality.
Conclusions while RCT evidence showed no beneficial effect of aPC on sepsis, observational evidence showed a significant treatment effect of aPC. By using power transform priors in Bayesian model, we explicitly demonstrated how RCT evidence could be changed by observational evidence.
Trial registration number The protocol for the current study was registered in PROSPERO (registration number: CRD42014009562).
This is an Open Access article distributed in accordance with the Creative Commons Attribution Non Commercial (CC BY-NC 4.0) license, which permits others to distribute, remix, adapt, build upon this work non-commercially, and license their derivative works on different terms, provided the original work is properly cited and the use is non-commercial. See: http://creativecommons.org/licenses/by-nc/4.0/
Statistics from Altmetric.com
Strengths and limitations of this study
While observational evidence shows a beneficial effect of activated protein C on mortality reduction, randomised controlled trials (RCTs) failed to identify any such treatment effect.
By using power transform priors in a Bayesian model, we explicitly demonstrated how RCT evidence could be changed by observational evidence.
The study employed Bayesian approach to explicitly demonstrate how the result of RCTs can be influenced by observational evidence.
It is still unknown how to discount observational evidence, namely, how to assign a value to the power of prior. The most appropriate prior will vary from study to study.
Introduction
Treatment of sepsis or septic shock is a major challenge for clinicians in the intensive care unit.1 ,2 Many strategies and drugs have been developed for their potential beneficial effects on clinical outcomes. Well-known interventions include the early goal-directed therapy (EGDT) for early resuscitation from septic shock, protective ventilation strategy for sepsis-induced acute lung injury,3 intensive dose renal replacement therapy for sepsis-induced acute kidney injury and activated protein C (aPC) for immunomodulation.4 However, these interventions experienced a wax and wane of enthusiasm for their clinical utility. For instance, the EGDT has been a standard of care for septic shock resuscitation in the first 6 h which, however, is challenged by a recent large randomised controlled trial published in the New England Journal of medicine.5 This randomised controlled trial (RCT) was done 10 years after the original landmark study demonstrating the efficacy of EGDT, so there were substantial differences in other interventions. The same situation occurred in the field of continuous renal replacement therapy (CRRT) dose. In 2000, a landmark study by Ronco et al6 demonstrated mortality reduction in patients treated with high-dose CRRT. However, the study could not be replicated in subsequent mega-trials and systematic reviews.7
aPC is a drug with pleiotropic biological effects and is thought to play an important role in the modulation of inflammatory response.8 Early observational studies (OS), as well as a large RCT, demonstrated remarkable mortality reduction by using this drug.9–11 The well-known PROWESS trial has urged approval of this drug by the Food and Drug administration (FDA) for patients with septic-shock.9 However, the beneficial effects of aPC could not be replicated in subsequent RCTs.12 ,13 Several meta-analyses, including one published in Cochrane library, have consistently refuted the effectiveness of aPC for septic patients. As a result, it was withdrawn from the market.14 ,15 Although RCTs are considered to be the gold standard for testing treatment efficacy, they have limitations. RCTs are often not conducted in ‘real-world’ settings as reflected by the strict inclusion/exclusion criteria, performance in specialised centres and complicated intervention protocol. In contrast, OS are often performed in ‘real-world’ settings where patients enrolled in the studies are treated the same as in clinical practice. Thus, some authors have suggested that OS should be considered in the evidence synthesis, particularly when the intervention or clinical condition is complicated. Our previous analysis also showed that there is significant difference in treatment effect sizes between RCTs and OS.16
In the present study, we performed evidence synthesis by incorporating evidence from OS; the observational evidence was down-weighted by using α ranging from 0 to 1. No prior weighting for observational evidence uses an α of 0. The observational evidence is incorporated at its face value (equal prior weighting) with an α value of 1. Bayesian analysis allowed for such calculation by using observational evidence as the informative prior. The main purpose of the study is to examine how results derived from RCTs can be changed by assigning different degrees of scepticism to observational evidence. Another purpose of the study was to perform trial sequential analysis (TSA) to examine the changes over time and whether further studies need to be conducted, by adjusting significance levels for sparse data and multiple testing on accumulating trials.
Methods
Amendment to the protocol
The study protocol has been published previously and amendment to the protocol was made during data analysis.17 The protocol for the current study was registered in PROSPERO (registration number: CRD42014009562). We explicitly listed the amendment to the protocol.
Quality assessment was not performed in the present analysis because the quality has been well described in a previous Cochrane systematic review.15
Sensitivity analysis by excluding poor quality studies was not performed because the present study was aimed to explicitly display how the evidence derived from RCT could be modified by observational evidence. Sensitivity analysis of this kind belongs to the realm of systematic reviews involving only RCTs.
Searching strategy and study selection
Electronic databases including PubMed, Cochrane Central Register of Controlled Trials (CENTRAL), ISI Web of Science, EMBASE and EBSCO were searched from inception to January 2014. Our core search consists of terms related to aPC and sepsis. References of systematic reviews were reviewed for identifying additional eligible articles.
RCTs and OS investigating the effectiveness of aPC on mortality reduction were included for analysis. OS included: (1) cohort studies using multivariable analysis with aPC treatment as one of the covariates; (2) cohort studies using propensity analysis; (3) case–control studies; (4) prospective as well as retrospective designs were considered eligible.
The following data were extracted from original articles: name of the first author, year of publication, sample size, number of deaths in each arm, total number of participants in each arm, OR of treatment versus non-treatment for mortality, the method used for covariate adjustment (propensity score analysis, logistic regression model) and design of OS (prospective vs retrospective).
Publication bias was assessed using the Egger's regression test and Begg's rank correlation test. Contour-enhanced funnel plot were depicted to visually assess the presence of publication bias.
Statistical analysis
Observational evidence was used as the informative prior in Bayesian analysis. The model involved power transformation of observational data likelihood as proposed by Chen and Ibrahim.18 Full details of calculations and the WinBugs codes were described elsewhere.17 TSA was also performed to quantify the reliability of data in meta-analysis adjusting significance levels for sparse data and multiple testing on accumulating trials.19 Statistical analysis was performed by using WinBUGS (Imperial College & MRC, UK) and Stata V.12.0 (College Station, Texas 77845 USA).
Trial sequential monitoring boundaries were employed to control the risks for type I and II errors, and to indicate whether additional trials are needed. The information size calculation requires the mortality rate in the control group and the minimal effect size for the intervention. We predefined that the mortality in the control group is 30% and the intervention is able to reduce the relative risk by 15%. The conventional α and β are 0.05 and 0.2, respectively. Meta-analysis will be updated by adding component studies sequentially in the order of publication. The β-spending function was constructed to indicate futility of intervention. TSA was performed by using the software TSA V.0.9 β (Copenhagen Trial Unit, 2011).
Results
Our initial search identified a total of 531 distinct citations; 456 of these were excluded immediately after inspection of the title and abstract (figure 1). The remaining 75 clinical studies were potentially eligible and were examined for full text. Fifty-six studies were excluded because: (1) 8 studies used duplicated report; (2) 18 studies used inappropriate control arm (eg, single arm, all patients received aPC); (3) 19 did not report mortality as the end point and (4) 11 did not include aPC as an intervention. As a result, a total of 7 RCTs9 ,12 ,13 ,20–23 and 11 OS10 ,11 ,24–32 were included for the analysis. Characteristics of RCTs are shown in table 1.
Characteristics of included randomised controlled trials
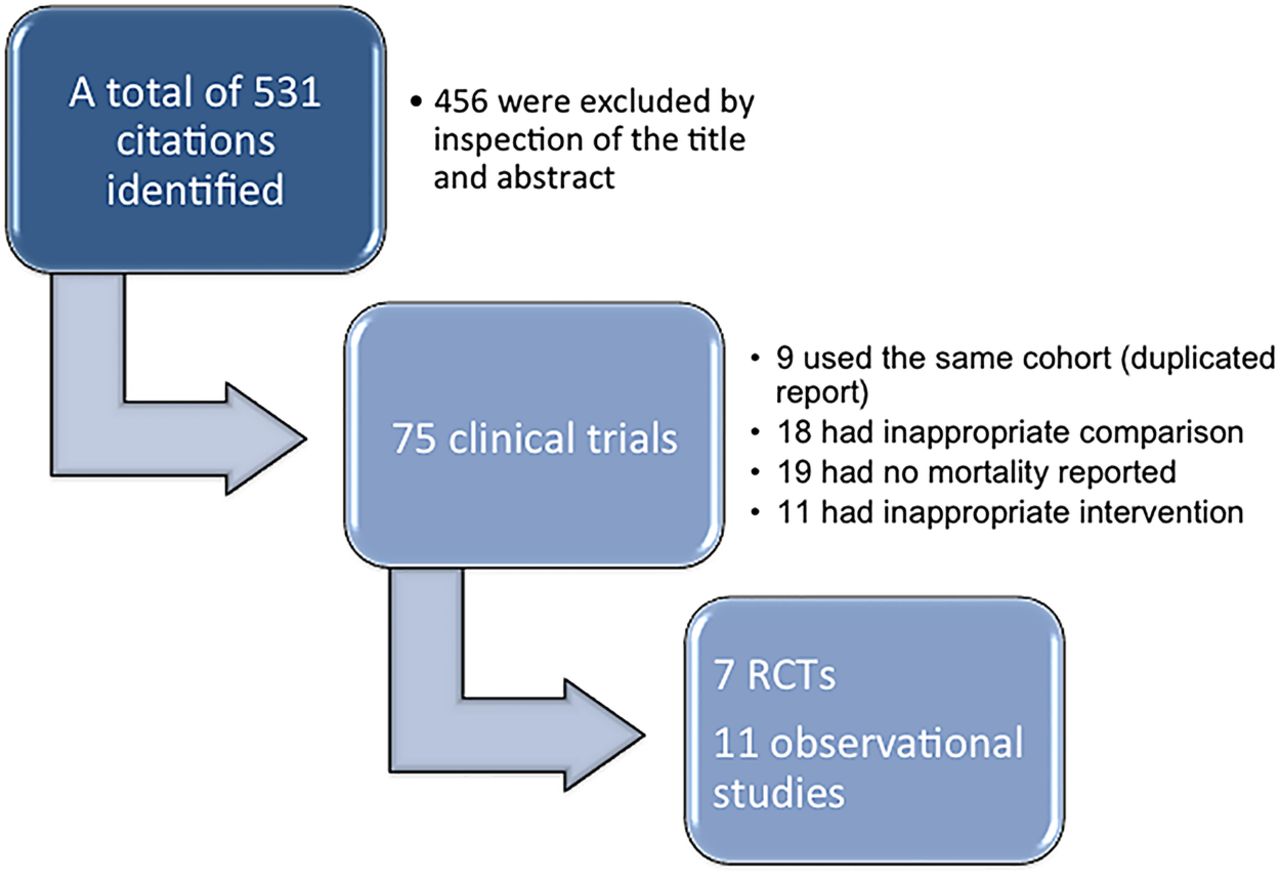
Flow chart of study selection (RCTs, randomised controlled trials).
Figure 2 shows the efficacy of aPC on mortality reduction, reported separately for RCTs and OS. Of the seven RCTs, only the PROWESS study showed significant mortality reduction with aPC (OR=0.74, 95% CI 0.59 to 0.91),9 and the other six studies failed to show a beneficial effect. There was moderate heterogeneity among included RCTs (I2=48.6%, p=0.07). The pooled OR for mortality was 1.00 (95% CI 0.84 to 1.19).
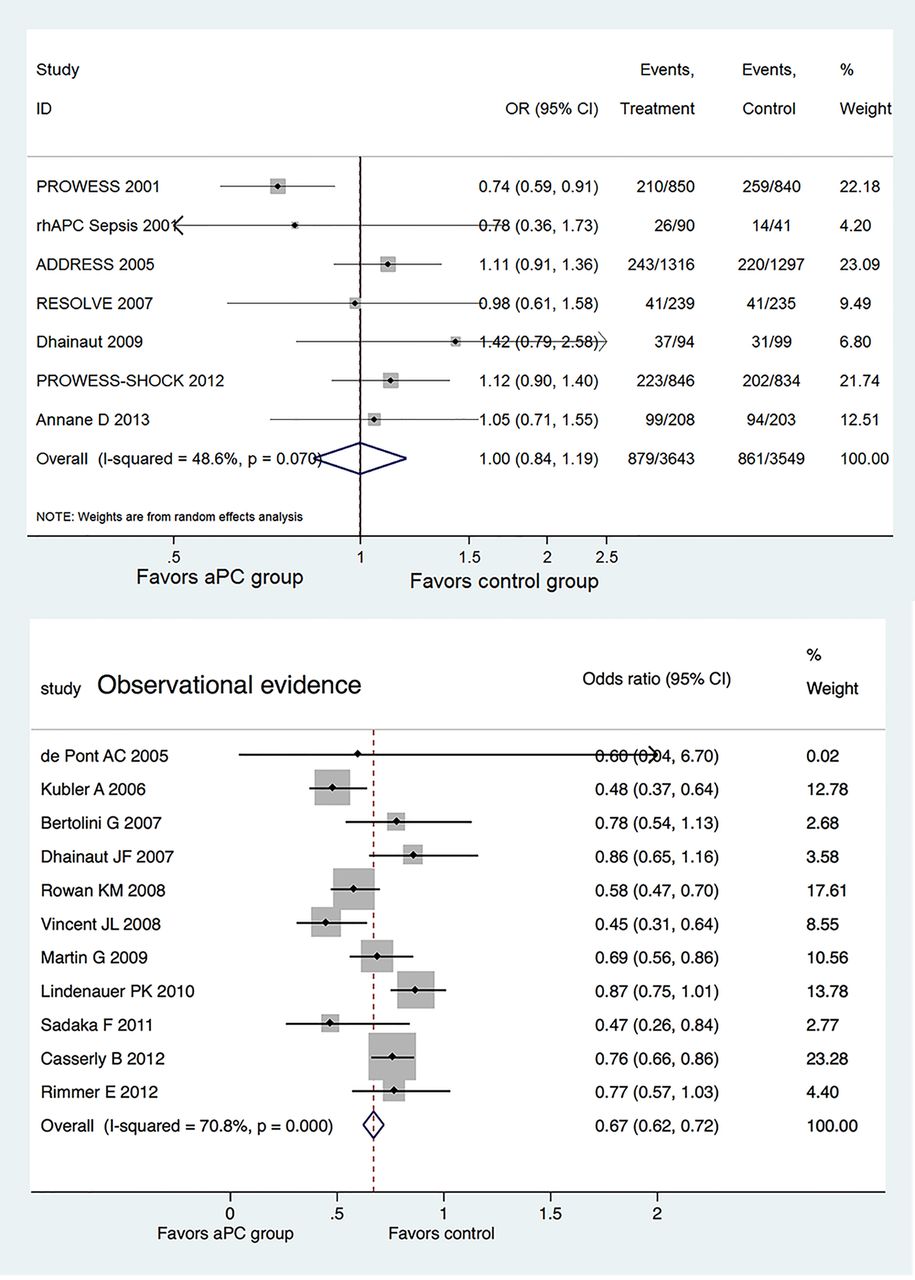
Forest plots showing the efficacy of activated protein C (aPC) on mortality reduction, reported separately for randomised controlled trials and observational studies.
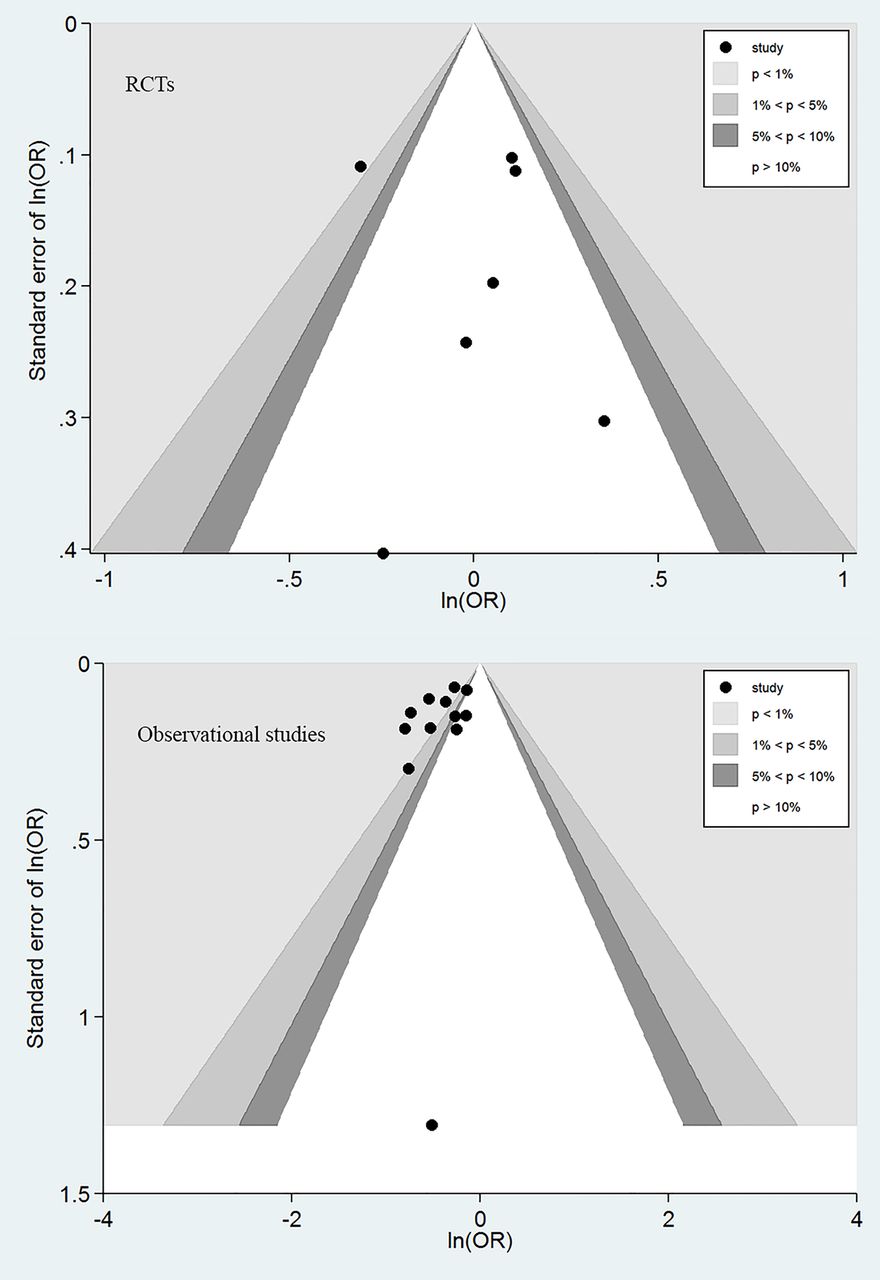
In contrast, 6 of the 11 OS showed significant mortality reduction with the use of aPC; the remaining 5 studies showed a trend towards better lower mortality rate in aPC group. The heterogeneity was statistically significant with an I2 of 70.8% (p<0.001). The pooled OR for mortality with the use of aPC was 0.67 (95% CI 0.62 to 0.72). Egger's test did not show evidence of publication bias in RCTs (p=0.808) and OS (p=0.145). Similarly, Begg's test did not show evidence of publication bias in RCTs (p=0.293) and OS (p=0.337). However, publication bias was suspected for OS as suggested by the funnel plot in which each dot represents a study and these clustered at the upper left corner (figure 3).

Contour funnel plots showing the publication bias in randomised controlled trials (RCTs) and observational studies. Publication bias was identified for observational studies as reflected by the asymmetrically distributed component studies.
The result of the sequential trial analysis is shown in figure 4. Studies were displayed sequentially by their publication year, from left to the right of the horizontal line. After publication of the first and second studies (PROWESS 2001 and rhAPC sepsis 2001), the Z-score crossed the conventional significance boundary (Z=1.96) but did not cross the O'Brien-Fleming boundaries. With the publication of the study Dhainaut et al23, the Z-score reached and crossed the futility line, indicating no effect of the aPC for mortality reduction in septic patients.

Sequential trial analysis involving randomised controlled trials showing that the Z-score crossed the futility line after the study Dhainaut et al.23 Parameters used for the creation of boundaries were—type: two-sided; type 1 error: 5%; α spending: O'Brien-Fleming; information axis: sample size; power: 80%; effect type intervention: relative risk reduction User Defined (15%). The shaded area indicates futility area. aPC, activated protein C.
Meta-analysis of OS was performed by using Bayesian approach. The posterior distribution of individual OR was shrunken, as reflected by the narrower credible interval (CrI) of study level estimates as compared with the observed estimates. For instance, the CrI of OR in the study by de Pont et al24 was 0.40 to 1.06, which was significantly narrower than the observed CI of 0.04 to 6.70 (figure 2). This was because each component study borrowed evidence from the overall effect by using Bayesian approach. The overall OR was 0.67 (CrI 0.56 to 0.78).
Figure 5 shows the mean OR and 95% CrI for different power transformation priors to down-weight observational evidence for the risk of death with aPC. To the left of the figure, when α took negligible values, the observational evidence was totally discounted and the mean OR was 1, which was consistent with the pooled result from RCTs. Increasing weight was assigned to observational evidence with increasing α values. We could see from the figure that the upper limit of CrI crossed the reference line with α values<0.4. When observational evidence was combined at its face value (α=1), the aPC group showed significant mortality reduction as compared with the control group. The α value influenced the precision of prior evidence. As shown in figure 6, the precision of prior increased with increasing value of α from 0.000001 to 1.

Mean OR and 95% credible interval for different power transformation priors to down-weight observational evidence on the risk of death with aPC. Lower values of α down-weight the observational evidence.

Prior distribution derived by discounting observational evidence with α from 0.000001 to 1. The plots show that the precision of prior increases with increasing α values.
Discussion
Key findings of the present analysis are (1) aPC appears to be able to reduce mortality rate when evidence is pooled from OS and the results are consistent by using conventional Bayesian approaches; (2) RCTs failed to identify any beneficial effect of aPC; (3) observational evidence, when discounted by different power transformation priors, can alter the conclusions derived from RCTs and (4) with TSA, the positive result (significant beneficial effect of aPC) as shown in the PROWESS study should be interpreted with caution.
One potential explanation for the positive findings in OS is the publication bias as shown in figure 3. The funnel contour plot showed that most OS were located in the region with p<1%, indicating that the asymmetrical distribution was more likely due to publication bias. It is not surprising that OS are more subject to publication bias as they are less likely to be registered a priori.33 In contrast, RCTs are usually registered and there are many online registration sites.34 OS is usually regarded as less important than RCTs in evidence synthesis and the conventional view is that observational evidence can only serve as hypothesis-generating. In such a context, if the finding of an OS is neutral, it will be less interesting to readers and journals, making it less likely to be published. In contrast, because RCTs are always registered and incur large costs and other resources, studies with negative findings can be published and are equally important to those with positive findings.
aPC for the treatment of sepsis is a good example for illustrating the importance of using sequential trial analysis in evidence synthesis. aPC was approved by the FDA after publication of the PROWESS trial, which seemed to be too hasty when viewed retrospectively. Although the initial trial was positive at conventional significance level of p=0.05 (Z=1.96), its statistical significance should be tested by using adjusted α level. In sequential trial analysis, this is achieved by using the α-spending function and constructing the O'Brien-Fleming boundaries. If sequential trial analysis had been performed at the conclusion of PROWESS trial, the approval of aPC for sepsis would not have been so hasty. It has been argued that the disparity between PROWESS trial and subsequent trials, such as PROWESS-SHOCK, could be explained by the heterogeneity of enrolled patients.35
In the translation of research into clinical practice, there are a lot of important factors to consider. RCT is generally accepted as a gold standard. However, there are some limitations in real clinical practice that RCT cannot simulate in all of the clinical situations. The biggest problem is that RCTs are usually conducted in non-real-world settings, that is, often performed in specialised academic centres with strict inclusion/exclusion criteria. For example, in the Dhainaut et al23 study there was a long list of exclusion criteria, including expected surgical procedures in the next 3 days, platelet count<30 000/nm3, receiving therapeutic heparin, moribund, withdrawn from aggressive management by patients’ family and pregnant or breast feeding. Such strict exclusion criteria would exclude most of the patients with septic shock. Therefore, it appears unfair to treat our patients with septic shock based on evidence derived from a minority of the population. In this situation, OS generally have an advantage in testing the clinical effectiveness of aPC on mortality reduction.36–38 OS usually include a wider range of patients with septic shock and the setting is just like what we will encounter in routine clinical practice. For example, prospective RCTs patients with comorbidities were strictly screened and excluded, but in retrospective studies it is often unreliable to exclude certain comorbidities based on medical records. Therefore, the observational evidence cannot be simply ignored in evidence synthesis for decision-making. However, the result of OS could be misleading due to inherent bias. In our study, the funnel plot showed asymmetrically distributed component studies, indicating potential publication bias. In this regard, the observational evidence should be interpreted with caution and in conjunction with other evidence. Since there was no consensus on how to combine observational evidence with RCTs, we discounted observational evidence with power transform priors taking advantage of the flexibility in Bayesian modelling.18 In this model, we found that the treatment effect of aPC increased with more weight assigning to observational evidence (figure 6). A value of 0 for α implies that the observational evidence is ignored, and a value of 1 for α means that observational evidence is accepted at its ‘face value’. This approach gives a full picture of how pooled evidence can be altered by OS, by explicitly showing the power transform priors.
Several limitations of the study need to be acknowledged. First, there exists substantial heterogeneity among included RCTs which may be explained by the differences in study population, timing of intervention and definition of the study's end point. As expected, OS showed substantial heterogeneity. Considering the extremely different study criteria and the various geographical sources of each OS (representing different standards of care), heterogeneity should be expected due to the more generalisable (real-world) evidence. Second, it is still largely unknown on how to discount the observational evidence. The most appropriate prior will vary from study to study. The present study only displays a wide range of possible α values and explicitly demonstrates how RCT evidence can be modified by observational evidence.
In summary, our study demonstrates that there is considerable disparity between observational and RCT evidence. While observational evidence shows beneficial effect of aPC on mortality reduction, RCTs failed to identify any such treatment effect.
References
Footnotes
Funding This research received no specific grant from any funding agency in the public, commercial or not-for-profit sectors.
Competing interests None.
Provenance and peer review Not commissioned; externally peer reviewed.
Data sharing statement Extra data can be accessed via the Dryad data repository at http://dx.doi.org/10.5061/dryad.54h87.