Article Text

Abstract
Objectives To estimate and quantify childhood mortality, its spatial correlates and the impact of potential correlates using recent census data from three sub-Saharan African countries (Rwanda, Senegal and Uganda), where evidence is lacking.
Design Cross-sectional.
Setting Nation-wide census samples from three African countries participating in the 2010 African Census round. All three countries have conducted recent censuses and have information on mortality of children under 5 years.
Participants 111 288 children under the age of 5 years in three countries.
Primary and secondary outcome measures Under-five mortality was assessed alongside potential correlates including geographical location (where children live), and environmental, bio-demographic and socioeconomic variables.
Results Multivariate analysis indicates that in all three countries the overall risk of child death in the first 5 years of life has decreased in recent years (Rwanda: HR=0.04, 95% CI 0.02 to 0.09; Senegal: HR=0.02 (95% CI 0.02 to 0.05); Uganda: HR=0.011 (95% CI 0.006 to 0.018). In Rwanda, lower deaths were associated with living in urban areas (0.79, 0.73, 0.83), children with living mother (HR=0.16, 95% CI 0.15 to 0.17) or living father (HR=0.38, 95% CI 0.36 to 0.39). Higher death was associated with male children (HR=1.06, 95% CI 1.02 to 1.08) and Christian children (HR=1.14, 95% CI 1.05 to 1.27). Children less than 1 year were associated with higher risk of death compared to older children in the three countries. Also, there were significant spatial variations showing inequalities in children mortality by geographic location. In Uganda, for example, areas of high risk are in the south-west and north-west and Kampala district showed a significantly reduced risk.
Conclusions We provide clear evidence of considerable geographical variation of under-five mortality which is unexplained by factors considered in the data. The resulting under-five mortality maps can be used as a practical tool for monitoring progress within countries for the Millennium Development Goal 4 to reduce under-five mortality in half by 2015.
This is an open-access article distributed under the terms of the Creative Commons Attribution Non-commercial License, which permits use, distribution, and reproduction in any medium, provided the original work is properly cited, the use is non commercial and is otherwise in compliance with the license. See: http://creativecommons.org/licenses/by-nc/2.0/ and http://creativecommons.org/licenses/by-nc/2.0/legalcode.
Statistics from Altmetric.com
Article summary
Article focus
-
Census and household data contain small-area geographical information, such as the residence of a child at the time of death. The impact of such spatial effects on mortality is of substantive interest.
-
Mortality data in the census and household are also subject to recall bias and heaping effects. The event of deaths is also censored at the time of the survey. We use recent statistical techniques to account for the survival nature of the data in the analysis.
-
We use data from recent census/household data from three sub-Saharan Africa (Rwanda, Senegal and Uganda) to investigate the importance of country-specific geographical factors on under-five mortality.
Key messages
-
Our results provide clear evidence of considerable geographical inequalities of under-five mortality that is unexplained by socio-economic factors considered in the data.
-
Our findings indicate that public health interventions and health promotion to reduce under-five mortality, should take into account both individual and area variation to account for the diversity of settings.
-
Planning and intervention measures could have different outcomes in terms of effectiveness in areas with a high degree of variability. Homogeneous policy intervention strategies may not give the required outcomes as suggested by large significant inequalities in of under-five mortality within and between countries in our study.
Strengths and limitations of this study
-
Our study seems the only one that has attempted to investigate geographical inequalities of under-five mortality beyond individual and household factors using merged census and household data from sub-Saharan Africa countries.
-
The major strength is the use of census and nationally representative household survey to investigate and explain district-level inequalities in under-five mortality using a novel approach that accounts simultaneously for individual, household and area factors.
-
The major limitation of this study is the cross-sectional nature of the data, which does not permit one to draw causal association between under-five mortality and the associated spatial effects including individual and household factors.
Introduction
There have been considerable gains in child survival in the world over the past 10 years. Recent reports on the ‘State of the World's Children’ indicate an overall decline in child mortality from 100/1000 children in 1999 to 72/1000 children in 2010.1 A number of countries in North Africa, Eastern Europe, south-east Asia and Latin America have reduced under-five child mortality by half in the period between 1990 and 2010.1 In contrast, countries in sub-Saharan Africa (SSA) have remarkably high rates and were ranked the top worst performers in reduction of child mortality, with very few making progress and the majority experiencing no change or a reversal in gains made some 10 or so years previously. In Ethiopia, Malawi and Namibia the decline in under-five child mortality has been substantial despite meagre resources, while in other SSA countries it has remained the same. A case in point is DR Congo which posted an under-five mortality of 199/1000 children in 1999 and the same again in 2009. In countries such as Chad, there has been an increase from 201/1000 children born in 1999 to 209/1000 children in 2009. In short, even with known solutions and international assistance, the transition from high mortality to low mortality is highly uneven in the SSA region.
Several studies have shown that child survival in the first 5 years of life is influenced by a myriad of risk factors. For instance, Becher et al2 quantified the effect of risk factors for childhood mortality in a typical rural setting of Burkina Faso. They performed a survival analysis of births within a population from a demographic surveillance system in 39 villages. In another study in rural Tanzania, Armstrong-Schellenberg et al3 conducted a community-based nested case–control study of postneonatal deaths in children under 5 years, in which they investigated demographic and socio-economic factors, health-seeking behaviour, the household environment including accessibility to healthcare and individual child care factors. A similar population-based case–control study was carried out to investigate potential risk factors for postneonatal and child mortality in northern Ghana.4 Child mortality demonstrated gender-based disparities,5 varied with socio-economic inequalities2 and was influenced by variation in coverage of interventions.4 At times, living in either urban or rural areas can disadvantage under-five children's health.6 The general picture is that major causes of childhood mortality, summarised as disease and malnutrition, are exacerbated by socio-economic differences and varied intervention coverage,7 and these risk factors apply at both individual and community levels.8
Many of these studies have been conducted at subnational or national level. Our search showed that relatively few studies have considered between country or cross-national analyses of childhood health and associated determinants. Magadi8 examined the risk factors of malnutrition among children whose mothers are infected with HIV in SSA. She applied a multilevel logistic regression to the Demographic and Health Survey (DHS) data from 18 countries for the period 2003–2008. Another across-countries study was conducted by Kandala et al9 in which they considered geographical and socio-economic determinants of child undernutrition in Malawi, Zambia and Tanzania. This identified regional patterns which transcend national boundaries. In a similar study, Sherbinin10 reported on biophysical and geographical correlates of child malnutrition in Africa. Wang,11 using data from 60 countries, explored the global pattern of child mortality and investigated the determinants both at national and subnational level.
While tackling the issue of determinants of child mortality, it is common that sample survey data have been used. Only a few studies have considered census data, mostly to analyse demographic indicators such as fertility, yet with very limited statistical modelling of childhood mortality.12 Census data provide a large cross-sectional database that would allow investigation of the association between mortality or health outcomes and risk factors. Because census data are a complete enumeration of all individuals in a country, the statistical analysis is likely to have more power than data derived from a survey. Further the censuses provide a picture of the country at any given time, therefore allowing a better understanding of risk factors, critical in explaining variations and crucial for implementing interventions in child mortality, thus.
Overview of the analysis of mortality data
A number of statistical models have been proposed when analysing the risk of child mortality in the first 5 years of life and its determinants. Most popular have been logistic regression models which assume child survival as a binary response (either the child lived beyond 5 years or died before the fifth birthday). In such models one estimates the probability of a child surviving and can include risk factors. The coefficients of risk factors can be interpreted as ORs. These models, nevertheless, ignore the time to event (death), and therefore fail to capture exposure to the risk of dying or conceal the evolution of the subject's state over time.13 More appropriately, survival models can be used to analyse the hazards of child survival. Both logistic and survival analysis can be implemented within the basic generalised linear models (GLM) framework.
Research on survival analysis in demography and related fields has increased since the seminal work by Cox in the 1970s,14 with application in child mortality or survival appearing in the 1990s and 2000s,15–17 involving both standard proportional hazard models12 and complex models.18 Precursor to the use of Cox regression, life tables have been used to estimate the probabilities of survival of a given cohort.19 The Cox regression and recent modern survival techniques, in contrast, permit effects of risk factors (determinants) to be estimated, which is critical for designing interventions. Cox and other survival regression models have other advantages including analysis of censored and truncated response data, and time-varying effects.20
Two important extensions in survival regression models that have received considerable attention recently are the inclusion of random effects and flexible modelling through semiparametric and nonparametric approach.21 Such analyses have an added advantage compared to ordinary GLM. Models that incorporate random effects are commonly called generalised linear mixed models (GLMM), and those that account for non-linearity are referred to as generalised additive models (GAM) and when extended to include random effects they are known as generalised additive mixed models (GAMM).
The inclusion of random effects permits modelling of unmeasured and unobserved contextual factors in the models. These may act at family, community, district, regional or national levels since the underlying causes of neonatal mortality are multisectoral and interwoven.8 ,17 Those operating at individual, family, community and regional levels can have a direct or intermediary effect on the outcome. Regionally, expenditure on health services and cultural differences can also affect the survival status of children. In survival models, unobserved factors are considered as frailties, which adjust for hierarchical clustering of survival data. In essence, frailties are group specific factors acting on child survival, which together with individual factors may protect or accelerate death.22 Studies on child mortality by Sastry15 employed nested frailty models to analyse child survival data clustered at community and family levels. Another study by Bolstad and Manda16 showed significant heterogeneity at community level, which can be attributed to differential availability of resources at community level.
Recent studies have assumed that such unobserved factors vary spatially to give spatial frailty survival models. Banerjee et al23 developed parametric frailty specifications based on both areal (lattice) and on point-referenced (geostatistical) spatial models, and compared them with traditional independent and identically distributed frailty and non-frailty approaches under a Weibull baseline hazard function in the context of county-level infant mortality data. Bastos and Gamerman24 used a dynamic survival model with spatial frailty to handle time-varying covariates in the presence of spatial effects. In another study, Li and Ryan25 used a semiparametric frailty model to analyse spatial survival models. In the above studies, a single modelling framework was used to model the spatial and time-varying effects simultaneously. Moreover, some of the risk factors may be geographically varying, leading child mortality to vary in space,6 ,18 ,26 with well documented space–time interactions.27 In another study, Kandala et al9 applied a geo-additive model where spatial, non-linear and fixed effects were simultaneously modelled in a single framework. Again, none of these considered the census data.
The main objective of this study is to analyse small-scale geographical variability in under-five mortality in the sub-Saharan region, by applying existing spatial statistical methodology. Our aim is to extend the standard Cox regression model to a random-effects model to permit spatial clustering and heterogeneity using census data from a number of countries. Specifically, we apply GLMM with spatially correlated random effects proposed by Hennerfeind et al,20 and used it to analyse factors associated with child survival in the first 5 years of life. This modelling approach falls within a group termed structured additive regression (STAR) models, introduced by Kamman and Wand.28 STAR models are a comprehensive class of models which permit simultaneous estimation of nonlinear effects of continuous covariates, with both spatially unstructured and structured components, together with the usual fixed effects in the predictor.29
The spatial analysis can be approached in various ways, one based on the stationary Gaussian random fields, which applies when the place of residence is known exactly, given by geographical x−y coordinates, and the principle originates from geostatistics.23 These can also be interpreted as two-dimensional surface smoothers based on radial basis functions, and have been employed by Kammann and Wand28 to model the spatial component in Gaussian regression models. Another option is to use two-dimensional P-splines described in more detail in Brezger et al.30 The advantage of these approaches is that they allow prediction of risk for locations where there are no data, thus allowing us to quantify small-scale variability. If observations are aggregated in geographical regions, spatial effects can be estimated using the Markov random field (MRF) approach, widely used in disease mapping.23 Modelling and inference can use a fully Bayesian approach. However, the empirical Bayesian approach via penalised likelihood techniques is also possible.29
A detailed description of the statistical methodology used is in the appendix. In this study, we provide simulation studies and apply these techniques to the 2000–2010 Census data from selected SSA countries whose under-five death rates are at relatively similar ranking. Rwanda and Uganda are ranked 31st and 27th in the world respectively with regard to improvement in under-five mortality, while Senegal is ranked at 42nd. Rwanda and Uganda have an estimated under-five mortality of 91 and 99/1000 live births respectively, as of 2010, reduced from 163 and 175/1000, respectively, estimated in 1990. Senegal has a rate of 75, estimate of 2010 compared to 139, estimated in 1990. Infant mortality rates, estimated at 2010, are 59, 63 and 50 for Rwanda, Uganda and Senegal, respectively. More details on child survival can be found at UNICEF.1
Data and methods
Data
Data were analysed from three countries, Rwanda, Uganda and Senegal purposively selected because relevant census variables were available to carry out survival analyses for the first 5 years of life (under-five mortality: 5q0).
For Rwanda, we analysed census 2001 data, while for Uganda and Senegal we used data from the 2002 round of the census. For all countries, data analysed were limited to an approximate 1% random sample of the census data, mainly due the complexity of the models fitted. Total samples considered were 44 000 for Rwanda, 33 500 for Senegal and 33 400 for Uganda. While the censuses have limited numbers of variables, each child record, derived from self-reported information given by the household head, consisted of age at time of death, and whether a child was alive or dead at the time of census, as well as other covariates which may influence child mortality. Our analysis was restricted to children below the age of 5 years. Since no information was available as to whether the child was alive at the census prior to the current enumeration, the survival information was right-censored. Factors influencing child mortality varied from country to country, and questions were not uniform across the three countries. To enable comparability of the results we selected similar covariates. We considered the following individual socio-demographic variables in the analysis as determinants of child mortality: region and place of residence, education level of mother, occupation of father, number of under-five children in household, whether the previous child died, whether the father or mother was alive, and ownership of dwelling unit. We constructed two indices: (1) shelter, for the following characteristics: specifically the type of dwelling unit (permanent, semipermanent, traditional), type of roof, wall and floor and type of toilet; (2) electronics for the following electronic assets: radio, cell phone, television, phone, iron and fridge. For spatial analysis, we used provinces and districts as units of analysis. Table 1 gives a summary of the variables used.
Summary of selected covariates used in the model
Statistical analysis
We examined spatial variation in under-five mortality with a flexible geo-additive semiparametric mixed model while simultaneously controlling for spatial dependence and possibly non-linear effects of covariates within a simultaneous, coherent regression framework. Individual data records were constructed for children in each country.
A more general spatial Cox regression model, according to Hennerfeind et al20 which captures a wide range of issues including spatial frailties was adapted and applied to determine factors associated with the risk of early childhood mortality. We applied a fully Bayesian approach based on Markov priors and using Markov Chain Monte Carlo (MCMC) techniques for inference and model checking. For model choice, we used the Deviance Information Criterion (DIC) developed as a measure of fit and model complexity.
The analysis was carried out using V.1.4 of the BayesX software package,30 which permits Bayesian inference based on MCMC simulation techniques. For all models, 25 000 iterations were run with the initial 5 000 discarded and every 20th sample stored to give a final sample of 1 000 for parameter estimation. Convergence was evaluated by inspecting trace and autocorrelation plots of samples for each chain, as well as through numerical summaries such as the  diagnostic statistic of Brooks and Gelman.31After 5000 iterations, all parameters showed signs of convergence in the trace plots. The values of
  also quickly approached 1 and were all below the value of 1.12, which indicated convergence of both pooled and within-interval widths to stability. Statistical methods have also been discussed in more detail in the appendix.
Results
Table 1 gives a summary of the selected covariates across the three countries. There are evident disparities by place of residence for all three countries, with rural children slightly disadvantaged in mortality. The same picture was observed by age, with children less than 1 year disadvantaged compared to older children, with the proportion dying diminishing with increasing age. Children without a living mother or father were likely to die in their first 5 years of life. However, there was no clear pattern in relation to the shelter or electronics indices, or with religion or sex of the child. Similar results were obtained in the bivariate analyses presented in tables 3, 4, 5.
Fixed effects for Rwanda child survival
Fixed effects for Senegal child survival
Fixed effects for Uganda child survival
In table 2, model selection values are given for the discrete-time survival models with different specifications of the covariates for the three countries. For all the three datasets the models which combined fixed and random effects were better than those that did not combine effects, indicating the importance of both sets of factors at explaining child survival. For Rwanda data, the best model was model M3b, which combines fixed effects at individual and household levels and random effects at district and provincial levels. The DIC for model M3b was 7756.1 compared to the nearest model, M1b, with DIC=10240.3. Moving to Senegal data, again the model that combined fixed and random effects produced the best fit (model M3b). Model M3b had a DIC=14711.1 which is smaller compared to model M3a (DIC=15361.5; table 2). Similar results are obtained for the Uganda data with model M3b emerging as best fit, although model M2d was indistinguishable (see table 2).
Tables 3, 4, 5 present estimates of fixed risk factors resulting from the models with the best fit. For Rwanda (table 3), there was an overall decrease of risk of a child dying in the first 5 years of life (HR=0.04, 95% CI 0.02 to 0.09). Children in urban areas were less likely to die than those in rural areas (HR=0.79, 95% CI 0.73 to 0.83). The relationship of child dying and household electronic assets was nonlinear. At level 2 compared to level 1, the risk was higher with HR=1.29 (95% CI 1.16 to 1.51), while at level 3 we observed a lower risk with HR=0.64 (95% CI 0.46 to 0.89) and this is reversed at level 4 with HR=1.31, 95% CI: 1.16 to 1.51. For the shelter index, the risk was reduced at lower levels and increased at higher levels of the index, although this relationship was not significant at p<0.05. It is interesting to note that a child with a living mother and father had a reduced risk of dying (table 3). Children up to 1 year of age were at increased hazard relative to those aged 5 years or older. At less than 1 year of age the log hazard was 0.77 (95% CI: 0.71 to 0.83), while at 1 year the log hazard was 0.48 (95%CI 0.42 to 0.55). As age increased, the hazard reduced. For example, those aged 2–4 years the log hazard was −0.02, −0.22 and −0.46, respectively.
Model comparison values based on Deviance Information Criterion (DIC) for the models
The spatial variability of risk of dying is shown in figure 1, with log hazard ranging between −8.23 and 3.14. There were a number of areas that were associated with increased risk of death compared to the overall mean. These areas are identified by the right map, with a white colour and appear in the south, west and at the centre of the country. There are also areas of reduced risk shown by a black colour.
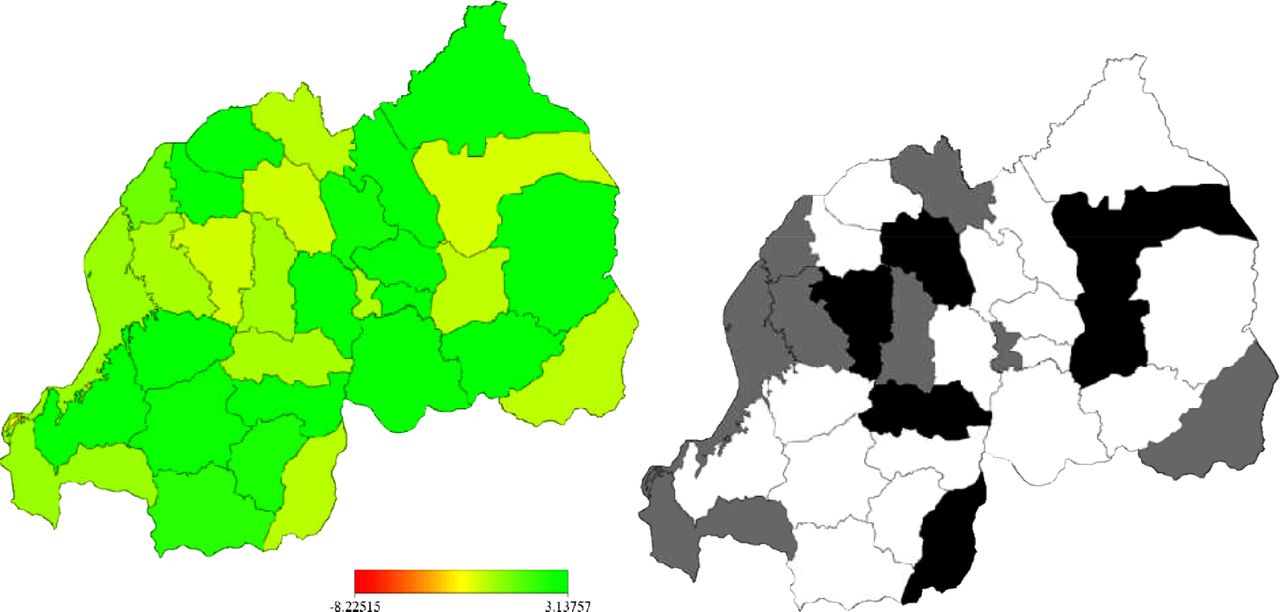
Left: structured spatial effects, at district level in Rwanda, of child surviva (model M3b). Shown are the posterior means. Right: corresponding posterior probabilities at 80% nominal level, white denotes region regions with strictly positive credible intervals, black denotes regions with strictly positive credible intervals and grey depicts regions of non-significant effects.
In table 4 we present results for Senegal. Overall the risk of death decreases with HR=0.024 (95% CI: 0.015 to 0.045). The risk significantly varied with ownership of dwelling unit, electronic assets, sex and age of the child. Ownership of a dwelling unit was associated with increased risk (HR=1.19, 95%CI 1.09 to 1.28) compared to those households without a dwelling unit. Male children were more likely to survive the first 5 years compared to female children (HR=0.88, 95% CI 0.85 to 0.91). The risk of dying was positively associated with all ages, however, this risk decreased with age, ranging from 2.48 at age less that 1 year to 1.13 at age of 4 compared to those aged 5 years or more. For ownership of electronic assets, the risk was higher for those at the lowest level (level 1) and decreased with increasing electronic assets, although the relationship was marginally significant at p<0.1 for levels 2, 3 and 4(results not shown). Nevertheless, the results were significant, at p<0.05 for the level 5 category when compared with those at level 1 (HR=0.93, 95% CI 0.87 to 0.99). Turning to the spatial distribution of risk in figure 2, there was substantial variation, with estimates of log hazard ranging from −3.44 to 5.87 (left map). The right map defined areas associated with significantly high risk (shaded white) as well as those of significantly low risk (black shading). We could not identify a clear pattern to the risk by region.
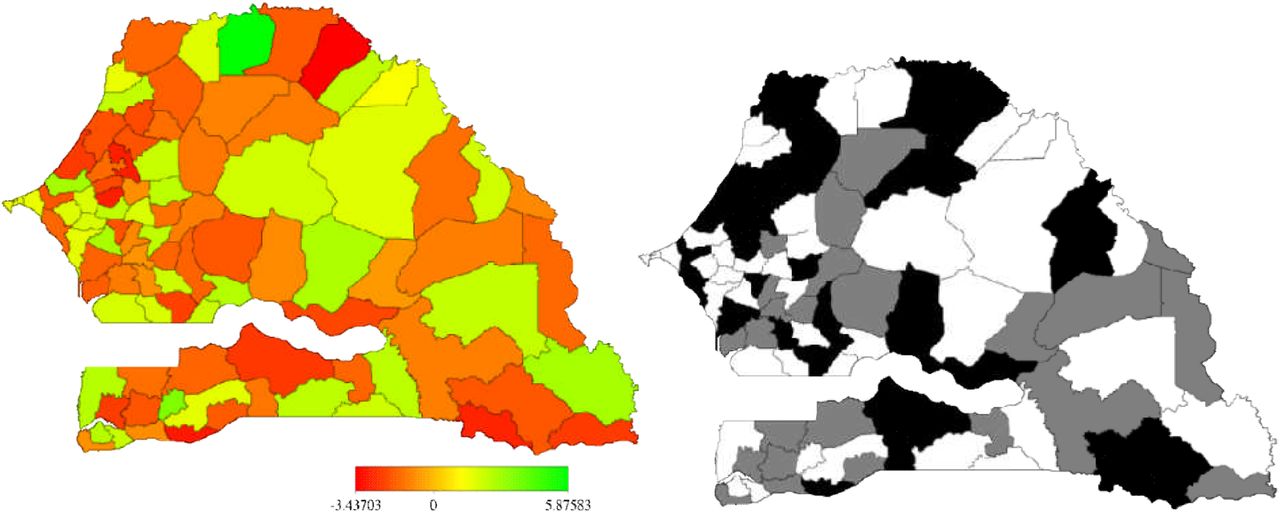
Left: unstructured spatial effects, at district level in Senegal, of child survival (model M3b). Shown are the posterior means. Right: corresponding posterior probabilities at 80% nominal level, white denotes regions with strictly negative credible intervals, black denotes regions with strictly positive credible intervals and grey depicts regions of nonsignificant effects.
Results for Ugandan data are given in table 5. Again the overall risk of death decreases (HR=0.011, 95% CI 0.006 to 0.017). Risk factors associated with under-five mortality were identified to be number of under-five children in the household, marital status, education level of mother, ownership of electronic assets and shelter characteristics. Families with fewer under-five children predisposed children to a high mortality risk compared to those with 4 or more children (HR=4.18, 95% CI 2.92 to 5.81), while those with 1–3 children had a reduced risk (HR=0.54, 95% CI 0.39 to 0.73). Being married also appeared to confer increased risk of a child dying compared to those with children of single mothers (HR=2.10, 95% CI 1.78 to 2.42). Our results showed that education level of the mother matters when it comes to child survival. Children with mothers who had no formal education or only lower primary education were more likely to die than those with tertiary education (HR=1.48, 95% CI 1.28 to 1.70 and 1.21, 95% CI 1.05 to 1.45, respectively).For those with secondary education, the risk was lower relative to those with tertiary education (HR=0.57, 95% CI 0.36 to 0.81). In relation to electronic assets, the risk was non-linear with increasing risk at level 2, reduced risk at level 3 and increased risk again at levels 4 and 5, compared to level 1 (table 5). We observed that the risk was lower at levels 2 and 3 of the shelter index and increased at level 4 and 5 relative to level 1. Nevertheless, the only significant difference was observed at levels 3 and 4 (1.32 and 1.12, respectively).
The geographical variation in risk is shown in figure 3. Estimates ranged from −0.61 (low risk) to 0.73 (high risk). See left plot. However, the significance map (right map) indicates that areas of high risk are in the south-west and north-west while those of low risk are in the north-east and centre-east. Notably Kampala district showed a significantly reduced risk.

Left: structured spatial effects, at district level in Uganda, of child survival (model M3b). Shown are the posterior means. Right: corresponding posterior probabilities at 80% nominal level, white denotes regions with strictly negative credible intervals, black denotes regions with strictly positive credible intervals and grey depicts regions of non-significant effects.
The unstructured spatial effects at provincial level were also fitted. Figure 4 shows caterpillar plots for the three countries at province and county level. No single province or county residual was significantly above or below zero indicating no difference in risk of death between provinces or counties in the three countries. However, there was clear variation in the risk of death, for example, in Rwanda there are four provinces with an estimated lower risk of death while six provinces have an estimated risk in the higher direction. For Senegal, there were four provinces with a reduced risk, and eight with estimated high risk. In Uganda, about a 100 counties were estimated to have a lower risk of child mortality, while another 70 had a high risk (figure 4).

Left: unstructured spatial effects, at province level in Rwanda and Senegal and at county level in Uganda, of child survival (model M3b). Shown are the posterior means and corresponding error bars at probabilities at 80% nominal level.
Discussion and conclusion
The central question of this study was to identify risk factors associated with child mortality, which go beyond individual factors, and extending to include other factors such as the geographic location. These factors were assumed to be best captured by assuming spatially varying processes. In doing so, we applied a novel Bayesian framework which permitted estimation of risk at individual, household and area level in a unified framework.
Our modelling approach can be considered as an extension of the generalised linear model and can be classified as a spatial generalised linear model. These types of models have a complex structure, which is easily exploited using the Bayesian approach.
Despite the complexity of our approach the results obtained from our approach are consistent with what has been reported previously. For instance, the decreased risk of mortality by age is well established in SSA.6 ,16 However, we found that the degree of association of various factors varied by country. We also observed a rural-urban divide in under-five mortality, with rural children more likely to die in the first 5 years than their urban counterparts.
The significance of spatial effects is they have an important influence on child survival in the three countries. These spatial effects may represent many factors, and are likely surrogates of factors not captured by the census survey instruments. They may include distal factors such as access to health care, availability of health care centres, reproductive health behaviour,32 cultural and religious practices (including nutrition habits) specific to certain areas which may either benefit children or put them at increased risk of mortality, or they may represent other factors such as disease prevalence or cost or quality. Understanding geographical variability of mortality is an increasingly important research approach.17 However, this has often been done implicitly using categorical variables to measure geographic effects.31 In our approach, we explicitly introduced spatial effects and modelled them at the local level.
In our analyses of spatial frailties, we have used the traditional approach that extends hierarchical exchangeable frailties to incorporate spatial autocorrelation and heterogeneity. However, recent developments in the analysis of spatially correlated survival data mean that a multivariate spatial dependence structure has been proposed.33 This is ideal for multiple spatially dependent data, or data that arise in spatially arranged settings.23 ,34 Therefore, a conventional conditional autoregressive (CAR) model may not be ideal to capture spatial frailties. Models designed through multiple memberships multiple classification,34 or using a mixture of Polya trees,35 or multivariate CAR23 offer desirable properties. Indeed, further studies which consider the multilevel and multivariate structure of survival data are worth exploring.33 ,36 ,37
Strength and limitations
It should be noted that these samples from census are 10 times bigger than those used in national surveys like DHS. However, there are some limitations in the present study that deserve attention. First, census data are cross-sectional in nature and the present study does not allow establishing temporality and thus causality of the observed associations. Given the self-reporting of children death in census, we cannot disregard the likelihood that mortality outcomes may be influenced by the respondent's recall. In addition, there was limited or lack of information for variables such as income and diseases data in census compared to surveys data, which are relevant to mortality. Nevertheless, our findings corroborate the notion that childhood mortality is an increasing public health issue in these countries, with evidence of considerable spatial variation across different provinces in the three countries.
Another important issue in the use of this data is the issue of data quality because of the fact that national census in developing countries are prone to incomplete or partial reporting of responses. Moreover, the use of complex questionnaires inevitably allows scope for inconsistent responses to be recorded for different questions resulting in a further complication in the assessment of morality outcomes.
In summary, the primary objective of this article was to illustrate a novel application of a recently developed structured additive regression model to analyse census data in SSA. The approach is data driven and has rarely been applied in the SSA region. Census data is often not used, thus this paper exemplifies the use of such techniques in census data as opposed to survey samples, with results providing confirmatory data, and therefore, providing more confidence in censuses and national surveys. Indeed, the present paper offers incremental new information regarding child survival at the individual or geographical levels in Africa. Furthermore, the results emphasise the fact that there are complex social and demographic processes operating in under-five mortality which can be more clearly understood using adequate statistical modelling which analyses the outcome of mortality beyond the individual child's risk factors and which incorporates distal factors such as the area where the child lives at the time of the survey. This has implications for these countries in terms of policy and planning for the achievement of Millennium Development Goal (MDG 4) to reduce under-five mortality by half by 2015.
Appendix
Statistical methodology
In studying survival of the child, we assume T as time to event or survival time with t as the actual realisation. The probability that a survival time T is less than or equal to some value t is given by  . In our context, F(t) is the cumulative probability that a child dies at or before some given time t, thus F(t)=P(Child dies at time ≤t). The instantaneous probability that an event will occur at any given small interval is defined as F’(t)=f(t). The proportion of children surviving to time t or beyond is derived as S(t)=1−F(t), which is also known as the survivor function. An important approach is to consider the duration analysis through the hazard rate. The hazard rate, which links the survival and failure functions, is of the form
  or equivalent to
  . The hazard rate, unlike the survivor function, describes the risk or event of ‘failure’ given that the individual has survived all along up to point t.
In the analysis of child mortality, our interest is to answer this question: Given that the child has survived up to month t, what is the likelihood it will survive in the subsequent months? Further to this, one is interested in how the hazard rate varies with respect to some covariates, for instance, will the hazard be the same for children living in urban and rural areas? One way to analyse such data is to use Kaplan–Meier survival curves and log-rank test. This is an exploratory analysis that permits assessment of any differences in child survival by various covariates.
An alternative model which captures the effect of covariates is to use Cox regression models or commonly referred to as the proportional hazard model. It should be pointed out, however, that various statistical models may be constructed, see Box-Steffensmeier and Jones13 for an overview on the topic. In contrast to other data, several issues are considered when analysing survival data. Central are censoring and truncation of survival data, existence of time-varying covariates, occurrence of multiple causes of death, whether events occurrences were recorded in discrete-time, and the possibility of group-risk factors and confounders acting on the hazard. Thus, a more general model that incorporates all these issues if they are present in the data is needed.
We propose using a more general Cox model that captures a wide range of issues including spatial frailties. Thus, a spatial Cox regression model20 was applied to determine factors associated with the risk of early childhood mortality. Assume that  is the observed number of months lived or the censoring time for jth child in area i. Under Cox's model, the hazard function at time T=t is given by
 1where
  is the baseline hazard at time t, and the βs are a vector of regression coefficients for the fixed and time-invariant variables
 . The exponent of a coefficient, that is, exp(β), is interpreted as HR, that is, the ratio of instantaneous risks which is assumed to be constant over time. The HR compares rates of deaths in one group to some reference group, for a categorical variable, and to the mean for a continuous variable.
Since individuals are clustered in geographical regions, group-specific random frailty term,  , was introduced to augment the Cox model, that is,
 2
2
The above model indicated that childhood survival was influenced by both individual-specific factors  and group-specific environmental factors
  . Here it was assumed that the environmental factors were approximated by geographical locations. In the case of geographical regions, spatially distributed random effects
  were assumed, while for the other unstructured heterogeneity a random effect,
  , was specified such that
  . Fitting model (2) assumed a semiparametric additive predictor, which is known as geoadditive survival model,20
 3where
  is the log-additive predictor at time t for child j in area i. The term
  is the log baseline hazard effect at time t. The other terms are as defined above.
Estimation: fully Bayesian approach
Prior distributions for covariate effects
Modelling and inference uses the fully Bayesian approach. In the Bayesian formulation, the specification of the proposed model (equation 3) is complete by assigning priors to all unknown parameters. For the fixed regression parameters, a suitable choice is the diffuse prior, that is, p(γ)∝const, but a weakly informative Gaussian prior is also possible. The baseline hazard effect,  , was assigned a penalised spline with a second order random walk prior. Similarly, the time and continuous covariates were estimated non-parametrically through smoothness priors. We use the second-order Gaussian random walk prior to allow enough flexibility, while penalising abrupt changes in the function, as suggested by Brezger et al.30 The prior can be expressed in the pairwise difference form as
 4where
  and
and  is the variance, with diffuse priors
 ,
,  for initial values.
For the unstructured spatial heterogeneity term,  is assumed to follow an exchangeable Gaussian prior with zero mean and variance,
  , that is,
  . Finally, for the spatial components
  , we assign a MRF prior.30 This is analogous to random walk models. The conditional distribution of
 , given adjacent areas
 , is a univariate normal distribution with mean equal the average
  values of
 's neighbouring areas and variance equal to
  divided by the number of adjacent areas. This leads to a joint density of the form
 5where i∼j denotes that area i is adjacent to j, and assumes that parameter values
  and
and  in adjacent areas are similar. The degree of similarity is determined by the unknown precision parameter
 .
.
By writing  ,
,  ,
,  and
and  , for a well-defined design matrix Z and a (possibly high-dimensional) vector of regression parameters β, all different priors (equations 4 and 5) can be expressed in a general Gaussian form
 6with an appropriate penalty matrix
 . Its structure depends on the covariate and smoothness of the function. In most cases,
  is rank deficient and hence the prior for
  is improper. For the variances
  we a
we a assume inverse Gamma priors
  , with hyperparameters
  ,
,  chosen such that this prior is weakly informative.
Posterior distribution
Fully Bayesian inference is based on the analysis of posterior distribution of the model parameters. In general, the posterior is highly dimensional and analytically intractable, which makes direct inference almost impossible. This problem is circumvented by using MCMC simulation techniques, whereby samples are drawn from the full conditional of parameters given the rest of the data. Under conditional independence assumptions the posterior distribution for the Bernoulli model is given by Bayes Theorem
 7where the quantity
  is the prior density function, and
  denotes the likelihood of the data. More specifically, the posterior is given by
where  is a binary indicator coded 1 if an event occurs and 0 if an event does not occur at time t. For updating the full conditionals of parameters, we use a hybrid MCMC sampling scheme of the iteratively weighted least squares proposals, developed for GLMM by Brezger,30 and Metropolis-Hastings algorithm. Full details are presented elsewhere.20 ,36
Data analysis
A number of models were explored. The first model (M0) explored unstructured variation in child i at provincial level k

The second set of models estimated fixed effects only (M1a) and then we adjusted for unstructured random effects at province level (M1b).

We also investigated geographical variation at district level. We fitted both unstructured (M2a)and structured random effects (M2b) using districts as variables.

The last set of models combined fixed and random effects at district and province levels. In model M3a we estimated structured spatial effects at district level and unstructured effects at province level, and model (M3b) improved model M3a by combining with fixed effects.

Model comparison was based on the DIC.38 This is given by, where  is the deviance of the model evaluated at the posterior mean of the parameters, and represents the fit of the model to the data. The component
  is the effective number of parameters, which assessed the complexity of the model. Since small values of
  indicate good fit while small values of
  indicate a parsimonious model, small values of DIC indicate a better model. Models with differences in DIC of <3 compared with the best model cannot be distinguished, while those between 3–7 can be weakly differentiated.38
References
Footnotes
-
Contributors KL was involved in conception and design, literature review, data analysis and interpretation, drafting the article, critical revisions for important intellectual content and approval of final article for submission. CA was involved in interpretation of results, critical revisions for important intellectual content and approval of final article for submission. KN-B was involved in conception and design, interpretation of results, critical revisions for important intellectual content and approval of final article for submission.
-
Competing interests None.
-
Ethics approval National Statistical Office of each country.
-
Provenance and peer review Not commissioned; externally peer reviewed.
-
Data sharing statement This study uses census and household data available free of charge to all.