Article Text

Abstract
Objective To compare the incidence of six gastrointestinal cancers (colorectal, oesophageal, gastric, liver, gallbladder and pancreatic) among the six main ‘non-White’ ethnic groups in England (Indian, Pakistani, Bangladeshi, Black African, Black Caribbean and Chinese) to each other and to Whites.
Methods We analysed all 378 511 gastrointestinal cancer registrations from 2001–2007 in England. Ethnicity was obtained by linkage to the Hospital Episodes Statistics database and we used mid-year population estimates from 2001–2007. Incidence rate ratios adjusted for age, sex and income were calculated, comparing the six ethnic groups (and combined ‘South Asian’ and ‘Black’ groups) to Whites and to each other.
Results There were significant differences in the incidence of all six cancers between the ethnic groups (all p<0.001). In general, the ‘non-White’ groups had a lower incidence of colorectal, oesophageal and pancreatic cancer compared to Whites and a higher incidence of liver and gallbladder cancer. Gastric cancer incidence was lower in South Asians but higher in Blacks and Chinese. There was strong evidence of differences in risk between Indians, Pakistanis and Bangladeshis for cancer of the oesophagus, stomach, liver and gallbladder (all p<0.001) and between Black Africans and Black Caribbeans for liver and gallbladder cancer (both p<0.001).
Conclusions The risk of gastrointestinal cancers varies greatly by individual ethnic group, including within those groups that have traditionally been grouped together (South Asians and Blacks). Many of these differences are not readily explained by known risk factors and suggest that important, potentially modifiable causes of these cancers are still to be discovered.
- Cancer Epidemiology
- Cancer Registries
- Gastrointestinal Cancer
Statistics from Altmetric.com
Significance of this study
What is already known on this subject?
-
There are large unexplained variations in incidence of gastrointestinal cancers internationally, with South Asian countries, for example, having some of the lowest rates of colorectal cancer and highest rates of gallbladder cancer globally.
-
South Asians and Blacks in England have also been shown to have different risks of gastrointestinal cancers compared to Whites.
-
However, South Asians and Blacks are heterogeneous groups, and the risk of gastrointestinal cancers by their individual ethnic group (Indian, Pakistani and Bangladeshi; Black African and Black Caribbean) as well as Chinese, is unknown.
What are the new findings?
-
There was strong evidence of differences in incidence by ethnic group for colorectal, oesophageal, gastric, liver, gallbladder (all p<0.001) and pancreatic cancer.
-
South Asians are not homogeneous with respect to their risk of gastrointestinal cancers, with large differences in incidence between Indians, Pakistanis and Bangladeshis for cancer of the oesophagus, stomach, liver and gallbladder. There are also significant differences in the risk of liver and gallbladder cancer between Black Africans and Caribbeans.
-
Many of these differences cannot be explained by known risk factors and suggest that important, potentially modifiable causes of these cancers are still to be discovered.
-
The very low rates seen for some cancers (eg, oesophageal cancer in British Pakistanis) may indicate the potential for reducing incidence in other ethnic groups.
How might it impact on clinical practice in the foreseeable future?
-
The incidence of all gastrointestinal cancers varies greatly by individual ethnic group, and this differential risk may impact on the index of clinical suspicion for particular cancers in different ethnic groups.
Introduction
Gastrointestinal cancers are of major public health importance, causing more than a third of all deaths from cancer worldwide.1 There are large unexplained variations in incidence internationally of gastrointestinal cancers with, for example, South Asian countries having some of the lowest rates of colorectal cancer and highest rates of gallbladder cancer globally.1 Studies of cancer incidence in migrant populations can contribute to our understanding of aetiology, particularly for cancers for which there are few established risk factors (eg, colorectal and pancreatic cancer).2 Studying different ethnic groups in the same country also overcomes the limitations of some international comparisons as similar diagnostic methods, reporting and registration procedures are used, regardless of country of origin.3
Following large scale migration from former colonies since the 1950s, the UK has become a multi-ethnic society, with ‘non-White’ ethnic groups making up about 17% of England's population in 2009.4 British (South) Asians—Indians, Pakistanis and Bangladeshis—form the largest group of about 6%, and British Blacks—Black Africans (mainly from Nigeria, South Africa, Ghana and Somalia) and Black Caribbeans (predominantly from Jamaica)—are second at about 3%, with Chinese (mainly from Hong Kong) about 1%.5 Previous studies have shown South Asians in England to have lower rates of colorectal, oesophageal, gastric and pancreatic cancer and higher rates of liver cancer than British Whites.6–10 However, South Asians are a heterogeneous group with widely varied diets, habits and socio-cultural practices, and the risk of gastrointestinal cancers by their individual ethnic group (Indians, Pakistanis and Bangladeshis) is unknown. Similarly, British Blacks have been shown to have lower rates of colorectal and oesophageal cancer, but higher rates of gastric and liver cancer than British Whites,6 but again the risk by their individual ethnic group (Black African and Caribbean) is unknown.
Since 1995, self-assigned ethnicity has been recorded in the Hospital Episodes Statistics (HES) database (using the same classification system as used in the census) and HES records can now be linked to cancer registrations, thus providing more reliable information on ethnicity11 and allowing all ethnic groups to be analysed separately for the first time.12
Our objective was to compare the incidence of colorectal, oesophageal, gastric, liver, gallbladder and pancreatic cancer amongst the six main ‘non-White’ ethnic groups in England (Indian, Pakistani, Bangladeshi, Black African, Black Caribbean and Chinese) to each other and to Whites.
Methods
Data collection
We obtained data from the National Cancer Intelligence Network (NCIN) for all cancer registrations from January 2001 to December 2007 in England: cancer site coded to the International Classifications of Diseases, 10th revision (ICD-10)13; morphology coded to the International Classifications of Diseases of Oncology, 2nd and 3rd revisions (ICD-O-2 and ICD-O-3)14 ,15; deprivation assessed from the income domain of the Index of Multiple Deprivation 2007 (IMD 2007)16; age at diagnosis of cancer; sex and ethnicity. We used the mid-year population estimates produced by the Office of National Statistics (ONS) from 2001–2007, stratified by age, sex and ethnicity. Population data stratified by national quintiles of the income domain were provided by ONS based on the 2001 census and the same distributions applied to population data by age, sex and ethnicity for the 2001–2007 mid-year population estimates.
Classification of ethnicity
NCIN obtained the self-assigned ethnicity for each cancer registration by record linkage to the HES database. If a cancer registration could not be linked to HES or if ethnicity data were missing on the HES database, then ethnicity was assigned using information recorded on cancer registry data. Prior to April 2001, ethnicity was coded both by HES and by cancer registries using the classification system of the 1991 census. After April 2001, the codes were amended to those of the 2001 census, although 1991 ethnicity codes were accepted until 2003. For these analyses, we classified ethnicity as White (White from the 1991 census and White British from the 2001 census), Indian, Pakistani and Bangladeshi (with the three groups combined to form the category ‘South Asian’), Black African, Black Caribbean (again both combined to form the category ‘Black’) and Chinese.
Classification of cancers
We studied cancers of the colon and rectum (ICD-10 codes C18–C20), oesophagus (C15), stomach (C16), liver (C22 including C22.0, hepatocellular carcinoma), gallbladder (C23–C24) and pancreas (C25).
We used morphology to subdivide oesophageal adenocarcinomas and oesophageal squamous cell carcinomas.
Statistical analyses
We estimated age-standardised rates (ASRs) of cancer per 100 000 person-years for all ethnic groups using direct standardisation to the 1960 Segi world population,17 with age at diagnosis of cancer being classified into six categories: <40, 40–49, 50–59, 60–69, 70–79 and ≥80 years. We used Poisson regression to estimate incidence rate ratios (IRRs) comparing each ethnic group (and the two combined groups, South Asians and Blacks) to Whites, adjusting for sex, age and income.
When comparing ‘South Asians’ and ‘Blacks' to Whites, we present results as IRRs with 99% CIs. When comparing the individual ethnic groups, results are presented as IRRs and 99% floating CIs (FCIs). FCIs were calculated using the method of floating absolute risks,18 ,19 which enable valid comparisons between any two ethnic groups, even if neither one is the baseline. We calculated 99% CIs because of the multiple tests performed across subgroups.
We performed prespecified subgroup analyses by sex (male vs female), cancer site for colorectal cancer (colon vs rectum), and tumour type for oesophageal cancer (adenocarcinoma vs squamous cell) and liver cancer (hepatocellular carcinoma vs other). We chose the age division so that cancer rates in the first versus later generations of South Asians could be examined—the percentage of South Asians born outside the UK is 97% for those aged ≥50, whereas for those aged <50 the majority (58%) were born in the UK.5 Subgroup analysis by age for Blacks and Chinese was also done for completeness (although it did not allow the same discrimination by generation).
Tests of heterogeneity of IRRs between ethnicities, either overall or restricted to South Asians or Blacks, were performed using the likelihood ratio test. Tests of heterogeneity of IRRs between the prespecified subgroups were performed for South Asians, Blacks and Chinese, using a χ2 contrast test.
Sensitivity analysis
Because ethnicity information was not complete for all registered cancers, we did a sensitivity analysis using multiple imputations of the missing ethnicity values based on age, sex, income and site of cancer.
All analyses were performed using Stata V.12 and R statistical software packages.
Graphical presentation of results
Where results are presented in the form of plots, we represent IRRs for each ethnic group by squares and their corresponding 99% FCIs by straight lines. For the combined ‘South Asian’ and ‘Black’ group, we show IRRs as open diamonds, whose horizontal extent indicates the 99% CI. We placed a dashed vertical line at the value of the IRRs for all South Asians and for all Blacks.
Comparison to rates in countries of origin
We also compared the ASRs for each ethnic group in England to rates from their country or region of origin using data from the Globocan database and from population-based registries within IARC's Cancer Incidence in Five Continents (where available) which are also standardised using the1960 Segi world population.20 ,21 The majority of British Indians are from Gujarat and Punjab, neither of which have population-based cancer registries and so we used figures from Mumbai.22 Most British Pakistanis are from Kashmir and Punjab, but the South Karachi Cancer Registry is the only population-based registry in Pakistan. Most British Bangladeshis are from Sylhet but there are no population-based cancer registries in Bangladesh. For Blacks, we used Globocan estimates for Sub-Saharan Africa and the Caribbean; there are no population based cancer registries in their main countries of origin. For Chinese, we used the Hong Kong Cancer registry data.
Risk factors
We obtained data on the prevalence of the important risk factors for gastrointestinal cancers in each ethnic group from nationally representative surveys in England.
This study was approved by the Oxford Research Ethics Committee (this was a requirement for the data to be released by NCIN).
Results
Table 1 shows socio-demographic information from the 2001 census for Whites, Indians, Pakistanis, Bangladeshis, Black Africans, Black Caribbeans and Chinese. All six groups are, on average, younger than Whites and all except the Chinese are also poorer, with Pakistanis, Bangladeshis and Black Africans being the most deprived. About half of the South Asian and Black Caribbean population was born in the UK compared to only about 30% of Black Africans and Chinese.
Comparison of demographic characteristics by ethnic group in England in 2001 using data from the 2001 census5
Table 2 shows the number of cancer registrations by ethnic group, and missing ethnicity values, for each cancer. In total, there were 378 511 gastrointestinal cancer registrations and ethnicity information was missing in 64 977 cases (17.2%).
Distribution of registered cancers from 2001–2007 in England by ethnic group and missing ethnicity values (percentages in brackets)
Figure 1 shows the overall age-standardised incidence rates and rate ratios (adjusted by age, sex and income) for the six gastrointestinal cancers by individual ethnic group compared to Whites. It shows that for all six cancers there is significant heterogeneity between the ethnic groups (all p<0.001).

Age-standardised incidence rates and rate ratios (adjusted by age, sex and income) for the six gastrointestinal cancers by individual ethnic group compared to Whites.
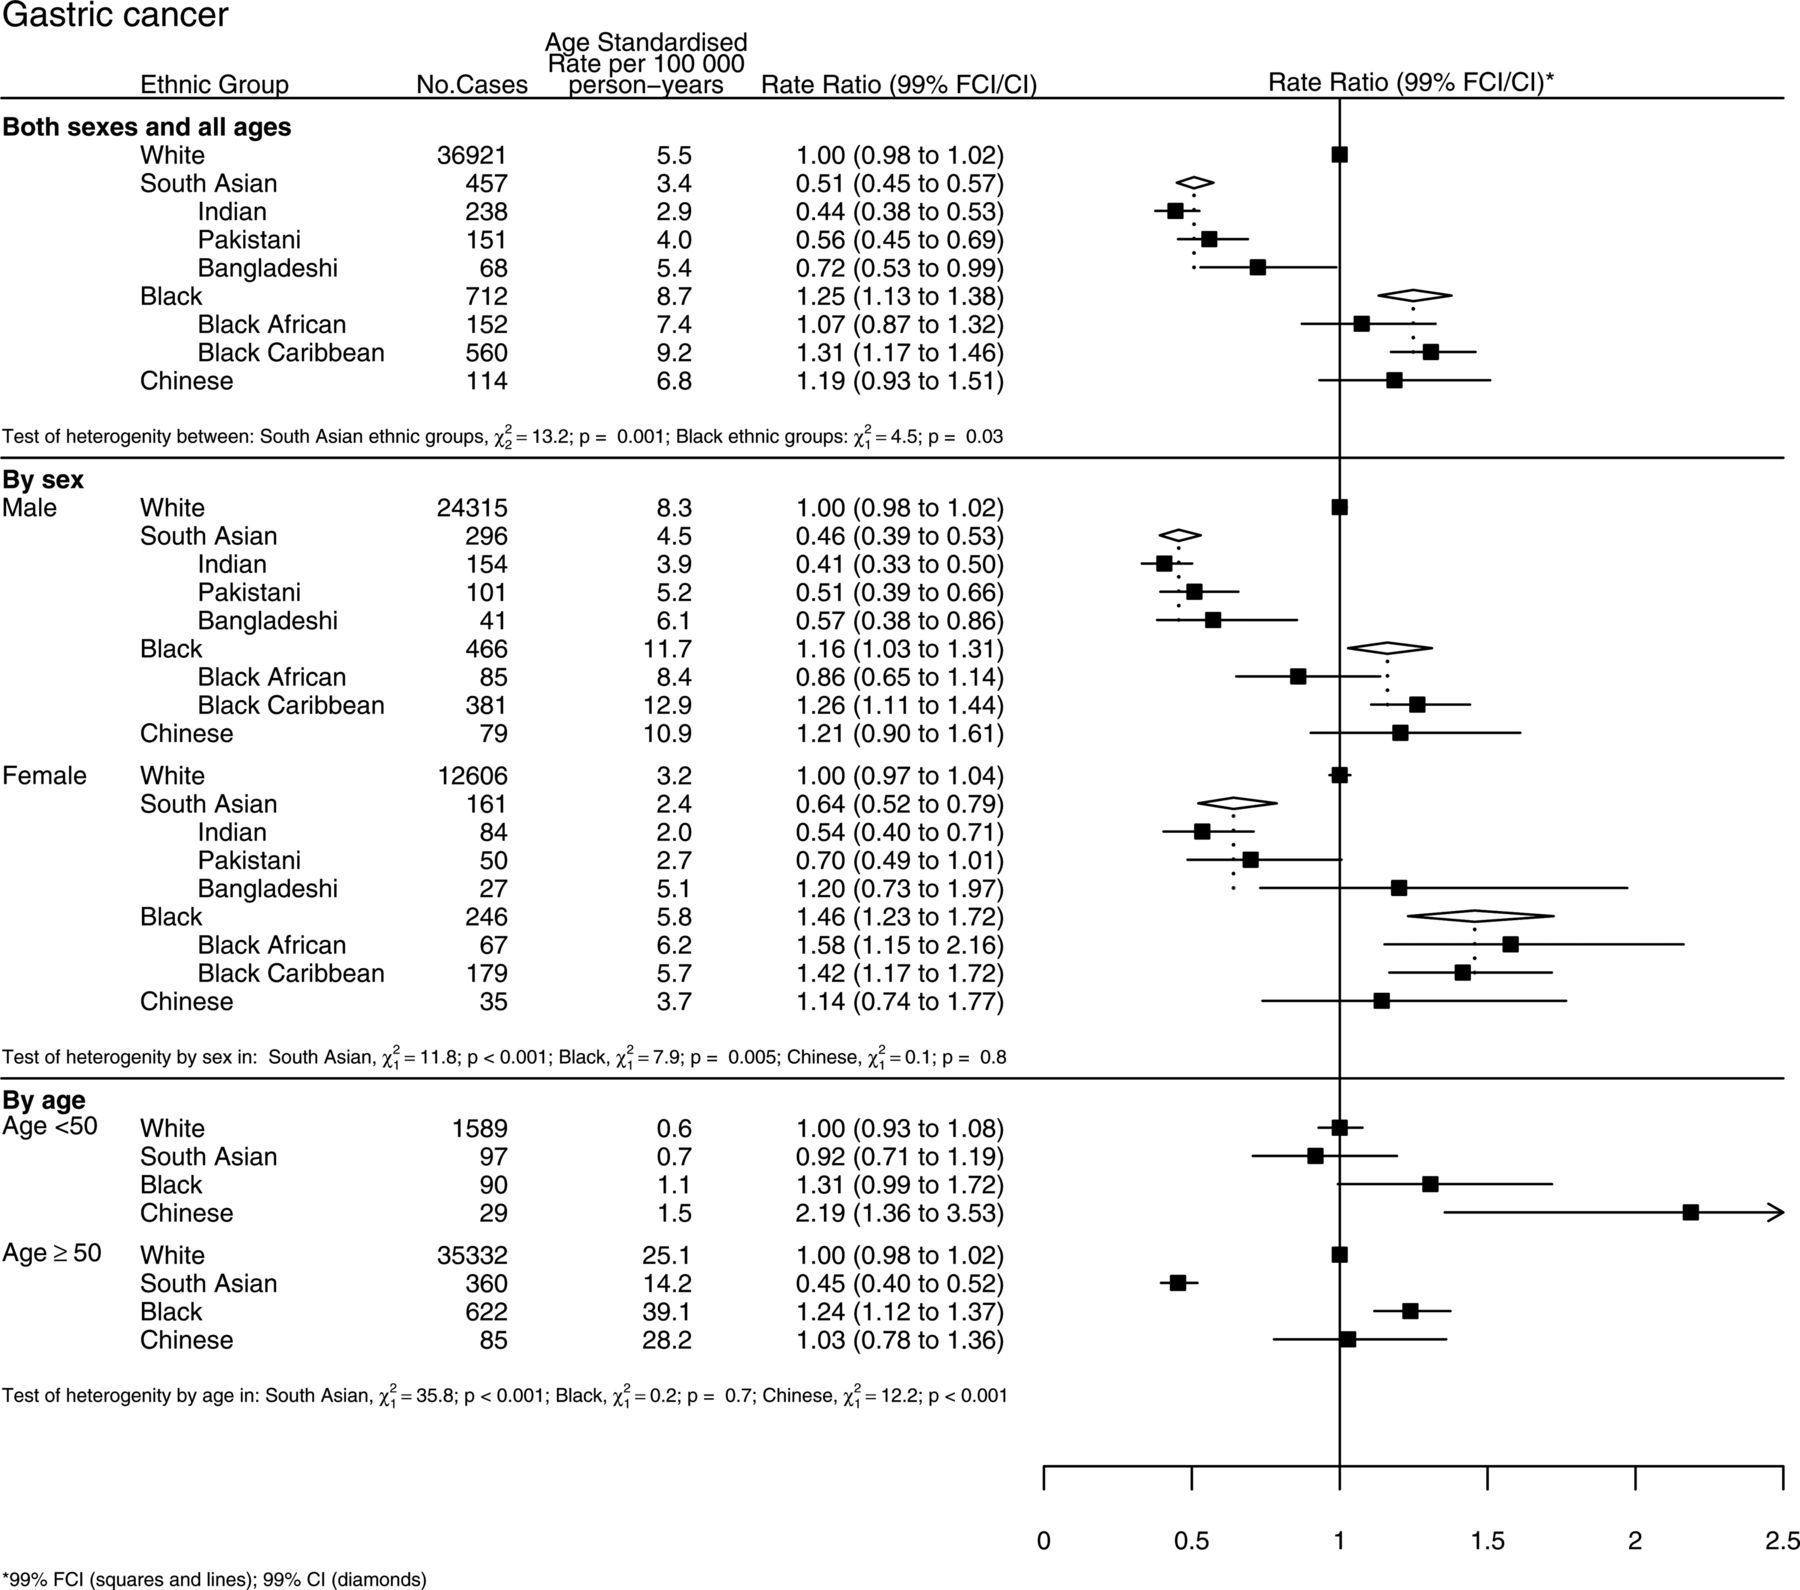
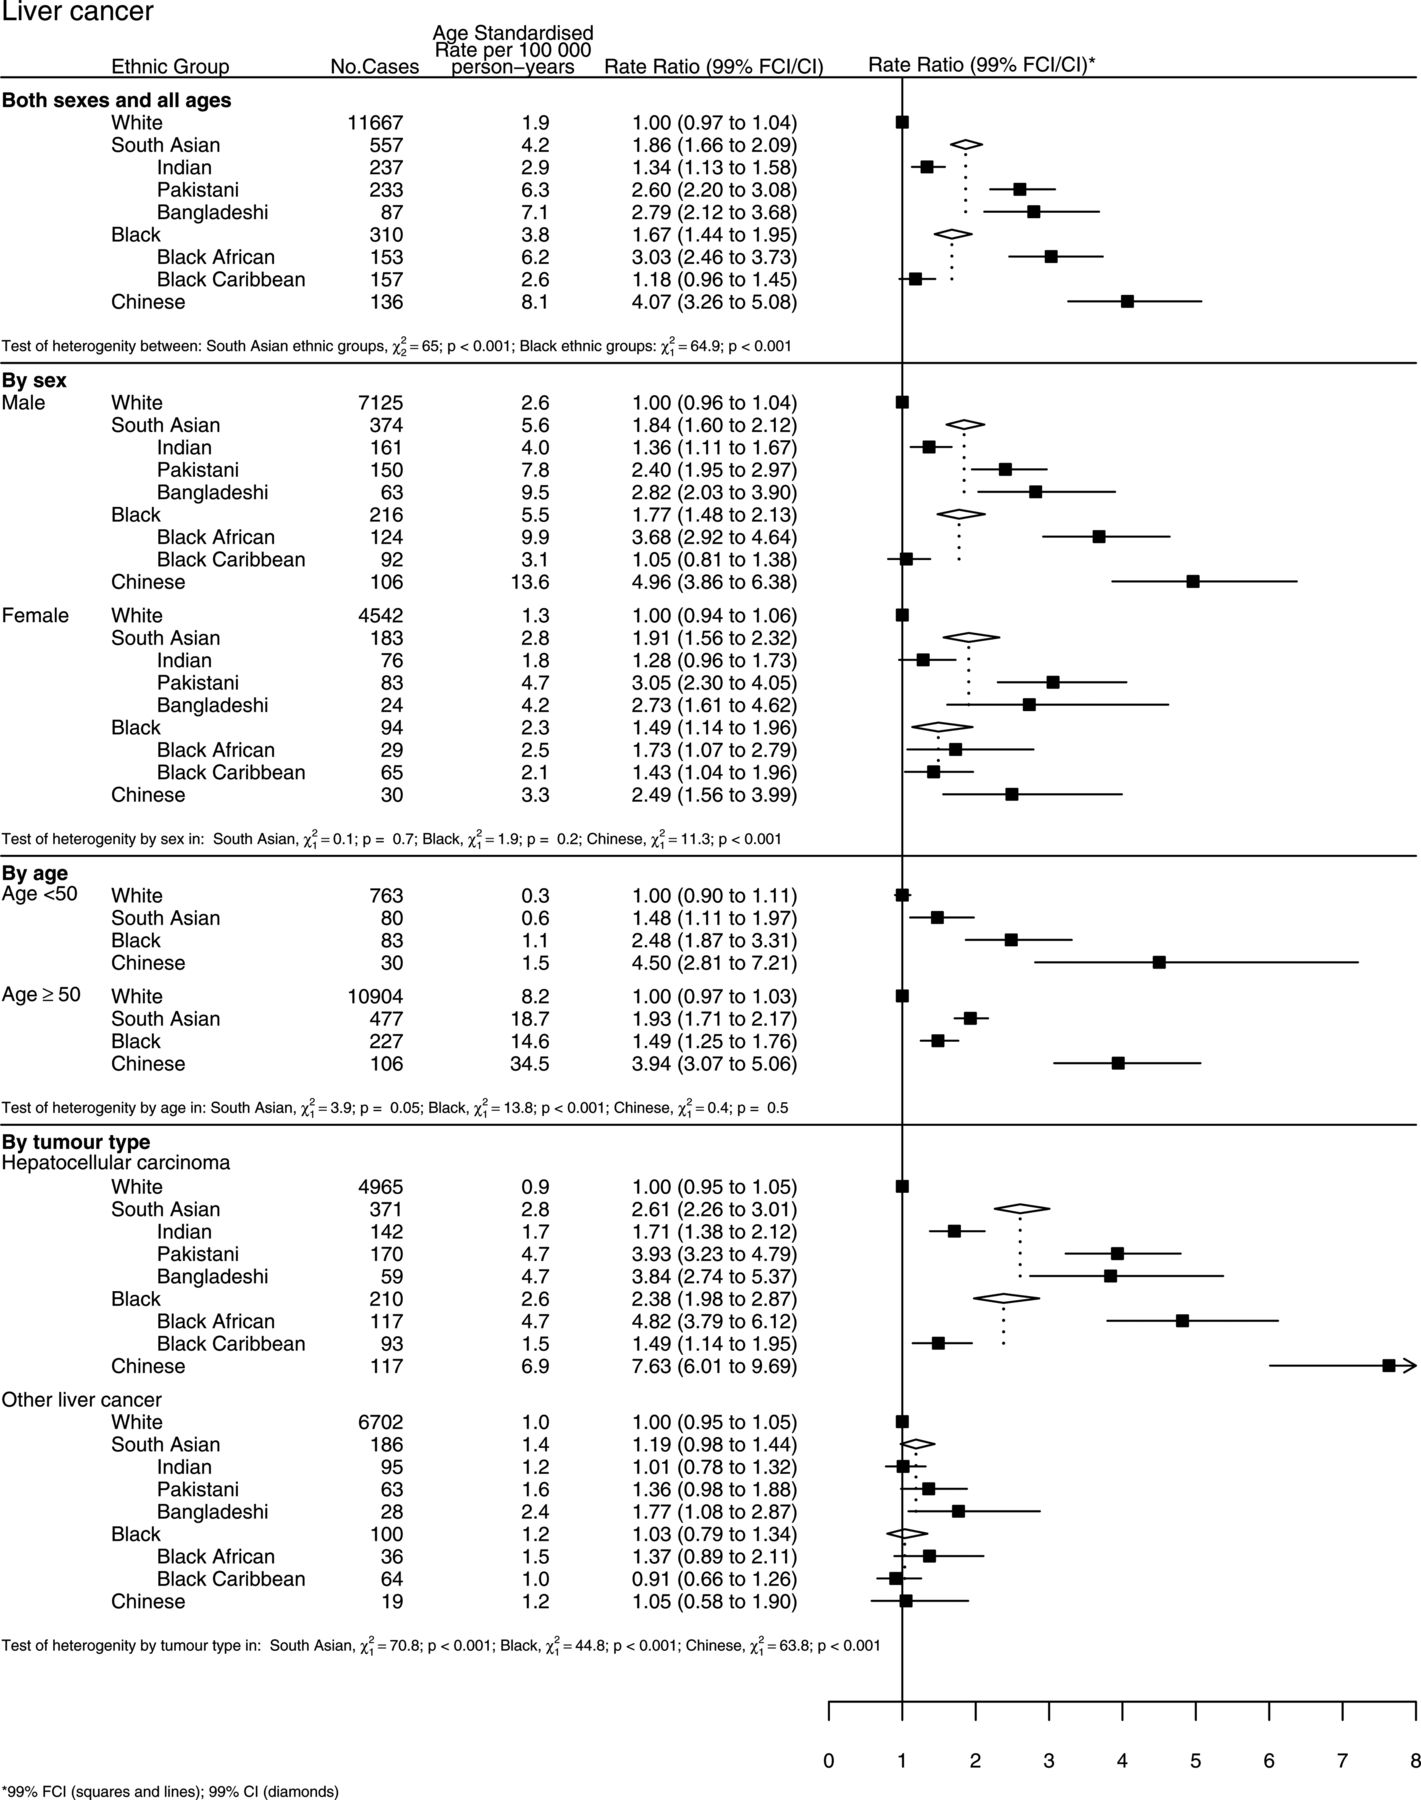
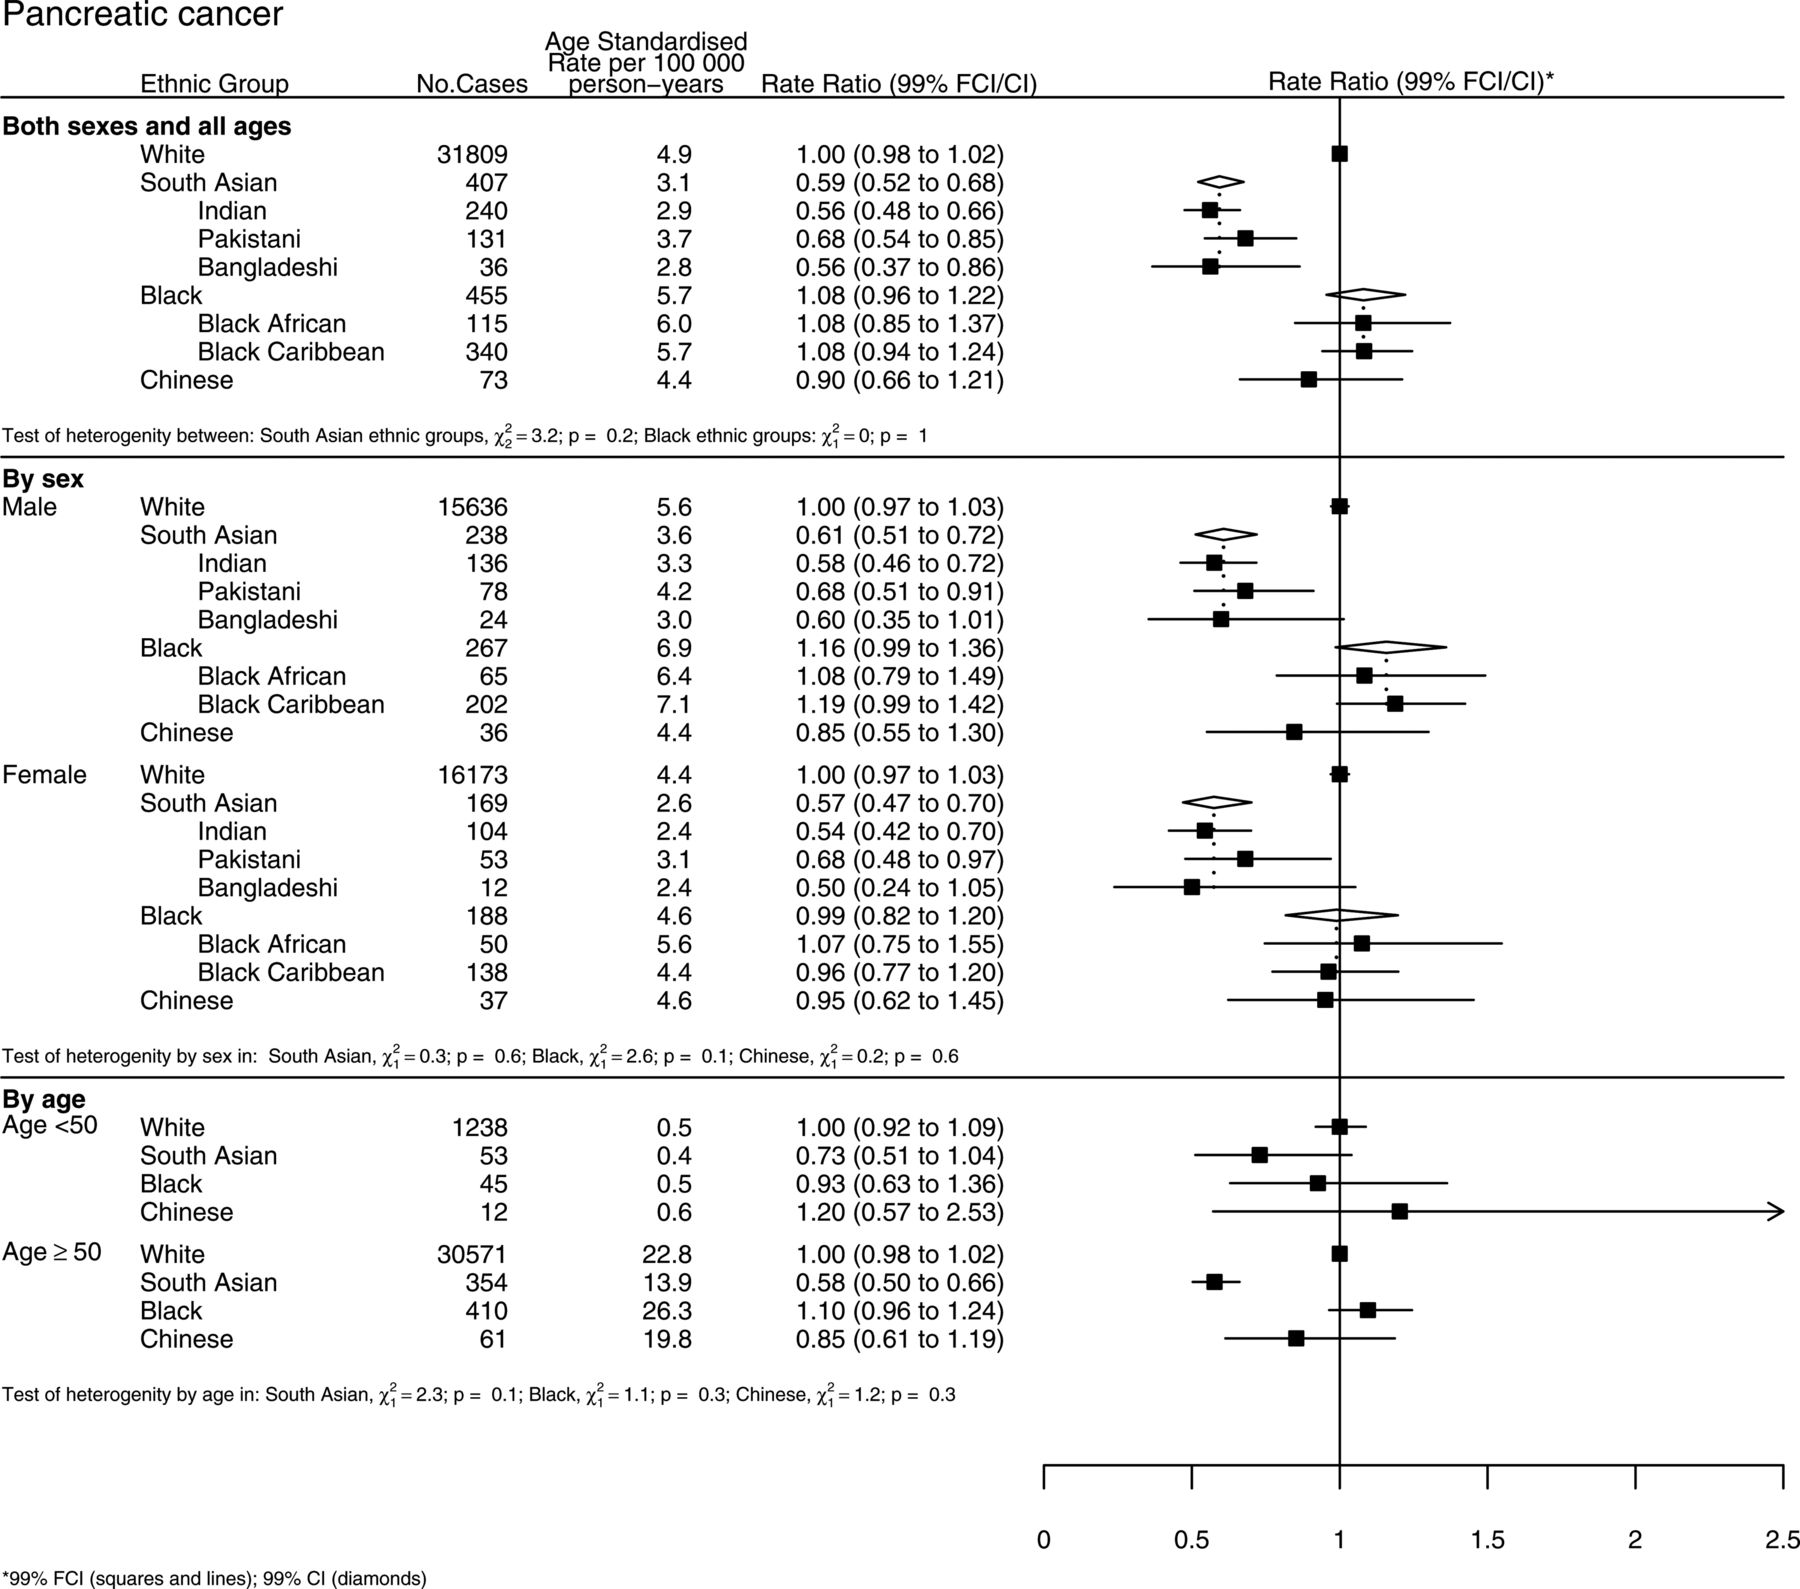
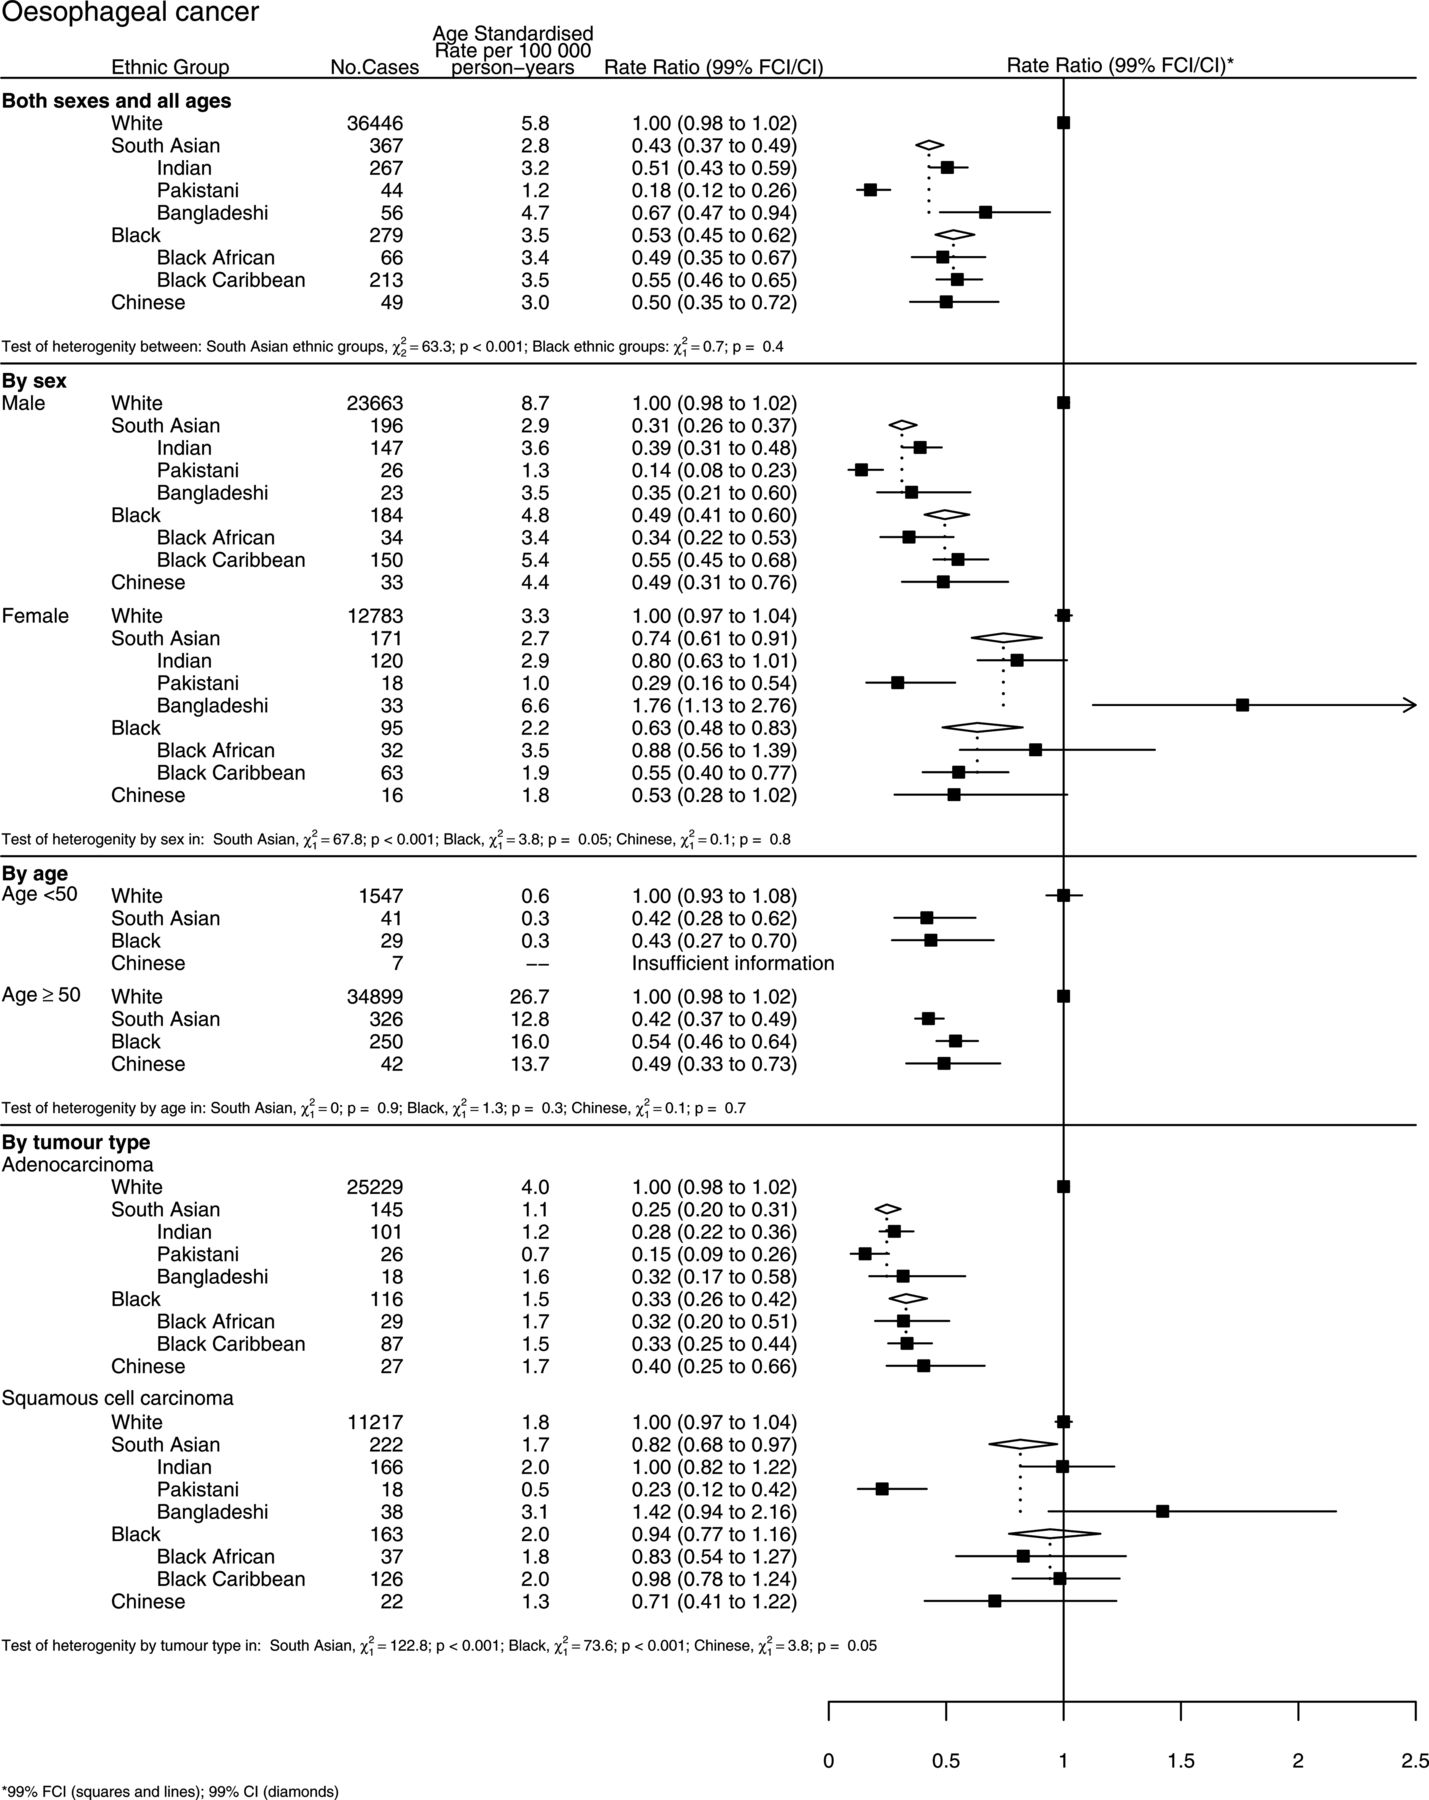
Figure 2(A–F) shows further results for each of the six cancer sites, subdivided by sex, age, and by anatomical site or type, as appropriate.

(A) Age-standardised incidence rates and rate ratios (adjusted by age, sex and income) for colorectal cancer by ethnic group. Subgroups show rates and rate ratios subdivided by sex, age, and by anatomy (colon and rectum cancer). (B) Age-standardised incidence rates and rate ratios (adjusted by age, sex and income) for oesophageal cancer by ethnic group. Subgroups show rates and rate ratios subdivided by sex, age, and by morphology (adenocarcinoma and squamous cell carcinoma). (C) Age-standardised incidence rates and rate ratios (adjusted by age, sex and income) for gastric cancer by ethnic group. Subgroups show rates and rate ratios subdivided by sex and age. (D) Age-standardised incidence rates and rate ratios (adjusted by age, sex and income) for liver cancer by ethnic group. Subgroups show rates and rate ratios subdivided by sex, age, and by morphology (hepatocellular carcinoma and other). (E) Age-standardised incidence rates and rate ratios (adjusted by age, sex and income) for gallbladder cancer by ethnic group. Subgroups show rates and rate ratios subdivided by sex and age. (F) Age-standardised incidence rates and rate ratios (adjusted by age, sex and income) for pancreatic cancer by ethnic group. Subgroups show rates and rate ratios subdivided by sex and age.

Continued.
Continued.
Continued.

Continued.
Continued.
For colorectal cancer (figure 2A), incidence was lowest in South Asians compared to all other ethnic groups and approximately half that in Whites (p<0.001), with similarly large reductions in risk seen separately in Indians, Pakistanis and Bangladeshis. Both Black groups had about a 20% lower incidence than Whites (p<0.001), while the incidence in Chinese was about 10% lower (p=0.02). There was no significant difference in the overall rate ratios by sex between South Asians or Chinese, but incidence was slightly higher in Black women compared to men. In South Asians, colorectal cancer risk in those aged less than 50 years was closer to that of Whites than in those aged 50 years or older (p<0.001).
For oesophageal cancer (figure 2B), the incidence was lower in all ethnic groups compared to Whites, with South Asians, Blacks and Chinese having about half the incidence of that in Whites. There were also substantial differences between Indians, Pakistanis and Bangladeshis (IRRs of 0.51, 0.18 and 0.67, respectively, p<0.001). South Asian women had a higher risk than men (p<0.001), with a six-fold difference in risk between Pakistani and Bangladeshi women, whereas there was no difference by sex in Blacks or Chinese. There was no difference in risk by age group in any ethnic group. The lower incidence of oesophageal cancer in all ethnic groups compared to Whites was largely due to their lower incidence of adenocarcinoma rather than of squamous cell carcinoma. Bangladeshis had a six times higher risk of squamous cell carcinoma compared to Pakistanis.
For gastric cancer (figure 2C), the overall incidence in South Asians was half that in Whites (p<0.001), with substantial differences between Indians, Pakistanis and Bangladeshis (0.44, 0.56 and 0.72, respectively, p<0.001). In contrast, incidence was higher in Blacks, mainly due to the higher rates in Black Caribbeans compared to Africans. South Asian women had a higher risk than men (p<0.001), with a twofold difference in risk between Indian and Bangladeshi women, whereas there was no difference by sex in Blacks or Chinese. For South Asians, gastric cancer rates in those aged less than 50 years were much closer to those in Whites; in those 50 years and older, the opposite pattern was seen in the Chinese (both p<0.001).
For liver cancer (figure 2D), incidence was higher in all ethnic groups compared to Whites, with the highest rates seen in Chinese (four times higher). There were significant differences within the South Asian groups, with Bangladeshis having more than double the risk of Indians. There was also significant heterogeneity among Blacks, with Black Africans having more than three times the risk of Black Caribbeans (p<0.001). There was no difference in risk by sex or age group in South Asians or Blacks, but rates were higher in Chinese men than women. The increased risk of liver cancer in all ethnic groups was largely due to their higher incidence of hepatocellular carcinoma compared to other types.
For gallbladder cancer (figure 2E), incidence was also higher in all ethnic groups compared to Whites. There were significant differences within the South Asian groups, with Bangladeshis having double the risk of Indians. There was also significant heterogeneity amongst Blacks, with higher incidence mainly confined to Black Africans (p=0.003). There were also differences by sex, with the excess risk among South Asians and Blacks being largely confined to women, but no difference by age group.
For pancreatic cancer (figure 2F), South Asians had lower risks than Whites, while there was no significant difference in risk for Blacks or Chinese. There was no evidence of heterogeneity between individual South Asian or Black groups, or by sex or by age group.
Sensitivity analysis
In the sensitivity analysis which assigned missing values using multiple imputation, results very similar to those shown in figure 1 were obtained, as shown in supplementary figure S3 (online).
Comparison to rates in countries of origin
Supplementary table S3 (online) compares international data on age standardised incidence rates from Globocan and cancer registries in Mumbai, South Karachi and Hong Kong. In summary, in South Asians, ASRs for colorectal, gallbladder and pancreatic cancer were higher than the rates in their countries of origin, but lower than in Whites; for oesophageal and gastric cancer they were lower than both their countries of origin and British Whites; and for liver cancer they were higher than both.
For Black Africans, the ASRs of colorectal and liver cancer were higher than in sub-Saharan Africa but lower than in Whites; for oesophageal cancer they were lower than both their region of origin and British Whites; and for gastric, gallbladder and pancreatic cancer they were higher than both.
For Black Caribbeans, the ASRs of colorectal, oesophageal and liver cancer were higher than in the Caribbeans and Whites but for gastric, gallbladder and pancreatic cancer they were higher than both their region of origin and British Whites.
For Chinese, the ASRs for all cancers were higher than in China and Whites; with the exception of oesophageal cancer, where they were lower than both.
Risk factors
Table 3 summarises data from on the prevalence of important risk factors for these cancers in each ethnic group in England (where data was available).23–26 Bangladeshi men had the highest prevalence of cigarette smoking and Black Caribbean and White women smoked more than all other ethnic groups. Bangladeshis had the highest prevalence of chewing tobacco in men and women. Whites and Black Caribbean men and White women had the highest alcohol consumption, while Pakistanis and Bangladeshis had the lowest. Prevalence of hepatitis C infection was highest in Pakistanis, whereas Blacks had the highest prevalence of hepatitis B (there were no data for Chinese in England). The prevalence of antibodies to Helicobacter pylori was only available in Whites and South Asians—South Asian men had a decreased risk compared to Whites but women had an increased risk. The prevalence of obesity was highest in White men and Black women and lowest in Chinese.
Prevalence of some risk factors relevant for gastrointestinal cancers, by ethnic group
Discussion
In this study, we compared incidence rates for six common gastrointestinal cancers in the main ‘non-White’ ethnic groups in England—South Asian (Indian, Pakistani and Bangladeshi), Black (African and Caribbean) and Chinese—to Whites and to each other. Overall, there was strong evidence of differences in incidence by ethnic group for all six cancers. In general, the ‘non-White’ groups had a lower incidence of colorectal, oesophageal and pancreatic cancer compared to Whites but a higher incidence of liver and gallbladder cancer. Gastric cancer incidence was lower in South Asians but higher in Blacks and Chinese. There were significant differences in risk between Indians, Pakistanis and Bangladeshis for cancer of the oesophagus, stomach, liver and gallbladder, and between Black Africans and Caribbeans for liver and gallbladder cancer. Cancer incidence in South Asians tended to be closer to that of Whites among those aged under 50 years (most of whom were born in the UK or migrated as children27) than among those older than 50 years (virtually all born outside the UK).5
The different patterns of cancer risk across each of the different ethnic groups with, for example, higher rates of liver and gallbladder cancer and lower rates of colorectal and oesophageal cancer (as well as differences by sex, age and tumour subtype) suggest that our findings are unlikely to be due to systematic reporting biases in any of the ethnic groups compared to Whites. Using self-assigned ethnicity is also more reliable than other measures of ethnicity (eg, name analysis) as it uses the same measure of ethnicity in the numerator and denominator.11 ,28 We also adjusted for socioeconomic status, a potential confounder in studies of health and ethnicity,29 and particularly important in comparisons involving Pakistanis, Bangladeshis and Blacks due to their higher levels of deprivation.
The main limitation of this type of descriptive study is that we do not have individual level information on most exposures although we do have population level data (shown in table 3) which allows us to make ecological comparisons. Ethnicity information was also missing for 17% of cancer registrations, but this is lower than previous analyses and the similar results found in the sensitivity analysis suggests this did not affect our results. Recording of ethnicity in HES has improved markedly, with the percentage of missing ethnicity values falling from 35% in 1998 to less than 10% by 2009.30 The quality of the ethnic coding in HES has also been assessed; no ethnic group is widely misrepresented in HES data for England, with the ethnic data coding being consistent with that of their patient population.30 Of course, we have to assume that the ethnic code was self-assigned and that patients use the same self-assigned ethnicity coding in HES as they did in the census, although we have no evidence to suggest that either of these assumptions is not valid.
Previous reports comparing cancer incidence in South Asians to Whites using self-assigned ethnicity, and South Asians to non-South Asians using name analysis, are broadly consistent with our results.6 ,7 ,9 ,10 ,31 ,32 There are no previous reports of the incidence of gallbladder cancer in any ethnic group in the UK, and no reports for pancreas cancer in Blacks and in Chinese; it is only the incidence of colorectal cancer that has been examined previously (it showed a reduced risk). We were unable to find any previous studies that compared the incidence of gastrointestinal cancers in the three South Asian groups or the two Black groups.
In discussing the implications of our findings for the aetiology of individual cancer sites (below), we refer to the prevalence of some the risk factors relevant for gastrointestinal cancers that are summarised in table 3.
Colorectal cancer incidence rates in all three South Asian groups are much lower than in Whites as well as the other ethnic groups, particularly in first generation immigrants. This is unexpected given the experience of other migrant groups (eg, Japanese migrants to the USA and South East Asian migrants to Australia), who were found to have similar rates of colon cancer to White Americans within one generation.33 ,34 The low rates for all three groups suggest that lifelong vegetarianism, which is practised by some Indians, but not by Pakistanis or Bangladeshis, is unlikely to explain this.
The lower incidence of oesophageal cancer in all ethnic groups compared to Whites is striking and is due almost entirely due to the much lower incidence of adenocarcinoma. This cannot be explained by known risk factors such as obesity (prevalence varies significantly by ethnic group),23 although a previous study also found that Whites had an increased risk of Barrett's oesophagus and oesophagitis compared to South Asians and Blacks.35 Squamous cell carcinoma rates, in contrast, were similar across all ethnic groups with the exception of Pakistanis, where they were very low (and also much lower than in Pakistan itself). Again, this is not readily explainable by known risk factors (Pakistani men have higher levels of cigarette smoking than Whites),23 although it may be partly explained by their lower consumption of alcohol23 (for religious reasons). The higher risk in Bangladeshi women could be due to their habit of chewing paan23 (betel quid, usually including tobacco and areca nuts), which has been reported to increase the risk of oesophageal cancer.36
The lower incidence of gastric cancer in South Asian men may be due to their lower exposure to H pylori compared to Whites26—Indians also smoke less but Pakistani and Bangladeshi men smoke more.23 Although Indian and Pakistani women have higher exposure to H pylori,26 their very low levels of smoking23 may explain their lower risk. The higher rates in Bangladeshi women could again be due to chewing paan as this may increase the risk of gastric cancer.37 Higher rates in Chinese (who are mainly first generation) reflects the higher incidence in China, but the higher rates in Black Caribbeans are unexpected, being higher than both Whites and their countries of origin (which could be due to under-diagnosis and under-registration in the Caribbean).
The higher incidence of liver cancer in South Asians is likely to be due to their higher prevalence of hepatitis B and C infection.25 ,38 However, the substantial differences between Indians, Pakistanis and Bangladeshis are not fully explained by this or their alcohol intake.23 Bangladeshis may have a higher risk due to their higher prevalence of tobacco smoking and chewing paan, which have been shown to be associated with an increased risk of liver cancer.39 The higher incidence in Black Africans and Chinese (who are both mainly first generation) reflects the very high rates in their countries of origin, where hepatitis B infection is endemic,40 and is confirmed by the high prevalence rates among Blacks in the UK.41 The higher incidence in all ethnic groups is confined to hepatocellular carcinoma, which is also consistent with the higher exposure to hepatitis B and C being the most relevant risk factor.
The reasons for the higher incidence of gallbladder cancer in South Asian women are unclear, but do reflect the incidence in their countries of origin. In contrast, the high incidence in Black Africans was unexpected, being higher than both Whites and their countries of origin (which could due to under-diagnosis and under-registration in sub-Saharan Africa). Similarly, the lower incidence of pancreatic cancer in South Asians is not easily explained but does reflect the incidence in their countries of origin.
In general, rates in South Asians were closer to Whites in those under 50 (mainly either born in the UK or migrated as young children) compared to those over 50 (virtually all born outside the UK). This is consistent with environmental exposures, particularly at younger ages, being important in the aetiology of these cancers, and it is unlikely that ethnicity itself (or genetic factors) are responsible for most of the observed differences in incidence, with ethnicity acting as a proxy for environmental/lifestyle factors (smoking, chewing tobacco, alcohol, diet, etc.)
The substantial differences in the incidence of gastrointestinal cancers in Indians, Pakistanis and Bangladeshis, have important public health implications. They show that South Asians should not be viewed as a homogenous group with respect to their cancer risk, and the very low rates seen for some cancers (eg, oesophageal cancer in Pakistanis) may indicate the potential for reducing incidence in other ethnic groups. There are also large differences in the incidence of liver and gallbladder cancer between Black African and Caribbean populations, again highlighting the need to differentiate between these two groups. The changes in cancer risk seen in these migrant populations may also give an indication of what could happen in the future in their countries of origin as they undergo rapid epidemiological transitions with potentially major global health implications.
Finally, many of the large differences in the incidence of gastrointestinal cancers seen across the different ethnic groups are not readily explained by known risk factors, and suggest that important, potentially modifiable, causes of these cancers are still to be discovered.
Acknowledgments
We thank the National Cancer Intelligence Network (NCIN) and the Office for National Statistics (ONS) for providing the data.
References
Supplementary materials
Supplementary Data
This web only file has been produced by the BMJ Publishing Group from an electronic file supplied by the author(s) and has not been edited for content.
Files in this Data Supplement:
- Data supplement 1 - Online figure
- Data supplement 2 - Online table
Footnotes
-
Contributors RA, IB and VB contributed to the conception and design of the study. RA, IB, NB, AF, MM, BC and VB contributed to the analysis and interpretation of the data. RA drafted the report, which was critically revised for important intellectual content by NB, MM, BC and VB. All authors approved the report. RA is guarantor.
-
Funding RA, IB, BC, AF and VB are employed by the Cancer Epidemiology Unit at the University of Oxford which is supported by Cancer Research UK. The sponsor of the study had no role in design and conduct of the study; collection, management, analysis and interpretation of the data; and preparation, review or approval of the manuscript.
-
Competing interests None.
-
Ethics approval This study was approved by the Oxford Research Ethics Committee.
-
Provenance and peer review Not commissioned; externally peer reviewed.