Article Text

Abstract
Objectives Reported associations of physical exposures during work (eg, lifting, trunk flexion or rotation) and low-back pain (LBP) are rather inconsistent. Mechanical back loads (eg, moments on the low back) as a result of exposure to abovementioned risk factors have been suggested to be important as such loads provide a more direct relationship with tissue failure and thus LBP. Since information on the effect of such load metrics with LBP is lacking yet, we aimed to assess this effect in a prospective study.
Methods Of 1131 workers, categorised into 19 groups, LBP was prospectively assessed over 3 years. Video and hand force recordings of 4–5 workers per group (93 in total) were used to estimate mechanical low-back loads (peak load and three cumulative load metrics, ie, linear weighted load, squared weighted load and load weighted to the tenth power) during manual materials handling (MMH) tasks using a video analysis method. These data were combined with static mechanical load estimates based on structured observation of non-MMH tasks. Associations of mechanical loads and LBP were tested using generalised estimating equations.
Results Significant effects on LBP were found for cumulative low-back moments (linear and squared weighted; both p<0.01 and ORs of 3.01 and 3.50, respectively) but not for peak and cumulative moments weighted to the tenth power.
Conclusions Results of this first prospective study on the effect of mechanical low-back load on LBP support a LBP aetiology model of cumulative loads, potentially due to accumulation of microdamage or fatigue. Therefore, prevention of LBP should focus on reducing cumulative low-back loads, especially in highly exposed occupational groups, for example, by reducing handling of heavy loads and working in awkward body postures.
Statistics from Altmetric.com
What this paper adds
-
Information on mechanical low-back load (eg, spinal compression forces or moments at the low back) in workers can be vital to gain knowledge on the aetiology of low-back pain (LBP).
-
However, prospective data on the effect of mechanical low-back load on the risk of developing LBP are not available in current literature.
-
This first prospective study on the effect of mechanical low-back load on LBP risk shows that cumulative low-back loads are predictive for the occurrence of LBP whereas peak loads did not reach significance.
-
These findings prompt stronger support for a model of LBP aetiology due to cumulative loads than for a model based on single peak loads.
-
Policymakers and ergonomic practitioners should therefore target on cumulative low-back loads when designing LBP prevention programmes.
Introduction
Epidemiological studies have contributed to our understanding of the aetiology of low-back pain (LBP). According to these studies, LBP is associated with personal risk factors (eg, age, smoking habits, physical capacity and body weight1), psychosocial risk factors (eg, stress, social support and job satisfaction2) and physical risk factors (during leisure time and at work). The effects of physical activity during leisure time on LBP are unclear as both negative and positive associations with pain have been reported.3 ,4 At the workplace, the effects of physical risk factors at work such as twisting, bending and lifting are more clear as they are the most frequently reported physical risk factors for LBP.5 ,6 However, it has also been argued that evidence concerning these physical risk factors of LBP is weak, possibly as a result of the use of measurement tools with low accuracy.3 Specifically, measuring low-back loads often relies on self-reports or observations that, although proven to be valid and reliable, can have weak associations with LBP.5 Such measurements often lack a clear description of all dimensions of the exposure to the risk factors, that is, duration, frequency and magnitude.7 Therefore, it can be argued that mechanical low-back load metrics (eg, spinal compression forces or moments at the low back) provide more information than low-back exposures (eg, the number of lifts or time spend in a flexed trunk position). One reason for this is that exposure metrics do not always have consistent relations with load metrics, as, for example, the mass lifted is a poor predictor of low-back moments.8 Furthermore, different exposures affect the same mechanical load. Therefore, mechanical loads can be expected to be more strongly associated with LBP.9 ,10
Several models for the causal chain of LBP aetiology have been proposed, all assuming that tissue failure due to low-back mechanical load is a cause of LBP.11 ,12 In general, two pathways for LBP can be considered: LBP may result from instantaneous tissue failure due to peak low-back loads. Or cumulative low-back loads could cause LBP, for instance, through accumulation of microdamage or through impaired coordination due to respiratory13 ,14 or neuromuscular fatigue.15 ,16 The predictive value of a variety of low-back loads for the risk of LBP has been assessed, showing that both cumulative9 ,10 ,17 and peak spinal loads10 ,18 are associated with LBP. These findings therefore militate in favour of both of the abovementioned causal models. However, results are based on retrospective studies or on prospective studies using exposure risk factors or crude estimates of mechanical loads rather than accurately assessed mechanical loads. Therefore, prospective studies in which mechanical load is thoroughly assessed are of paramount importance to gain more insight into the aetiology of LBP.
Although there is currently no gold standard for obtaining mechanical low-back loads in occupational field settings,7 video-based coding methods19 that assess postural data, which are subsequently used in biomechanical models estimating mechanical low-back load,20 ,21 are suitable for this purpose. These methods allow for obtaining accurate mechanical low-back load estimates without interfering with the worker's tasks. The video-based method that is used in the current study has been validated against a lab-based gold standard,20 and inter-rater reliability of this method has been assessed in the work field, showing inaccuracies of approximately 10%.22 The objective of the present study was to assess the effect of peak and cumulative low-back load metrics on LBP in a prospective cohort study using this video analysis method. To the best of our knowledge, there are currently no data available from prospective studies assessing mechanical low-back load accurately in work situations. Although we published about assessments of mechanical loads in a prospective study based on static observed postures,9 this procedure was rather crude and allowed us only to calculate cumulative loads. In contrasts, in the current study, a dynamic analysis of mechanical loads will be performed based on detailed video analysis, allowing more accurate (dynamic) estimates of cumulative loads, as well as estimates of peak loads.
Moreover, it is not yet clear how, in calculating cumulative loads, repetition of loading should be weighted relative to load intensity. As suggested before,23 ,24 it is likely that the magnitude of peak loads has more impact on the risk of failure than the number of times a load occurs. Therefore, several weightings in the calculation of cumulative loads have been proposed, including raising the loads to a certain power, for example, squared,25 fourth-order26 and even tenth-order weighting.25 A higher-order weighting reflects a higher importance of load intensity compared with the number of loading cycles. In the current study, the effect of several weightings for cumulative loading will be tested, that is, linear weighting, squared weighting and tenth-order weighting, where the latter two are expected to have a higher predictive value for LBP.
Methods
Population and data collection
Data used in this study were collected as part of the SMASH study that was described in more detail before9 ,27 and aimed to assess risk factors of musculoskeletal disorders. Briefly, workers from various industrial and service branches were studied during a baseline measurement, assessing physical load at the workplace and a baseline and 3-year follow-up assessment of musculoskeletal symptoms. Ethical approval for this study was obtained from the Netherlands Organization for Applied Scientific Research (TNO) ethics committee. Any identifiable subjects have provided their signed consent to publication and participants gave informed consent before taking part in the study. At baseline, personal and psychosocial factors and physical activity during leisure time were assessed using self-administered questionnaires. The occurrence of LBP was assessed using a Dutch version of the Nordic Questionnaire.28 LBP at baseline and during the three consecutive years of follow-up was defined when subjects reported regular or prolonged LBP in the 12 months prior to filling out one of the questionnaires.
During the baseline measurements that were carried out between March 1994 and March 1995, 1990 workers participated and 1802 (91%) of these workers completed the baseline questionnaires. Of these workers, LBP data in at least one of the years of follow-up were available of 1131 of them. All these workers filled in the LBP questionnaires at baseline and during the first year of the follow-up, while 1004 and 994 workers filled in the LBP questionnaires during the second and third year of the follow-up, respectively. Workers were classified into 19 groups a priori, based on physical exposure. For 371 workers (approximately 25% of all workers within each group), 5–15 min of video recordings at the workplace were taken at four randomly chosen moments during the course of 1 day. Furthermore, external forces at the hands during these periods were measured using force transducers (during pushing and pulling) or weighting scales measuring mass of the external load (for lifting tasks). Videos were observed during which manual material handling tasks (MMH tasks; ie, lifting, pushing and pulling tasks) were identified, yielding a total of 12 924 tasks. From each group, four or if available five workers were analysed to assess mechanical low-back load. As a result, 4872 MMH tasks of a total of 93 workers were selected (table 1), on average 58±103 MMH tasks per worker (range 0–534). Video recordings of these MMH tasks were used for the assessment of mechanical low-back load.
Descriptive statistics of the entire cohort (first column), the group of workers from whom video recordings were available (second column) and the group of workers mechanical loads were calculated from in the current study (third column)
Assessment of mechanical low-back load
Ten raters were recruited among students of the Amsterdam School of Health Professions and the Faculty of Human Movement Sciences of the VU University, Amsterdam. These raters participated in a 2-week learning and practice session. In this period, raters were familiarised with the software while they practiced in minimising their personal and inter-rater differences on the rating tasks by comparing and discussing their outcomes. After this session, each rater analysed videos of a selection of tasks. Raters analysed videos independently from each other and were asked to rate as many tasks as possible, including tasks that were not recorded optimally (eg, due to partial occlusion of the view). Furthermore, raters were blinded from the fact whether they rated a worker that had or had not reported LBP.
Videos of all 4872 MMH tasks were rated using a video analysis method that has been described extensively before and was tested on validity and interobserver reliability.19 ,20 ,22 Four key video frames were selected from each video while on each of these frames a manikin was fitted after which interpolation of body kinematics over the four frames were executed to estimate body kinematics. A top-down 3D inverse dynamics calculation using hand forces, segment kinematics (obtained from the interpolated manikin postures) and anthropometrics was performed to assess resultant moments at the level of the L5S1 joint. For each MMH task, peak moments were calculated and the maximal peak was obtained. Workers that did not perform any MMH tasks during the collection of video were assigned a peak load as obtained from an earlier calculation of mechanical low-back load.9 In this latter study, moments were calculated based on static postures while these postures were based on continuous structured visual observation of all video material of each worker.
For cumulative load, a time series for the complete video recordings of all subjects was constructed in which the abovementioned estimation of low-back moments based on observations for non-MMH tasks was added to moment time series of all analysed MMH tasks of the subject. Three kinds of cumulative moments were calculated: area under the curve, area under the squared curve and area under the curve to the tenth power. Outcomes were extrapolated to an entire work week (based on the length of the observation and the working hours per week). Of the four variables (peak load and three cumulative loads), group-based loads (in which average group load estimates are assigned to all members within each group) were calculated and were used as potential risk factors for LBP in further statistical analyses. To facilitate the interpretation of the ORs presented in the current study, the metrics were divided by 1·102, 1·105, 1·107, 1·1010 for peak moments, non-weighted cumulative moments, squared weighted cumulative moments and moments weighted to the tenth power, respectively. Calculations were performed using custom developed Matlab software (V.7.7.0).
Statistical analyses
All analyses were executed for the four load metrics separately. The crude effect of the mechanical low-back loads on LBP was assessed using univariate generalised estimating equations (GEE) with the load (as continuous variables) being the independent variable and LBP (dichotomous outcome of the four measurements—baseline and 3 years of follow-up) being the dependent variable. Furthermore, the contribution of a number of potential confounders was explored with multivariate GEE using a forward-stepwise selection procedure with the load being the independent variable and LBP being the dependent variable, as described above. Only confounders that led to a change of >10% in the beta depicting the effect of the mechanical load on LBP were included in the model.29 The following potential confounders were considered, based on previous studies9 ,27: age, gender, smoking habits, body mass index, physical activity in leisure time, quantitative job demands, decision authority, skill discretion, supervisor support, coworker support, work security, driving a vehicle during work and leisure time, sitting at work, flexion/rotation of the trunk during leisure time and moving heavy loads during leisure time. In the final four models, the effects of the potential risk factors adjusted for all potential confounders were assessed using multivariate GEE. As males and females might react differently to physical work load when it comes to LBP,30 we tested effect modification by gender. In case of a significant interaction effect of mechanical load and gender, the univariate analyses of mechanical loads and LBP were stratified for men and women.
In all GEE analyses, an exchangeable correlation matrix was used, taking into account the dependence of the four measurement moments. By doing this, the overall effects are corrected for the correlation between all measurement periods. Furthermore, the number of times a worker reported LBP is taken into account as the dependent variable is LBP at each available measurement moment. For example, a worker who reports LBP four times has more impact on the OR than a worker who reported LBP in only one of the four measurement periods.
Only for univariate models quasi-likelihood under the independence model criterion (QIC) were calculated, depicting the goodness of fit of the models; lower QIC values were interpreted as better fits.31 ORs and 95% CIs, and corresponding p levels were estimated for the mechanical low-back loads. p Values <0.05 were considered statistically significant.
To test the robustness of the current selection of five workers per group, we combined our data with 2339 MMH tasks (74 workers) that had been additionally analysed for other purposes (but were not uniformly distributed over the 19 groups), and we performed 25 random drawings of five workers per group. For each drawing, the effect of the four mechanical loads on LBP was assessed univariately as described above; p values of these effects were calculated. All statistical analyses were performed using SPSS (V.20).
Results
Out of all identified MMH tasks, 4168(86%) tasks were analysed. The remaining selected tasks could not be analysed due to unsatisfactory low quality of the video material (eg, partial occlusion of the view). On average, 52±90 tasks per subject were analysed, with an average external force measured at the hands of 72±60 N. Of these tasks, 3566 (86%) were lifting tasks, 450 (11%) were pushing tasks and 152 (3%) were pulling tasks. Of all 1131 workers of whom data on LBP were available, 399 (30%) reported LBP at baseline and 600 (53%) workers reported LBP in one of the four measurement moments.
Linear and squared weighted cumulative load had a significant effect on LBP, both in the univariate (both p<0.01) and in the analyses adjusted for confounders (both p<0.01; table 2). Cumulative loads weighted to the tenth power and peak moments did not have a significant effect on LBP, neither when effects were calculated univariately (p=0.70 and p=0.12, respectively), nor when adjusted for confounders (p=0.74 and p=0.73, respectively). Regarding the goodness of fit, a comparable pattern could be found since linear and squared weighted cumulative loads led to better fits compared with cumulative loads weighted to the tenth power and peak moments. Furthermore, squared cumulative loads led to a slightly better fit than linear weighted cumulative loads. In order to facilitate interpretation of these data, ORs adjusted for confounders for linear and squared weighted cumulative loads were used to calculate ORs corresponding with a difference in mechanical load of the groups with the highest mechanical load compared with the group with the lowest mechanical load. This calculation provided ORs of 3.01 and 3.50 for the two metrics, respectively.
Effects of mechanical low-back loads on LBP presented the four mechanical low-back load risk factors
Only the cumulative loads weighted to the tenth power showed a significant interaction effect of mechanical load and gender on LBP. Therefore, in an additional test, the effect of this variable on LBP was assessed separately for men and women showing ORs of 1.03 (0.90 to 1.17) and 4.16 (1.05 to 16.50), respectively.
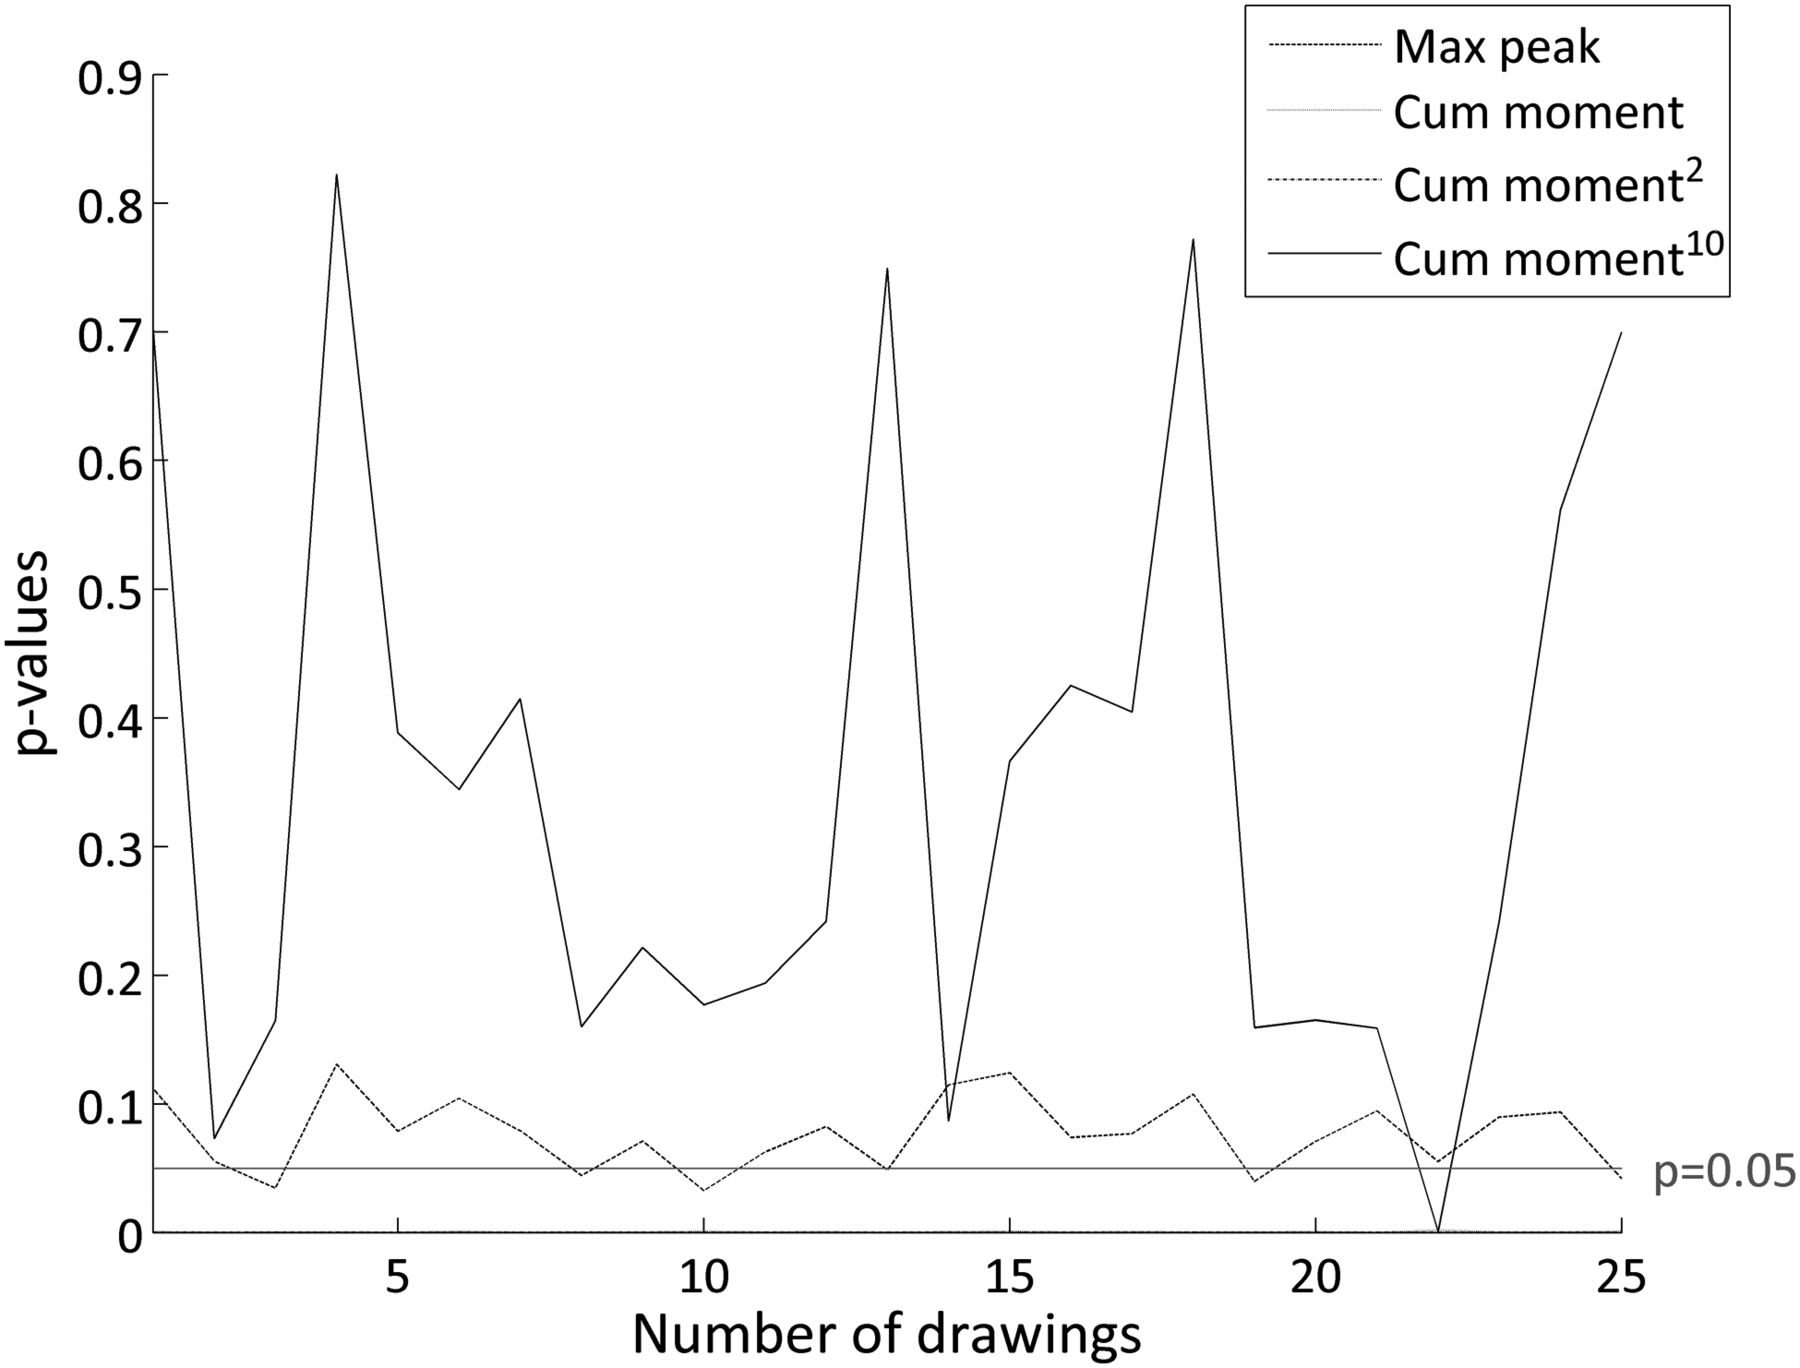
The robustness analysis of the four mechanical load metrics showed that the estimate of the linear and squared weighting of cumulative loads were robust as comparable p levels (all <0.01) were shown for all drawings (figure 1). The effect of peak loads was moderately robust, leading to univariate significant effects (p<0.05) in 6 out of the 25 drawings. However, the tenth power weighting of cumulative load was not robust, with a significant effect in 1 out of the 25 drawings and p values ranging from <0.01 to 0.87.

Univariate effect of the four mechanical low-back loads on low-back pain during 25 random drawings of five subjects per group. Note that all drawings for linear and squared weighted loads have rather small p values (all p<0.01) and are therefore hard to distinguish. A level of significance p=0.05 is indicated by the grey line.
Discussion
From our results, it can be concluded that cumulative loads are strong predictors of LBP. These findings are in line with the model of LBP aetiology due to accumulation of microdamage and with previous studies showing associations of cumulative mechanical back loads with LBP.10 ,17 In contrast to these studies, results from our study are based on a prospective study measuring mechanical loads objectively in a valid and reliable way. Despite the fact that we showed previously that in vitro failure of spine segments during repeated loading at a constant load levels is best predicted when using a tenth power of load level,25 this metric did not have a significant effect on LBP in our data. The higher the order of the weighting, the larger the contribution of load magnitude to the risk estimate compared with the frequency of loading. The latter study was based on a mechanical load protocol applied on in vitro material. In vitro material lacks the potential to repair microdamage, which would cause an overestimation of the importance of the loading frequency. On the other hand, in vitro testing does not take into account that the risk of low-back injury may increase when respiratory or neuromuscular fatigue causes impaired coordination.13–16 This leads to an underestimation of the importance of the temporal characteristics of loading. As we show here that squared weighting load has, but load weighting to the tenth power does not have an effect on LBP, the latter characteristic of in vivo conditions may play an important role here. However, this reasoning may be premature since the lack of predictive value of the tenth power weighting might also be a result of the fact that the metric is highly affected by inaccuracies in the measurements or actual variation in the work pattern. This can also be deduced from the non-robust nature of the effect of this metric on LBP (figure 1).
As has been suggested before, it is likely that the magnitude of peak loads has more impact on the risk of failure than the number of times a load occurs.23 ,24 This led us to predict that, in the calculation of cumulative loads, weighted peak loads would be more predictive of LBP than non-weighted peaks. Because squared cumulative loads tended to have a slightly better fit than linear weighted cumulative load, the use of such weighting is recommended for future studies. It should be kept in mind that the design of the present study, with group-based averaging of load metrics and a long follow-up period for the assessment of LBP, does not allow any inference on the importance of occasional peak loads leading to acute injury and pain. In the present study, peak moments did not have an effect on LBP. Although this lacking effect was moderately robust leading to significant effects in some cases of the repeated drawings univariately, effects were highly non-significant when adjusted for confounders. Therefore, our findings provide stronger support for the cumulative load-induced tissue failure model than for the peak load-induced tissue failure model. A difference in mechanical load corresponding with a difference of the groups with the highest mechanical load compared with the group with the lowest mechanical load can be interpreted with ORs of 3.01 and 3.50 for linear and squared cumulative loading, respectively. These values suggest substantial risks of LBP in the group of workers with the highest mechanical loads (mainly road workers with high external forces). Moreover, the calculated ORs are higher than pooled ORs reported in earlier studies for exposures metrics.5 Therefore, the present results are in line with earlier studies suggesting higher associations for mechanical loads as compared with exposure metrics.9 ,10 We add to this knowledge because in our study mechanical low-back load was assessed in a highly accurate way rather than using crude estimates as in the latter studies. As mechanical loads are especially high in certain job groups (in this case, the road workers), prevention of LBP should therefore mainly be targeted at reducing cumulative low-back loads in these occupations. Cumulative loads are for a share caused by handling of heavy loads, working in awkward body postures (ie, working in a trunk flexed posture combined with trunk rotation) and by large distances of loads handled with respect to the low back. Prevention should thus be targeted on such situations. It is known from previous studies that training workers in lowering their low-back load has not been successful reducing LBP.32 In an attempt to reduce low-back loads of workers, priorities therefore might be put at changing work situations, that is, adjustments to work stations, or changes in work shifts.
The strength of the present study is that the results are based on a large prospective cohort study and that, for the MMH tasks, low-back loading was assessed more accurately than in epidemiological studies performed thus far. Furthermore, the current study is based on an assessment of mechanical load that has been proven to be valid20 as well as reliable among raters in field settings.22 Furthermore, raters in the current study were extensively trained on rating the MMH tasks. However, the video analysis method contains some limitations. Only MMH tasks were assessed with the current method, while moments during the remaining part of the video recording were estimated, based on static postures obtained from postural observation categories.9 This was performed under the assumption that the highest mechanical loads derive from MMH tasks. However, from the current data, it cannot be ruled out that a source of bias is introduced due to this procedure. Therefore, when future techniques allow for continuous measurement of mechanical loads, improvements in the predictive value of mechanical loads can be expected. Furthermore, the video analysis used may yield occasional large errors, for example, due to inherent inaccuracies in manikin fitting (that are amplified in tasks of very short duration). These inaccuracies can originate from occlusion of the view or in highly non-sagittal plane recordings. However, these errors were shown to have a random character.20 ,22 As multiple MMH tasks per subject were assessed and as group-based values were calculated in a pool of workers, these random errors are likely to be diminished. However, as has been indicated above, such errors are amplified when using higher-order weighting in cumulative load calculations.
The first data collection of the presented results started in 1994. One may advocate that physical work load has changed since (eg, less physical activity and more office work33 or an older workforce34). Although this may slightly alter the external validity of our results, we believe that the most important aspect of studying the aetiology of LBP is to measure both the load and the outcome within a wide range of values. As we adequately did so, we believe that we present a valid assessment of the aetiology of LBP.
It was shown in our study that there was effect modification by gender only for the cumulative load weighted to the tenth power. However, as we have shown that the univariate effect of cumulative load weighted to the tenth power and LBP is highly non-robust, the current results are difficult to interpret. It has been shown before that there are multiple variables that might explain the different ways in which both genders react to physical work load.30 Therefore, based on the present results, we cannot exclude the presence of effect modification by gender on the association between mechanical load and LBP. The gender differences in the effect of mechanical loads on LBP should therefore be addressed in future research.
In the studied group of workers, a substantial amount of workers suffered from LBP at baseline. Since it is known that recurrence is a typical characteristic of LBP,35 excluding workers with pain at baseline seems rather arbitrary, as it is unknown whether these workers suffered from pain in previous years. Moreover, it would enhance the healthy worker effect and reduce the external validity of the results. In addition, excluding workers with LBP in the past would leave our study underpowered. Therefore, we chose to include this group of workers. As a consequence, our results refer to the prevalence of LBP, and not the incidence of pain. For the current study, the Nordic Questionnaire for the prevalence of LBP was used. Although this questionnaire has been tested extensively28 and is widely accepted and used in scientific literature, this assessment lacks some detail. For example, the classification of LBP does not distinguish different levels of pain or does not assess the impairment due to pain, as opposed to, for example, the von Korff pain scale.36
In this study, only a limited number of workers were assessed. Mechanical load data were obtained for 4–5 subjects per group, introducing the possibility of selection bias, as the rest of the 371 workers, from whom observational data were available, were not analysed. Such group-based approaches have been adopted before27 ,37 and have proven to be successful for the assessment of work load in several occupational tasks. Group-based estimates of work load have been shown to be more reliable than individual estimates,8 ,38 leading to higher predictive values,39 as individual random errors are reduced. These studies furthermore illustrate that, with an increase in the number of workers sampled, the work load estimate improves less when continuing to add more subjects, which suggests that measuring too many subjects when calculating group-based work load is inefficient. In a simulation study, it was furthermore shown that a total of five workers per group should be sufficient to obtain significant risk associations for LBP (unpublished data). Furthermore, from the data presented in figure 1, it can be concluded that, at least for the two significantly predictive cumulative load metrics, ORs and p values comparable to the ones we have reported are found when varying the selection of workers for low-back load assessment. The current selection of workers is therefore likely to be representative. Moreover, the selection of workers for whom low-back load was measured was highly comparable to the entire group of workers with respect to age, gender and prevalence of LBP (table 1). Therefore, selection bias is not likely to have had a strong impact in the present study. A final source of bias might have emerged from the fact that workers were video-taped at four randomly chosen occasions of the work day for a finite amount of time rather than during the whole work day. Distributing these four occasions over several days might have resulted in a more precise work load estimates, as work load will most likely vary more between days than within days.38 ,40 This issue was addressed by measuring several workers at different days in each group to obtain more precise estimates of the work load within groups.38 ,40 The appropriateness of our measurement strategy was furthermore supported by showing small within-group variability of observation-based exposure estimates in a previous study on the same population.37
From this first prospective study on the effect of mechanical low-back load on LBP, it can be concluded that cumulative low-back loads are predictive for the occurrence of LBP. However, a significant effect was not found for peak loads. Therefore, these findings provide stronger support for a model of LBP aetiology due to cumulative loads than for a model based on single peak loads. Information obtained from this study can teach us on the biomechanical aetiology of LBP. Such information can be of vital importance for policymakers and ergonomic practitioners when designing LBP prevention programmes. Based on our results, such programmes should focus on reducing cumulative low-back loads, especially in highly exposed occupational groups, for example, by reducing handling of heavy loads and working in awkward body postures.
References
Footnotes
-
Contributors All authors made substantial contributions to (1) the conception and design of the study, or acquisition of data, or analysis and interpretation of data, (2) drafting the article or revising it critically for important intellectual content, and (3) final approval of the version to be submitted. All authors have read and concur with the content in the manuscript. All authors, external and internal, had full access to all of the data (including statistical reports and tables) in the study and can take responsibility for the integrity of the data and the accuracy of the data analysis. PC conceived the study, performed the data analysis and drafted the manuscript. IK, CRLB, PMB and JHvD analysed the data and reviewed the manuscript for important intellectual content. JHvD is the guarantor.
-
Competing interests None.
-
Patient consent Patient consent was obtained during the data collection.
-
Ethics approval The Netherlands Organization for Applied Scientific Research (TNO).
-
Provenance and peer review Not commissioned; externally peer reviewed.