Article Text

Abstract
Aims: To identify the magnitude of and potential risk factors for violence within a major occupational population.
Methods: Comprehensive surveys were sent to 6300 Minnesota licensed registered (RNs) and practical (LPNs) nurses to collect data on physical and non-physical violence for the prior 12 months. Re-weighting enabled adjustment for potential biases associated with non-response, accounting for unknown eligibility.
Results: From the 78% responding, combined with non-response rate information, respective adjusted rates per 100 persons per year (95% CI) for physical and non-physical violence were 13.2 (12.2 to 14.3) and 38.8 (37.4 to 40.4); assault rates were increased, respectively, for LPNs versus RNs (16.4 and 12.0) and males versus females (19.4 and 12.9). Perpetrators of physical and non-physical events were patients/clients (97% and 67%, respectively). Consequences appeared greater for non-physical than physical violence. Multivariate modelling identified increased rates for both physical and non-physical violence for working: in a nursing home/long term care facility; in intensive care, psychiatric/behavioural or emergency departments; and with geriatric patients.
Conclusions: Results show that non-fatal physical assault and non-physical forms of violence, and relevant consequences, are frequent among both RNs and LPNs; such violence is mostly perpetrated by patients or clients; and certain environmental factors appear to affect the risk of violence. This serves as the basis for further analytical studies that can enable the development of appropriate prevention and control efforts.
- occupational violence
- physical assault
- non-physical violence
- work related
- RN, registered nurse
- LPN, licensed practical nurse
- CI, confidence interval
Statistics from Altmetric.com
Work related violence, defined as violent acts, including physical assaults and threats of assault, directed toward persons at work or on duty,1 has been recognised as a major problem. During 2001, 639 work related homicides occurred in the United States, making homicide the third leading cause of occupational fatality, overall, and the second leading cause for women.2 While there is an emerging literature pertinent to work related homicides, there is a serious deficiency in the knowledge of the magnitude of non-fatal work related violence and the associated risk factors. In a recent extrapolation from the National Crime Victimization Survey for 1993–99, it has been estimated that 1.7 million acts of non-fatal work related violence occurred annually.3 However, the true prevalence of work related violence is unknown.
Some of the most rigorous population based studies of work related violence, to date, have used data collected as a matter of public policy (for example, workers’ compensation claims, death certificates, etc), to identify the extent of the problem.4–10 While these primarily enable detection of only the most serious violent incidents—those resulting in extended loss of work time and/or death—they have provided a contribution to the knowledge base. A more recent effort, involving original data collection, incorporated a research design to identify risk factors for workplace violent injury, including homicide.11
From one study, the estimated annual rate of work related assault injuries for California, based on four months of California Employers’ Reports of Occupational Illnesses and Injuries (1 October 1994 to 31 January 1995),8 was 82.5 per 100 000 workers—over 60 times the total occupational homicide rate in California (1.3 per 100 000). In another study,9 an annual assault rate of 184.6 per 100 000 workers was estimated by reviewing California police reports and employer reports of non-fatal work related assaults.
In particular, hospital and health care workers have been found to be at high risk for violence, particularly non-fatal violence.8,12–16 In the California Employers’ study, an estimated non-fatal annual assault rate of 465 per 100 000 hospital workers, compared with 82.5 for all workers, was identified.8 Bensley and colleagues,12 who compared staff survey results, hospital incident reports, and Workers’ Compensation claims, identified respective rates, per 100 employees per year of 415, 35, and 14. Focusing only on workers’ compensation claims for fatal and non-fatal cases would have resulted in an important underestimation. Nurses account for an important proportion of hospital workers, and health care workers, in general. Although violence against nurses has been identified, specifically, as a major occupational problem,17–20 the magnitude of violence against this occupational group and potential risk factors have been largely unknown. A study of 1992 Minnesota Workers’ Compensation files found that nurses, alone, accounted for over 7% of the total workers compensated for work related assault resulting in more than three days of lost time and that women had an assault rate twice that of men.5
Previous studies have had a number of limitations, particularly those addressing violence against health care workers; assault has not been consistently defined or graded and most studies have been descriptive, primarily comprising patient care unit or institution specific case series. While informative, these studies provide limited knowledge of the frequency and consequences of and potential risk factors for, work related violence. This study was designed to address some of these limitations.
Main messages
-
High rates of both physical and non-physical violence were reported in a population of nurses.
-
Perpetrators were frequently described as being patients/clients, impaired, and male; perpetrators of physical and non-physical violence were, respectively, most often 66 years of age or older and 35–65 years of age.
-
Consequences of frustration, anger, and fear/anxiety/stress were reported by many nurses as a result of occupational physical and non-physical violence, with some reporting persistent problems, and changes in their work status, including quitting their jobs, because of the event.
-
Increased rates for both physical and non-physical violence were identified for working in a nursing home or long term care facility, and working in intensive care, emergency, or psychiatric/behavioural departments. Providing patient care and supervising patient care, as well as working with primarily geriatric patients, resulted in increased rates for physical violence.
METHODS
Study population
The study population, all licensed registered (RN) and practical (LPN) nurses in Minnesota, is one of the few professions at risk for violence for which a database of contact and some demographic information is available for selection of subjects.
Study cohort
This study examined the population of RNs (n = 57 388) and LPNs (n = 21 740) licensed in the state of Minnesota as of 1 October 1998 and was targeted towards those who worked in the 12 months before they began completing their survey. Besides name, licence type, and address, the state database included birth date, gender, and year of first licensure. Since licensing is required for both RNs and LPNs who practice in Minnesota, the study population was expected to be a dynamic cohort, but somewhat stable through time. A random sample of 6300 nurses was selected from the combined population (n = 79 128); 78% (4918) responded. For RNs and LPNs, the proportions were 80% and 74%, respectively. Adjusting for the eligible fraction of the entire sample had little effect on the response rate.
Definitions
Work related violence includes any activities (including travel) associated with the job or events that occur in the work environment involving the intentional use of physical force or emotional abuse against an employee resulting in physical or emotional injury and consequences. Besides physical assault, this includes non-physical forms of violence, including threat, sexual harassment, and verbal abuse. Physical assault occurs when one is hit, slapped, kicked, pushed, choked, grabbed, sexually assaulted, or otherwise subjected to physical contact intended to injure or harm. A threat occurs when someone uses words, gestures, or actions with the intent of intimidating, frightening, or harming (physically or otherwise). Sexual harassment occurs when one experiences any type of unwelcome sexual behaviour (words or actions) that creates a hostile work environment. Verbal abuse occurs when another person yells or swears, engages in name calling, or uses other words intended to control or hurt.
Policy implications
-
Voluntary guidelines to prevent work related violence among health workers have been available through the Occupational Safety and Health Administration since 1996; yet, in the current study, the nurses reported high rates of violence. Work related violence affects the employee, the employer, others in the work environment, and significant others outside the work setting; occupational violence has been associated with reduced productivity, increased turnover, absenteeism, counselling costs, decreased staff morale, and reduced quality of life.
-
Given the nursing shortage, administrators should consider the role that prevention and control of occupational violence could play in affecting the quality of the working environment and potential longevity of employment.
Data collection
The study involved two phases. Phase 1, the focus of this paper, was to estimate the frequency and consequences of work related violence and identify potential risk factors. Phase 2 used a case-control approach to identify specific risk factors for the assault related outcomes. After approval by the institutional review board, study data collection instruments and methods were pre-tested. Following minor modifications, phase 1 began.
Contact procedures
Initially, a packet was sent to the sample of nurses. This packet included a specially designed survey instrument pertinent to work related violence along with a letter inviting participation and providing informed consent, and a postage paid, return envelope. Up to four mailings were sent to maximise the response rate. If no response was received after these mailings, a final packet including a brief, one page survey, cover letter, and postage paid return envelope was sent in an attempt to ascertain only work related violence events and the most pertinent demographics.
Data collection instruments
The initial survey established: (1) during which of the previous 12 months, if any, the respondent worked in a nursing position in Minnesota; (2) demographic information such as race, years of experience, year of graduation, level of education (although also in the licensing databases, age and gender were collected); and (3) occurrence and specifics of relevant physical and non-physical work related violence events during the previous 12 months. This survey enabled participants to provide information about each event, including: date(s); descriptions of the perpetrator(s); surrounding circumstances and activities; locations of the event(s); diagnosis(es) or types of injury(ies) and anatomical locations; relevant length of restrictions on activities; lost work time; medical treatment sought or self administered; and other consequences. It also facilitated determination of eligibility of the respondents (that is, practiced in Minnesota during the relevant study period), whether the reported violence events met the definition of work related violence, and demographic and exposure information. A comprehensive diagram representing causal relations was used to define variables to be included in the data collection instruments.
Data analyses
Analyses began with basic descriptive statistics on the sample and the consequences of reported events, and crude estimates of event rates. Potential response bias was controlled by inversely weighting observed responses by probabilities of response, estimated as a function of characteristics (age, gender, licence type, and home address: metropolitan versus non-metropolitan area) available from the licensing database.21 The probability of being eligible among the respondents across these same characteristics was used to estimate the unknown eligibility among non-respondents.22 Validation procedures, reported elsewhere, were conducted for self reported physical assault injury occurrences through review of health care records23 and for workplace exposures through comparisons between respondent and employer reporting24 to facilitate assessment of potential bias.
An overall conceptual model for the occurrence of work related violence events was first developed, based on previous knowledge and using the framework of the general epidemiological model—that is, the dynamic interactions of a host, agent(s), and vehicles (or vectors) within the environment; this conceptual model served as the basis for a more detailed causal model that guided instrument development and, when represented as a directed acyclic graph (DAG), study analyses. The ultimate goal of the data analyses was to estimate the causal impact of the above factors on violence, controlling for important confounding factors. Selection of confounders for multiple logistic regression was based on the DAG (fig 1), following the methods described by Greenland and colleagues25 and Maldonado and Greenland,26 and illustrated by Hernan and colleagues.27 For a particular multiple logistic regression, the variables included beyond the exposure of interest and the outcome of violence are the sufficient set of confounders required to block all “backdoor pathways” from the exposure of interest to the outcome. These variables will adjust for potential confounding and, at the same time, avoid bias from variables that are located in the causal pathway between the exposure of interest and the outcome. To include all sources of uncertainty, confidence intervals for annual incidence per person estimates and regression coefficients were calculated by bootstrapping the entire estimation procedure, including weighting for non-response.28
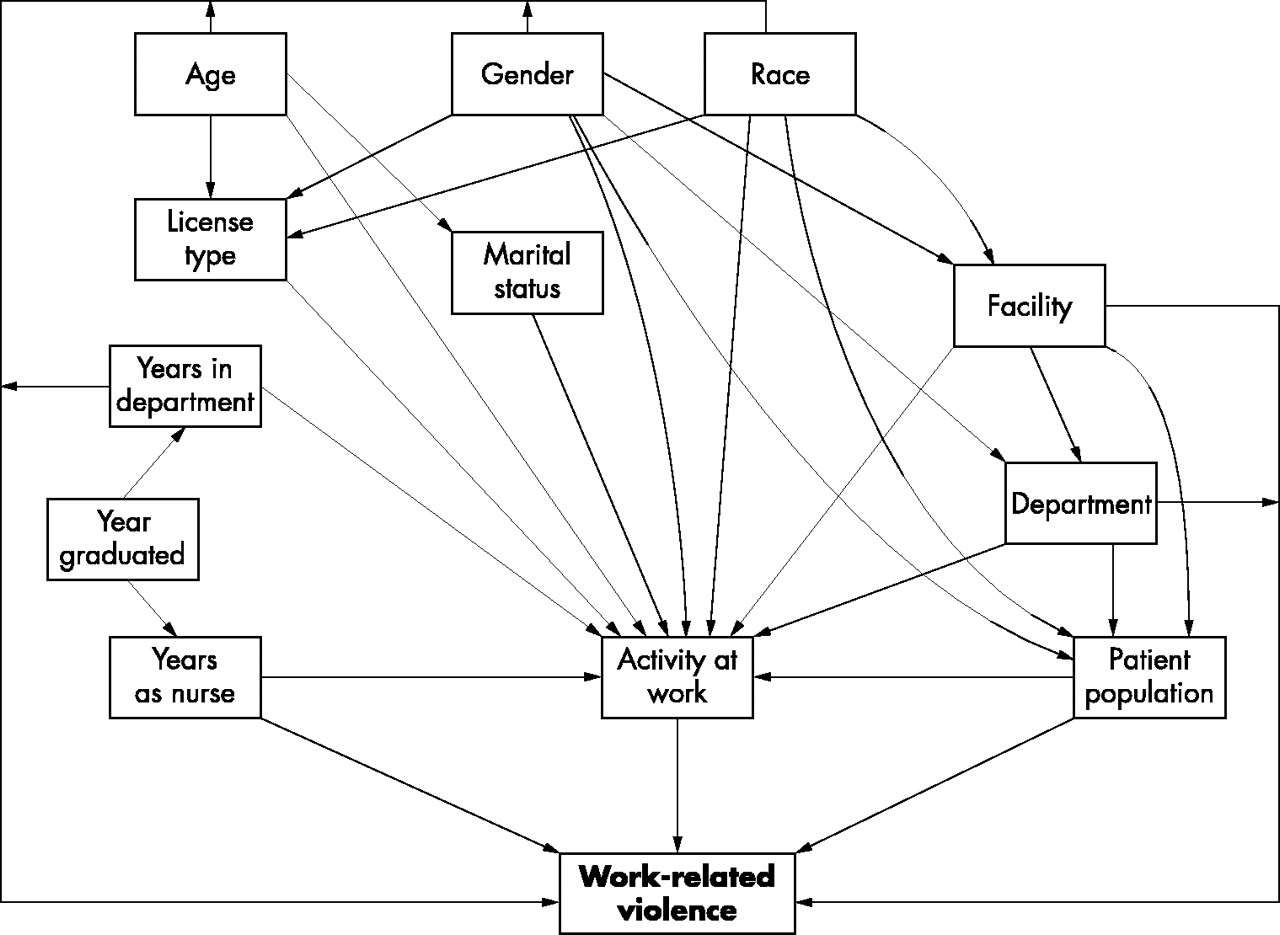
Directed acyclic graph, based on causal model, to select confounders for multiple logistic regression analyses of work related violence: the Minnesota Nurses’ Study.
RESULTS
Table 1 presents characteristics of the comprehensive phase 1 study participants. Among participants, nearly all were women (96%), the average age (SD) was 46 years (10.1), and 75% were RNs. The highest level of nursing education was most commonly a diploma (39%), followed by associate (28%), and bachelor’s (26%) degrees.
Comprehensive phase participant characteristics and exposures: the Minnesota Nurses’ Study
Also shown in table 1, the most frequently reported primary work facilities were: hospital inpatient; nursing home or long term care; and clinics/health care provider offices. Most nurses reported their primary facility was privately owned, compared with ownership by a city/town, county, state, or federal agency. The primary departments in which nurses most often worked were medical/surgical, followed by public health/home care, family practice, and psychiatric/behavioural, operating/recovery, and intensive care. Primarily, nurses worked with non-geriatric adults or geriatric patients. Most nurses reported their primary professional activity as providing patient care.
There were 711 physical assault events reported by 476 nurses who completed full surveys; one, two, three, four, or “ongoing” events were reported, respectively, by 280, 81, 29, 32, and 54 nurses. Adjustment for potential response bias resulted in an assault rate of 13.2 per 100 persons per year, overall (table 2), reflecting a minimal increase from the unadjusted rate. For RNs and LPNs, respectively, the adjusted rates (12.0 and 16.4) differed by a similar amount from the unadjusted. Adjusted rates (95% confidence intervals, CIs) for males and females (not shown) were 19.4 (13.8 to 25.9) and 12.9 (11.9 to 14.0), respectively. Overall, 75% of those who reported physical assault also reported non-physical violence, and among those who reported non-physical violence, 25% also reported at least one physical assault event. Also shown in table 2, the adjusted overall non-physical violence rate of 38.8 was slightly higher than the unadjusted rate. For LPNs and RNs, the adjusted rates were 38.5 and 39.7, respectively, again differing only slightly from the unadjusted rates. Adjusted rates (and 95% CIs) for males and females were 45.0 (37.6 to 52.9) and 38.5 (37.0 to 40.1), respectively. Within the overall category of work related non-physical violence, over 7% of nurses reported sexual harassment, 17% reported threats, and nearly 34% reported verbal abuse in the previous 12 months. The time period over which the non-physical violence occurred ranged from identification as a single event (30%) to those involving repetitive/continuous behaviours for greater than nine months or more (36%); at the time of the study, 46% indicated that the behaviour was continuing.
Work related violence rates: the Minnesota Nurses’ Study
In table 3, reporting is based on physical and non-physical violence (threats, sexual harassment, and verbal abuse events). Reported violence could be either a specific event, with a short duration, or it could be an ongoing event, that occurs daily over many days, weeks, or months. It is shown that the majority (over 90%) of physical violence was perpetrated by patients/clients, while perpetrators of non-physical violence were more varied and included patients/clients (67%), as well as doctors, patients’ visitors, other employees, and supervisors. The majority of perpetrators associated with physical violence was described as: impaired because of disease/illness (>80%), or prescribed medication (18%); male; and 66 years of age or older. Only 8% were perceived as not impaired. In contrast, perpetrators associated with non-physical violence were less frequently perceived as impaired because of disease/illness (41%) or prescribed medication (12%). They were also primarily male; however, a greater proportion were younger (35–65 years of age) than those associated with physical assault.
Characteristics of perpetrators associated with physical and non-physical violence: the Minnesota Nurses’ Study
By location (not shown), the physical assaults identified as specific and ongoing events, respectively by percentages, occurred in: patient rooms (61; 72); hallways (20; 37); reception, lobby, or lounge areas (8; 11); nursing stations (4; 13); procedure or examination rooms (5; 0); bathrooms (2; 20); classroom or meeting rooms, offices, and elevators (each less than 1 for both categories); and other (1; 0). Locations/sources of the behaviours associated with non-physical violence events, by percentages, were face-to-face (90), telephone (16), email/mail (2), and other (3). Anatomically, physical assaults for specific events and ongoing events, respectively, by percentages primarily involved were: arm/elbow/wrist (47; 70); hand/finger/thumb (13; 33); face (13; 26); leg (8; 20); head/skull/brain (5; 7); and external chest (6; 2). The resulting types of physical injuries (specific or ongoing events) reported most frequently were bruises/contusions (33; 48); temporary discolorations/slap marks (22; 26); cuts/lacerations/scratches, or abrasions (28; 44); and bites/punctures (5; 20). No overt physical injury was identified for some of the events (19; 11), despite the fact that the events were reported according to the definition of physical assault.
The “instruments” used in the physical assaults (not shown), for specific and ongoing events, respectively by percentages, were hands/arms (87; 91); feet/legs (39; 63); teeth (15; 31); body fluids, including spitting (7; 19); knives (<1; 2); genitals (<1 for both categories); and other (<1 for both categories).
In table 4, reporting of consequences is based on physical (specific or ongoing events, respectively) and non-physical violence. It is noted that very small proportions of either the physical assault or non-physical violence cases were hospitalised. Some reported self-treatment of their injuries, while others sought care from health care providers; large proportions reported having no treatment.
Consequences and characteristics of physical and non-physical violence: the Minnesota Nurses’ Study
The most commonly reported consequences of both physical and non-physical violence were frustration, anger, fear/anxiety/stress, and irritability, with much greater proportions reported for non-physical violence for each of the consequences (table 4). Although 8% of nurses who were physically assaulted reported persistent problems as a result of the event, nearly 13% who experienced non-physical violence reported persistent problems. While less than 10% of those experiencing physical violence reported subsequent changes in their work status, nearly 22% among those who experienced non-physical violence reported changes, including 6% who quit as a result (table 4).
Only 27% of nurses perceived violence to be a problem in their work environment; 15% were unsure (not shown). However, over 52% perceived violence against nurses to be preventable; 12% indicated it was not preventable, and 34% were unsure. For specific and ongoing physical violence events, 69% and 65%, respectively, were reported to someone either only orally (39% and 31%), only in writing (15% for each), or both orally and in writing (15% and 19%). A similar percentage (71%) who reported non-physical violence was identified: 47%, only orally; 6%, only in writing; and 18% both orally and in writing. Reasons given for not reporting the physical events (both specific and ongoing) and non-physical events included, respectively: (1) considered it part of the job (45% and 44%); (2) considered it a minor or isolated incident (32% and 8%); (3) perceived it as unnecessary to report (14% and 17%); (4) non-supportive environment (5% and 30%); and (5) “too busy” (3% and 2%).
Table 5 presents results of multivariate modelling of several exposures of interest, using directed acyclic graphs that were based on a causal model. Multiple logistic regression analyses identified increased odds ratios, respectively, for both physical and non-physical violence for: working in a nursing home or long term care facility (2.6; 1.5); working in intensive care (1.5; 1.3), psychiatric/behavioural (2.1; 2.8), or emergency (2.5; 3.1) departments; and splitting time equally between patient populations (1.5; 1.3). In addition, odds ratios for working primarily with geriatric patients were increased pertinent to physical assault (2.3) and suggestive for non-physical violence (1.2). Decreased rates for both physical and non-physical violence were identified for working in a combined category of facilities including schools/colleges/universities, independent practice/consulting, insurance/utilisation review, industry, split time, and other (0.4; 0.7), as well as in a clinic/health care provider offices (0.2; 0.6) or public health/home health agencies (0.2; 0.6).
Multivariate analyses of environmental exposures: the Minnesota Nurses’ Study
Additional important changes, pertinent to physical violence, included: increases in odds ratios for providing patient care (1.9) and supervising patient care (1.8); decreases for working in a hospital or non-hospital outpatient facility (0.4), or in operating/recovery (0.4) or public health/home care, school health, or education/research departments (0.5), and working primarily with neonatal/paediatric/adolescent populations (0.6). Other changes for non-physical violence rates, were increases for working primarily in departments involving occupational health and splitting time equally between two departments, or other (1.3).
DISCUSSION
This comprehensive population based effort enabled identification of the magnitude and consequences of and potential risk factors for work related violence among nurses. High rates of both physical (13.2) and non-physical violence (38.8) per 100 persons per year were identified. Due to different study methods, populations studied, and definitions of violence, other studies are not comparable.
Despite lack of direct comparability with other studies, some findings were similar with respect to physical violence. Males were more likely than females to experience violence,8,29–31 which may relate to differences in exposures. As in this study, younger age has been associated with an increased likelihood of incurring an occupational assault.5,32,33
For both physical and non-physical violence, working in a nursing home/long term care/rehabilitation facility increased risk the greatest in this study, based on multivariate modelling. Consistent with the current findings, working in psychiatric18,34 and emergency35 departments has been identified previously as placing persons at greatest risk of work related violence. However, in this study, increased rates were also identified for working in intensive care departments for both physical and non-physical violence; increased rates for working in occupational health or splitting time between departments were identified for non-physical violence only. Providing or supervising patient care (compared with not being involved in such care), showed an increased risk for physical violence.
Patients/clients were reported most frequently as the source of physical (96%) and non-physical (67%) violence; for physical violence, this is consistent with previous reports.33,34,36–39 Perpetrators were more likely male, agreeing with findings by Eisele and colleagues;40 however, perpetrators were more often male for non-physical than physical violence. Based on multivariate modelling, working with geriatric populations increased the risk for physical violence and was suggestive for non-physical violence. Cognitive impairment of the perpetrator has been identified previously;20,41–47 however, in the current effort, the proportions of perceived impairment of the perpetrator are much greater for physical than non-physical violence.
Work related violence affects the employee, the employer, others in the work environment, and significant others outside the work setting. Adverse consequences of violence reported in the current study are similar to those reported by others.31,45,48–53 Occupational violence has been associated with reduced productivity, increased turnover, absenteeism, counselling costs, decreased staff morale, and reduced quality of life.45–51 Simonowitz51 described the most obvious consequences of work related violence—physical injury, disability, and other physical effects, such as sleeplessness. Levin and colleagues54 found that work related violence resulted in short and long term physical, personal, emotional, and professional effects. Changes in job performance and morale, chronic pain, muscle tension, loss of sleep, nightmares, and flashbacks were among those symptoms reported, in addition to physical consequences. Others identified consequences including: family disruption, career change, fear of recurrent assault;55 anxiety, helplessness, irritability, soreness, sadness, depression, shock, disbelief that the assault occurred, and sympathy for the patient who committed the assault.45,53 Even in the absence of injury, some assaulted staff experienced moderate to severe reactions for six months to one year. Caldwell52 documented that, among 224 clinical mental health staff, 61% experienced symptoms of post-traumatic stress disorder (PTSD), symptoms also identified in the current study. Findorff-Dennis and colleagues56 found that the consequences of violence appeared to continue long after the event occurred. Through a case study design, it was found that workers’ health and quality of life were affected and resulted in job changes, chronic pain, changes in functional status, and depression four years after the assault.
The consequences of non-physical violence reported in this study deserve particular attention, as these consequences appeared to be more severe than for physical violence. This is not to minimise the problem of physical violence but, rather, to highlight the fact that the effects of non-physical violence must not be neglected. Individuals who experience non-physical violence, and endure feelings/symptoms over time, may be at risk for adverse mental health outcomes such as acute stress disorder or post-traumatic stress syndrome.57 In particular, the adverse work effects were greater for non-physical violence than for physical assault. This included outcomes of restricted or modified work, quitting, and transferring and obtaining a leave of absence. Attention to the facilities, departments, patient populations, and activities that place these workers at risk is important and requires attention from employers. Moreover, consideration needs to be given to adaptation of prevention strategies to the specific types of violence. Given that physical assaults are perpetrated almost exclusively by patients, the majority of whom are impaired, and 66 years of age or older, suggests that patient care activities for the relevant subgroup of nurses must be investigated closely for specific risk factors and potential interventions (for example, flagging the chart of a violent patient, assigning two care providers, or using appropriate strategies for a combative patient). Conversely, for non-physical violence, while many patients were perpetrators, 33% were not; they were supervisors, physicians, visitors, and other employees. Risk factors and interventions for verbal abuse, threats, and sexual harassment suggest a need for creating a culture of respect in the workplace through relevant strategies. Given the nursing shortage,58 hospital and health care administrators may want to consider the role that prevention and control of work related violence could play in affecting the quality of working life for nurses. Results from a survey of registered nurses conducted by the American Nurses Association59 revealed that health and safety concerns played a major role in nurses’ decisions to remain in the profession.
Limitations in the current study include the fact that participants self reported violence and relevant exposures; thus, there were potential biases. Numerous strategies were implemented to minimise these biases. Attempts to minimise recall bias included limiting recall of violent events to the previous 12 months60 and recall of exposures to a one month period within the preceding year39—approaches that have been utilised in previous studies. To further minimise information bias, nurses were followed up by mail to clarify ambiguous or missing information, as necessary. Validation substudies, relevant to environmental exposures and health care treatment were also conducted to determine potential measurement error.23,24 Potential response bias was controlled for by inversely weighting observed responses by probabilities of response estimated as a function of characteristics available from the licensing database.21 The probability of being eligible among the respondents across these same characteristics was used to estimate the unknown eligibility among non-respondents.22 To minimise the effect of confounding, selection of confounders for multiple logistic regression was based on directed acyclic graphs.25
This study is among the first such comprehensive efforts to identify the magnitude of the violence problem and potential risk factors in a major occupational population of nurses. It also serves as the basis for future analytical studies that can enable identification of specific risk factors and serve as the basis for development of appropriate prevention and control efforts.
Acknowledgments
Support for this effort was provided, in part, by the National Institute for Occupational Safety and Health, Centers for Disease Control and Prevention, Department of Health and Human Services (R01 OH03438); and the Regional Injury Prevention Research Center, and Center for Violence Prevention and Control, Division of Environmental and Occupational Health, School of Public Health, University of Minnesota, Minneapolis, Minnesota. Collaborating organisations included: Minnesota Hospital and Health Care Partnership; Minnesota Nurses’ Association; and Minnesota Licensed Practical Nurses’ Association.
Portions of this paper were presented at the following: American Public Health Association (APHA) Annual Meeting, Chicago, Illinois, 1999; National Occupational Injury Research Symposium (NOIRS) 2000, Pittsburgh, Pennsylvania, 2000; American Public Health Association Meeting, Atlanta, Georgia, 2001; International Congress of Epidemiology, Toronto, Canada, 2001; Sixth World Conference on Injury Prevention and Control, Montreal, Canada, 2002; Academy for Health Services Research and Policy: Annual Research Meeting, Washington, DC, 2002; Society for Epidemiologic Research (SER), Palm Desert, California, 2002; 16th EPICOH Congress on Epidemiology in Occupational Health, Barcelona, Spain, 2002; American Public Health Association, Philadelphia, 2002; Minnesota Health Services Research Conference, Minneapolis, 2003; American Occupational Health Conference, Atlanta, Georgia, May 2003; National Occupational Injury Research Symposium (NOIRS) 2003, Pittsburgh, Pennsylvania, 2003.