Article Text

Statistics from Altmetric.com
Availability of high-quality estimates of the absolute difference in effectiveness between alternative treatment options is crucial to the application of evidence-based healthcare to populations of patients and corresponding decisions. One framework for assessing confidence in estimates of the effect of alternative management strategies on patient-relevant outcomes within the Grading of Recommendations Assessment, Development and Evaluation (GRADE) system1 is summarised by Spencer et al.2 In this article we single out one of the five domains of the GRADE system, namely imprecision.
Often, the best available evidence for the absolute difference in effectiveness between a treatment under consideration and a standard regime does not come from a single study, but from two totally separate sources. Sometimes, an estimate of the relative risk (RR) of the outcome of interest between the two treatment options is available from a meta-analysis combining evidence from several randomised trials. Owing to the larger sample size available, this will in general have greater precision than an RR derived from a single study. In most contexts, estimates of relative effect of a therapy are more consistent across different baseline risks than absolute effect estimates.3 Consequently, it is a common practice in systematic reviews to report a pooled estimate of the RR, rather than the absolute risk difference (RD).2
To convert an RR into an absolute RD, we also require an estimate of the baseline risk (BR), the rate of occurrence of the event of interest when the standard treatment is used. The absolute RD is then calculated from the BR and RR using the formula RD = BR×(RR−1).
In most applications, the RR is below 1, representing a reduction in risk due to the intervention. The calculated RD is then negative. Sometimes, the RR may be greater than 1, representing an increase in risk due to the intervention. The calculated RD is then positive.
Spencer et al2 noted that the calculations currently performed under the GRADE framework take into account the imprecision of the RR estimate, but not that of the baseline risk estimate. They concluded that evaluating uncertainty in baseline risk, and its impact on confidence in absolute estimates of treatment effect, remained an important outstanding issue. The purpose of this article is to describe a simple, effective method that may be used to take both sources of uncertainty into account.
All the quantities we concerned to estimate, such as the BR, the RR or the RD, are derived from series of patients of finite size. A CI is normally used to display the resulting uncertainty of such an estimate. CIs convey information about magnitude and precision of effect simultaneously, keeping these two aspects of measurement closely linked.4 ,5 In the great majority of instances, researchers calculate 95% CIs, as a common metric to quantify sampling imprecision.
Confidence limits for the RD may be calculated from those for the BR and RR by a procedure called Method of Variance Estimates Recovery (MOVER). This is a general approach that may be used to calculate CIs for sums and differences of two independently estimated quantities. MOVER may be extended to apply to products or ratios, but greater care is required. Neither an approach using logarithms of BR and (RR−1)6 nor the version of MOVER developed specifically for ratios7 is guaranteed to yield meaningful results when the CI for the RR can span 1, for reasons explained by Newcombe.8 An enhanced version described by Newcombe8 is designed to accommodate datasets with RR and corresponding confidence limits below 1, representing benefit, as well as above 1, representing harm.
While it is simple to calculate the RD from the BR and RR, the formulae to derive confidence limits for the RD from those of the BR and RR are quite complicated.7 ,8 However, there is no need for the user to perform any part of the calculations. An Excel spreadsheet ‘RD from BR and RR.xls’ to perform all the calculations described in this article is freely downloadable from: http://medicine.cf.ac.uk/primary-care-public-health/resources/
The calculations in the spreadsheet start with estimates of the BR and RR and the corresponding CIs. The RD together with its CI is then derived from these figures. If 95% CIs are used for the BR and RR, the resulting CI for the RD is also a 95% CI. The spreadsheet is designed to be a highly user-friendly resource, though needless to say, great care is needed with the negative numbers used to represent benefits.
An example where the intervention is beneficial
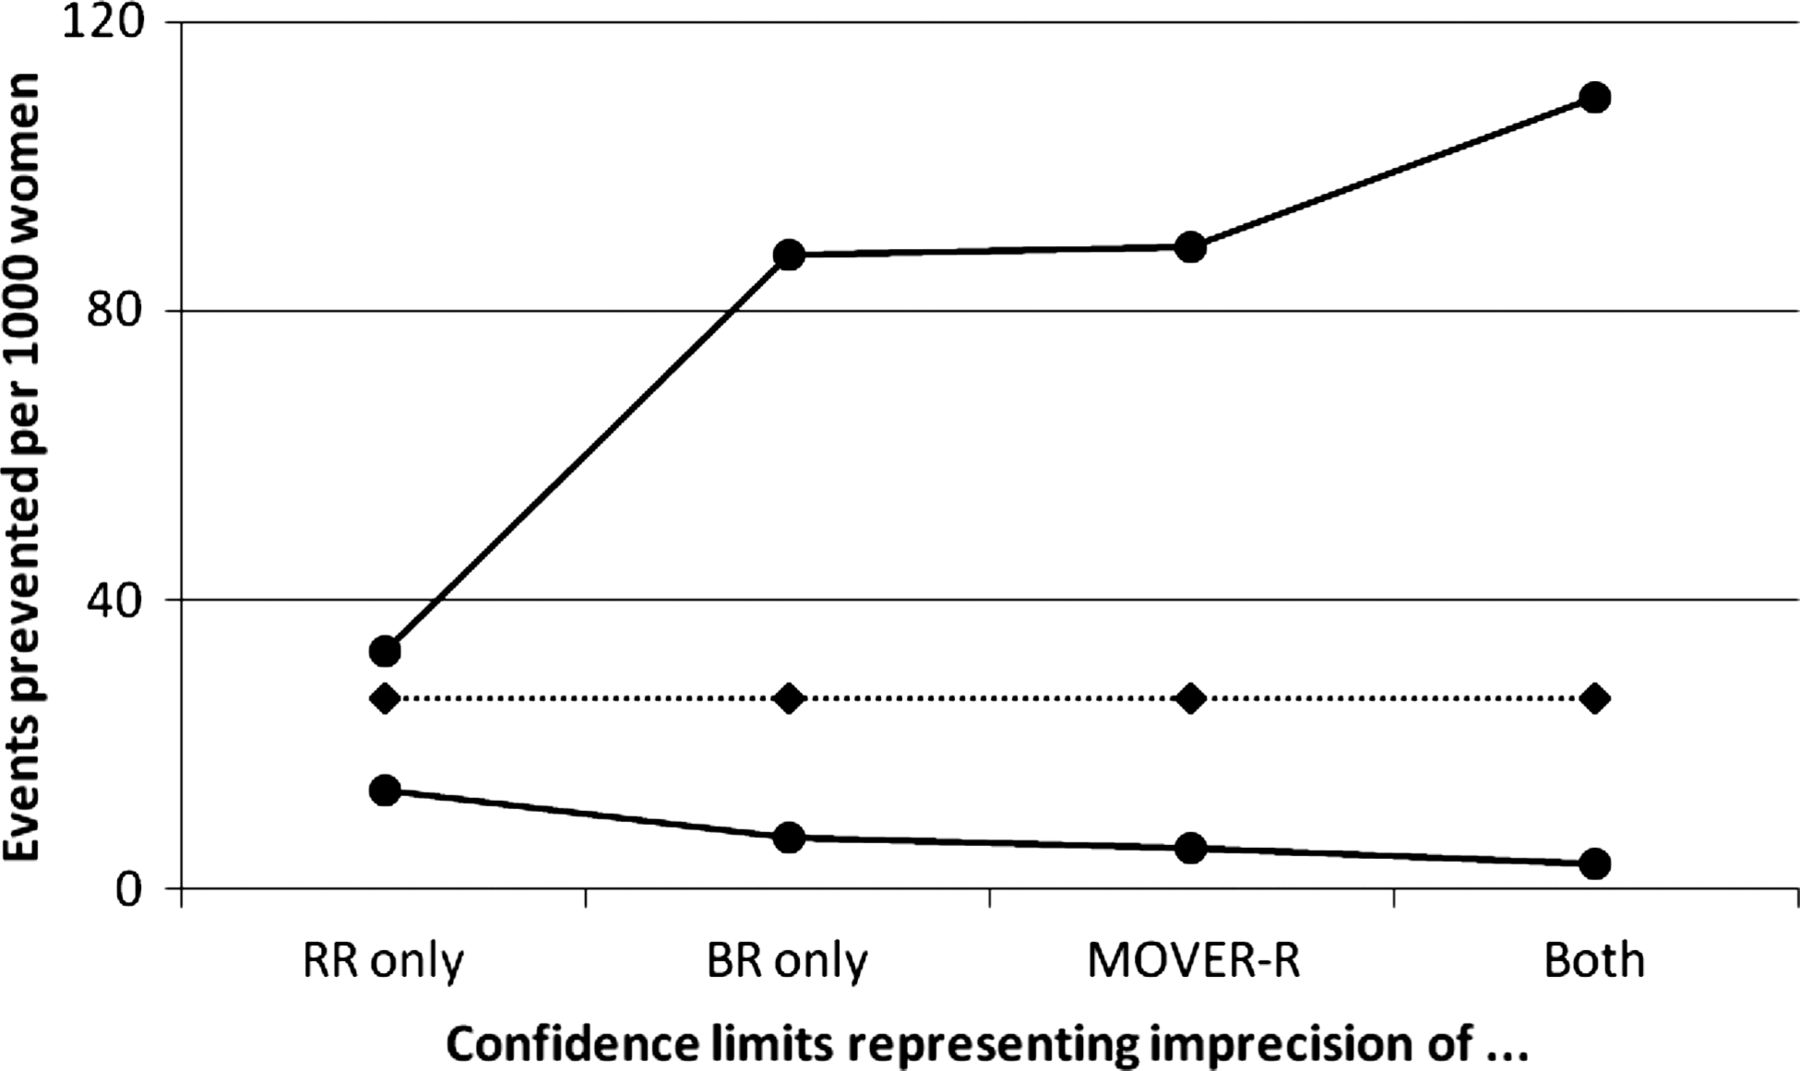
Spencer et al2 reported calculations taken from Bates et al9 relating to the use of low-dose, low-molecular-weight heparin (LMWH) to prevent venous thromboembolic events in women undergoing assisted reproduction who develop severe ovarian hyperstimulation syndrome. The RR used here is 0.36 (95% CI 0.20 to 0.67), taken from a meta-analysis. The baseline risk is 2/49=0.041, with 95% CI 0.011 to 0.137 calculated with the Wilson score method10 taken from a small Czech study.11 Bates et al9 combined the RR and BR here to give RD=0.041×(0.36–1)=−0.026, indicating that use of low-dose LMWH is estimated to prevent 26 venous thromboembolic events per 1000 patients treated. Bates et al9 reported 95% confidence limits of 13 to 32 events prevented. However, these limits take account of the uncertainty of the RR only. Spencer et al2 observed that the uncertainty of the BR should also be taken into account here, and reported a CI of 4 to 110 for the number of events prevented per 1000 women. These figures are obtained by directly combining the 95% confidence limits for the RR and BR, which leads to an unnecessarily wide interval. The correct 95% CI calculated by MOVER-R is −0.089 to −0.006, indicating prevention of between 6 and 89 events per 1000 women.
We could equally well construct a CI representing the uncertainty of the BR only, −0.088 to −0.007 here. Figure 1 displays all four 95% CIs for the RD, expressed as a risk reduction. In this example, the correct MOVER-R interval is very similar to the interval derived from that for the BR. Here, the BR is the dominant source of imprecision.

Absolute risk reduction (expressed as events prevented per 1000 women) for effect of low-dose, low-molecular-weight heparin on venous thrombolic events, from Bates et al.9 Four 95% CIs are shown, (A) representing imprecision of relative risk (RR) only, (B) imprecision of baseline risk (BR) only, (C) a correct interval using MOVER-R and (d) calculated directly from upper and lower limits for both BR and RR.
An example where the interventionincreases risk
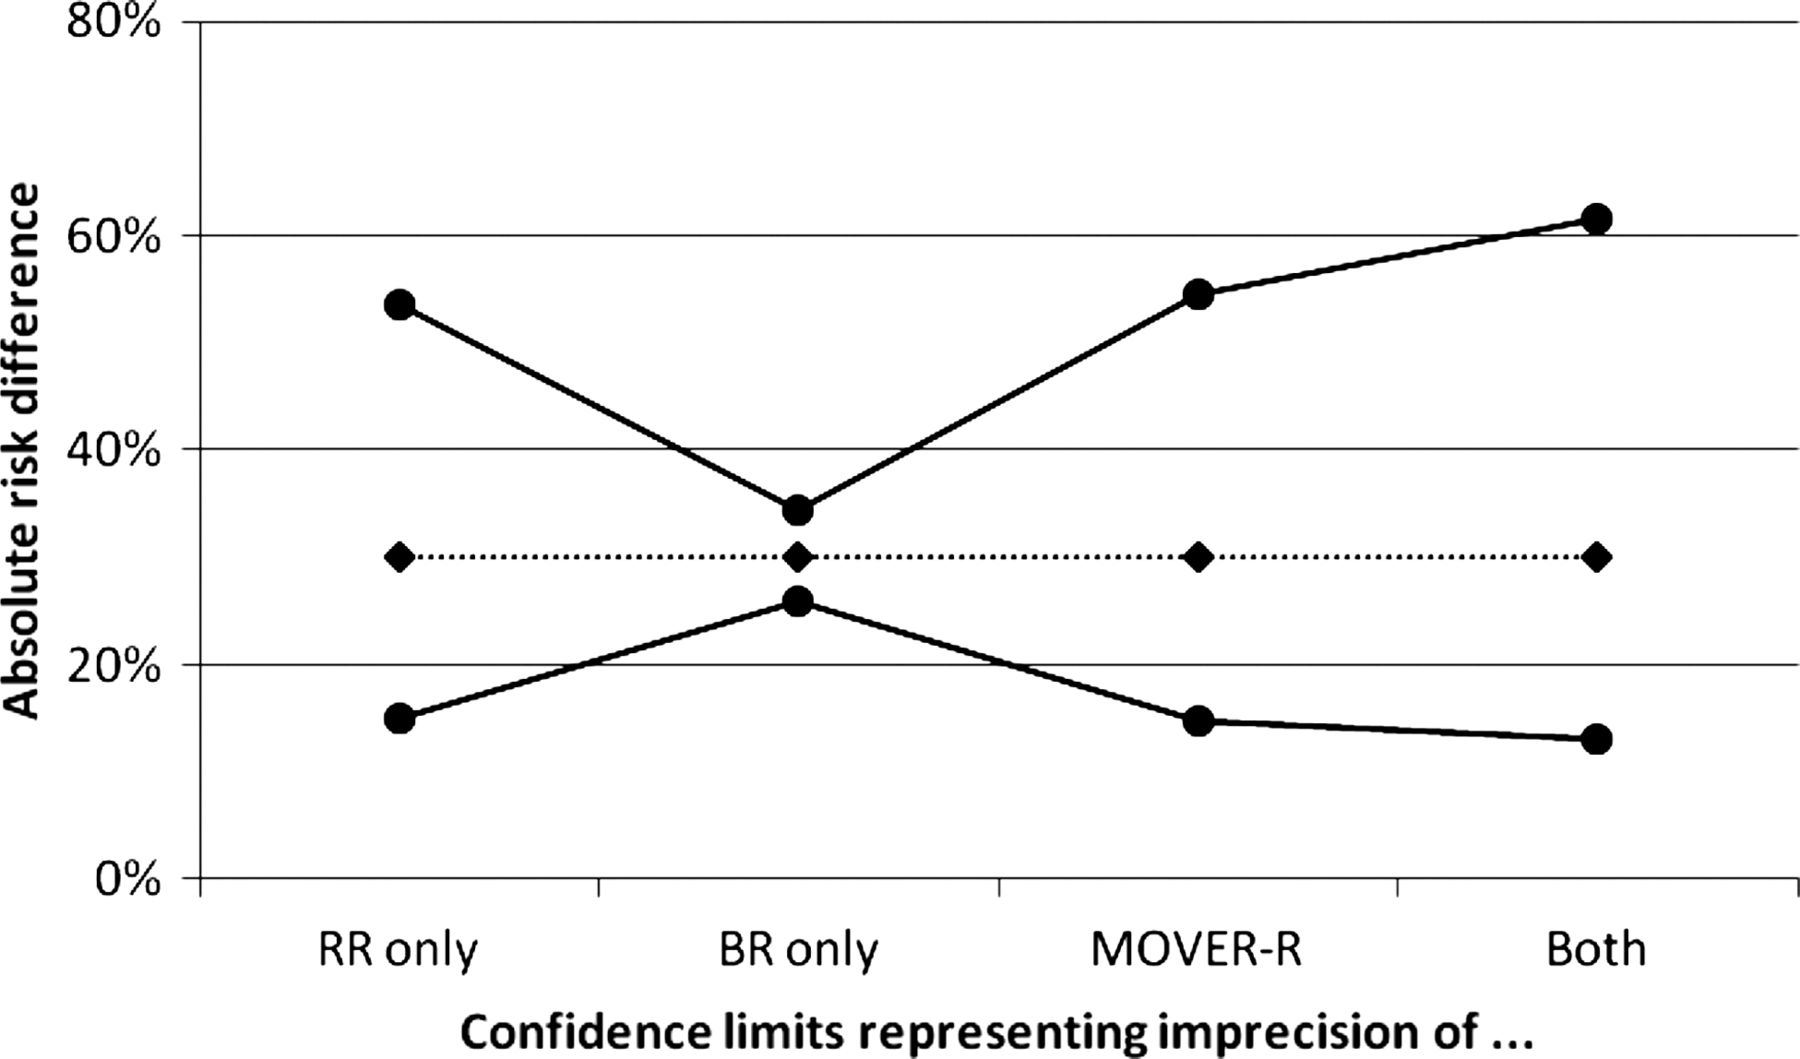
Arzola and Wieczorek12 evaluated the use of low-dose bupivacaine (≤8 mg) in spinal anaesthesia for elective caesarean section. While use of a low dose instead of the conventional dose (>8 mg) may help prevent hypotension resulting from spinal anaesthesia, it may compromise anaesthetic efficacy. In a meta-analysis, the need for analgesic supplementation during surgery was higher (RR=3.76, 95% CI 2.38 to 5.92) in women receiving the low dose compared with the conventional dose. The baseline risk of needing analgesic supplementation during surgery was taken as 10.9% based on Garry and Davies.13 This is derived from 175 occurrences among 1610 women, leading to a 95% CI for BR of 9.4% to 12.5%. The resulting RD is 0.109×(3.76–1)=0.301, with 95% CI 0.149 to 0.546. These results indicate that using low-dose bupivacaine leads to the need for analgesic supplementation in an additional 30% of women compared with the use of the conventional dose, with 95% CI 15% to 55%.
Figure 2 displays four 95% CIs for the RD, as in figure 1. Here, the RR is the dominant source of uncertainty, hence it is the interval representing the uncertainty of the RR only that approximates closely the MOVER-R interval.

Discussion
Whenever the BR and RR are derived from separate studies and thus are estimated independently, the calculations described here, based on MOVER-R, lead to an appropriate CI for the RD which correctly allows for the degree of imprecision of both the BR and RR. As in figures 1 and 2, more simplistic approaches either reflect the imprecision of one parameter only, or else produce an interval that is, unnecessarily wide. In both instances, the interval derived from the limits for both the BR and RR is substantially wider than the correct MOVER-R interval. Thus in the LMWH example, it is implausible that the BR would be at its upper 95% limit, 0.0137 and RR at its lower limit, 0.20, which is what Spencer's upper limit of 110 represents. Versions of MOVER that are less refined than the algorithm used here fail to give useful results when the RR and its confidence limits can be either side of 1.
In many applications, the RR is taken from a meta-analysis. However, the method described here must not be used when the BR and RR are derived from exactly the same series of individuals, because the assumption that they are statistically independent is violated. In the situation of a single study, the RD should be calculated directly from the data, as the proportion of patients experiencing the event of interest in the intervention group minus the corresponding proportion for the control group. A CI for this RD is calculated using the second block of the spreadsheet CIPROPORTION.xls available from the same website. An indirect procedure in which intervals are first calculated for the BR and RR and then combined may lead to a very different interval and is simply incorrect in this scenario.
For example, Rascol et al14 compared the incidence of dyskinesia after ropinirole (17/179, 0.095) and levodopa (23/89, 0.258) in a prospective study in early Parkinson's disease. Here, the baseline risk (on levodopa) is 0.258, with 95% CI10 0.179 to 0.358. The RR representing the reduction of risk using ropinirole is 0.368, with 95% CI15 0.209 to 0.649. The absolute reduction in risk is 0.163, calculated either directly or from the BR and RR. However, the 95% CI for the risk reduction calculated incorrectly from the BR and RR is 0.082–0.242. This is substantially narrower than the correct interval calculated directly,16 0.068–0.269. Conversely, for other datasets, the interval calculated indirectly by MOVER-R can be too wide.
In the context of a meta-analysis in which it makes sense to use RD as the effect measure, the RD should be estimated in each study and then pooled using meta-analysis methods. One meta-analysis situation in which no clear solution has yet been established is where the RD should not be used as an effect measure due to heterogeneity, but the relative effect measure, the RR can be pooled adequately and the BR is taken to be the median or some other summary measure derived from the observed absolute risks of the control group across the same studies included in the meta-analysis. If there is little variation in the BR across the studies this is the recommended procedure of the Cochrane Collaboration.17 In this situation BR and RR are not estimated independently and MOVER-R cannot be used. The solution used in Cochrane reviews is to consider the BR (called assumed control risk (ACR) in Cochrane reviews) as a fixed constant. However, the larger the uncertainty of the estimated BR the greater is the need to include this uncertainty in the CI for the RD.
In summary, a simple and effective method to calculate CIs for the RD from independent estimates of the baseline risk and the RR is available. This method improves the currently used methods within the GRADE system, because both sources of uncertainty, namely the estimation of the RR as well as that of the BR are taken into account.
References
Supplementary materials
Supplementary Data
Files in this Data Supplement:
Footnotes
-
Competing interests None.