Article Text

Abstract
Introduction An important role of public health organisations is to monitor indicators of variation, so as to disclose underlying inequality in health improvement. In industrialised societies, more individuals than ever are reaching older ages and have become more homogeneous in their age at death. This has led to a decrease in lifespan variation, with substantial implications for the reduction of health inequalities. We focus on a new form of variation to shed further light on our understanding of population health and ageing: variation in causes of death.
Methods Data from the WHO Mortality Database and the Human Mortality Database are used to estimate cause-of-death distributions and life tables in 15 low-mortality countries. Cause-of-death variation, using 19 groups of causes, is quantified using entropy measures and analysed from 1994 to 2017.
Results The last two decades have seen increasing diversity in causes of death in low-mortality countries. There have been important reductions in the share of deaths from diseases of the circulatory system, while the share of a range of other causes, such as diseases of the genitourinary system, mental and behavioural disorders, and diseases of the nervous system, has been increasing, leading to a more complex cause-of-death distribution.
Conclusions The diversification in causes of death witnessed in recent decades is most likely a result of the increase in life expectancy, together with better diagnoses and awareness of certain diseases. Such emerging patterns bring additional challenges to healthcare systems, such as the need to research, monitor and treat a wider range of diseases. It also raises new questions concerning the distribution of health resources.
- medical demography
- mathematical modelling
- public health
This is an open access article distributed in accordance with the Creative Commons Attribution Non Commercial (CC BY-NC 4.0) license, which permits others to distribute, remix, adapt, build upon this work non-commercially, and license their derivative works on different terms, provided the original work is properly cited, appropriate credit is given, any changes made indicated, and the use is non-commercial. See: http://creativecommons.org/licenses/by-nc/4.0/.
Statistics from Altmetric.com
Key questions
What is already known?
Studies generally show that deaths tend to be concentrated in a few broad causes.
As cardiovascular diseases have declined, other causes of death, such as diseases of the nervous system and neoplasms have become increasingly prominent.
What are the new findings?
We show that causes of death have become increasingly diverse, by introducing a new metric of variability in cause of death.
This study is the first to rigorously test and discuss the diversification in causes of death.
What do the new findings imply?
Greater diversification implies a lower predictability of the eventual cause of death for individuals.
Future improvements in life expectancy would require mortality reductions in a wider range of diseases and the overall efforts to reduce mortality will become more complex, fragmented and as a result, possibly less effective.
Introduction
Substantial increases in life expectancy have been recorded in the last two centuries—from less than 45 years in 1840, in countries like France and Sweden, to over 80 years now in many developed countries.1–3 Accompanying the rise in life expectancy, lifespan variation (ie, the variation in length of life) has decreased, with ages at death becoming more compressed in a narrower age span.4–7 Lifespan variation informs us about the individual uncertainty in the timing of death and the extent of health inequalities at the societal level.8
The strong negative association between life expectancy and lifespan variation suggests that as life expectancy continues to increase, variation in lifespans will decline.6 However, evidence shows that lifespan variation sometimes increases with life expectancy.8–13 In addition, trends in several countries indicate that continued improvements in longevity are not inevitable, with sustained stalls or even declines in life expectancy having occurred in some low mortality countries, such as the UK, Denmark and the USA.14–16 In these cases, the adverse mortality trends were not experienced at all ages. Such dynamics indicate the complexity underpinning population health, that requires different metrics to capture multiple dimensions of health improvement and crises.8 17
Ages at death are not the only source of heterogeneity in survival. Patterns in the cause of death structure across countries have long been known to be a key indicator of population well-being.18 In the last century, reductions in infant and maternal mortality, along with infectious diseases, were major determinants in both the decline in lifespan variation and the rise in life expectancy.19 20 More recently, reduced cancer mortality has further decreased lifespan variation in some low-mortality countries,20 21 while increases in life expectancy have been mainly attributed to a decline in mortality at older ages and from cardiovascular diseases.22–24
However, the extent to which causes of death themselves vary across individuals has never been systematically addressed. Studies generally show that deaths tend to be concentrated in a few broad causes,25 with around 60% of deaths being from cardiovascular diseases and cancers, with the former being the leading cause in most low-mortality countries.26 27 As cardiovascular diseases have declined, other causes of death, such as diseases of the nervous system (primarily Alzheimer’s disease) and neoplasms have become increasingly prominent in low-mortality countries. To put this into perspective, neoplasms have recently replaced cardiovascular diseases as the leading cause of death in some countries.26 28 29 Moreover, as the proportion of deaths from cardiovascular diseases has decreased, evidence from Canada shows that deaths have become increasingly spread across many causes of death in recent years.30 This suggests that variation across causes of death is increasing. Mortality from a wider variety of causes implies major new challenges for healthcare systems, from primary prevention to diagnostics and to end of life care.
In this research, we examine whether causes of death have become more similar as life expectancy has increased and lifespan variation has declined, across 15 low-mortality countries since the mid-1990s. The relationship between lifespan variation and cause-of-death variation is a priori not clear. On the one hand we might expect that declining lifespan variation which compresses mortality into a narrower age window should lead to declining cause-of-death variation because individuals die of different causes at different ages. On the other hand, if declining lifespan variation is closely related to increasing life expectancy, we expect increasing cause-of-death variation as more individuals survive to higher ages with multiple chronic diseases. To better unravel these trends and relationships, we introduce a new metric of variability in cause of death based on the concept of entropy which is comparable across populations and over time.
Methods
We extracted death counts by cause of death from the WHO Mortality Database31 for females and males in 15 low-mortality countries: Australia, Austria, Belgium, Canada, Denmark, Finland, France, Germany, Japan, Netherlands, Spain, Sweden, Switzerland, UK and USA.
Low-mortality countries are defined as those with the highest life expectancy. We focused on these countries as they are at the leading edge of the health transition and have experienced major declines in cardiovascular mortality since the 1960s, leading to changes in their cause-of-death profile.32 The selection criteria for the countries were high quality data, a population size of one million or more, and having a time series by cause of death longer than 15 years classified under the 10th revision of the International Classification of Disease (ICD). Other countries than those selected also fulfilled these criteria, but we limit our analysis to these 15 countries to reduce the number of comparisons. More details about the country selection are provided in the online supplementary material (section A).
Supplemental material
To avoid discontinuities in the time-series caused by revisions of the ICD, only data classified under the 10th revision of the ICD (ICD-10) were used.33 The year each country started using the ICD-10 varies, from 1994 (Denmark) to 2002 (Austria). The years with available ICD-10 data by country are shown in the online supplementary material (section A, table A2), with each country covering between 16 and 22 years of data.
Within the WHO Mortality Database, death counts were available by 5-year age group with an open age interval at 95+ for all countries, except Finland and Canada, which have 85+ as the open age interval, as well as Denmark for the years between 1997 and 2000. We also used life tables by 5-year age group for each country and sex, extracted from the Human Mortality Database (HMD)2 which we adjusted to have a similar open age interval.
Deaths were grouped by the main ICD-10 chapters, as defined in table 1. These groups were selected because they are medically meaningful; they are based on specific body systems and causes considered to be systemic; and they avoid having a residual group of causes (eg, combining diseases of the eye and certain conditions originating in the perinatal period).
Causes of death groups and their ICD-10 codes
Cause-of-death distributions, life expectancy and lifespan variation were calculated from multiple decrement life tables, using the HMD life tables and the WHO cause-of-death distributions, based on standard procedures.34 Multiple decrement processes are those in which individuals have more than one mode of exit from a population such as from different causes of death. We used multiple decrement life table death distributions as opposed to observed age and cause-of-death distributions to avoid confounding by differences in the age structure of the populations over time and across countries. By construction, life tables standardise the survival schedule (and death distributions) by assuming a same initial cohort size (In a period life table, the mortality schedule of an hypothetical cohort is calculated, assuming that all individuals born in a given year will experience the mortality rate observed that year).
We measured cause-of-death variation with the normalised Shannon entropy. The Shannon entropy35 is a measure of diversity and predictability of a distribution, which is influenced by both the number of components present in a distribution and how equally distributed the observations are across the components. To reduce the sensitivity of the measure to the number of causes used, the entropy was normalised by the number of causes selected. This measure was also chosen because of its easy interpretation: it varies between 0 and 1. If the entropy is 0, all deaths are concentrated in one cause of death. If the entropy is 1, the deaths are equally distributed across the cause of death groupings. Lifespan variation was also calculated by the normalised Shannon entropy, using the number of age groups for the normalisation.
To study how the cause-of-death distributions changed over time, we compared the mean annual change in the cause-specific share of deaths across countries. The mean annual change was compared as opposed to the total change because the cause of death time series varied by a few years across countries.
Across the analysis, different distributions are analysed. First and foremost, the cause of death distribution in each population (proportions by cause sum to 1) is studied. We then calculated the mean annual change in the age-and-cause of death distribution (proportions by age and cause sum to 1). This analysis reveals how deaths have been simultaneously redistributed across ages and causes over time, showing the process of mortality change across both dimensions. An additional analysis for the cause-of-death distribution by age group is then provided (proportions by cause in a specific age-group sum to 1), to detect any age-specific trend in cause-of-death variation.
More details on the methods used for measuring cause-of-death variation and changes in distributions are provided in the online supplementary material (sections B-C).
Patient and public involvement
No patient or public were involved in the development of the research question, outcome measures, design of the study and the recruitment to and conduct of the study.
Results
Diversification in causes of death
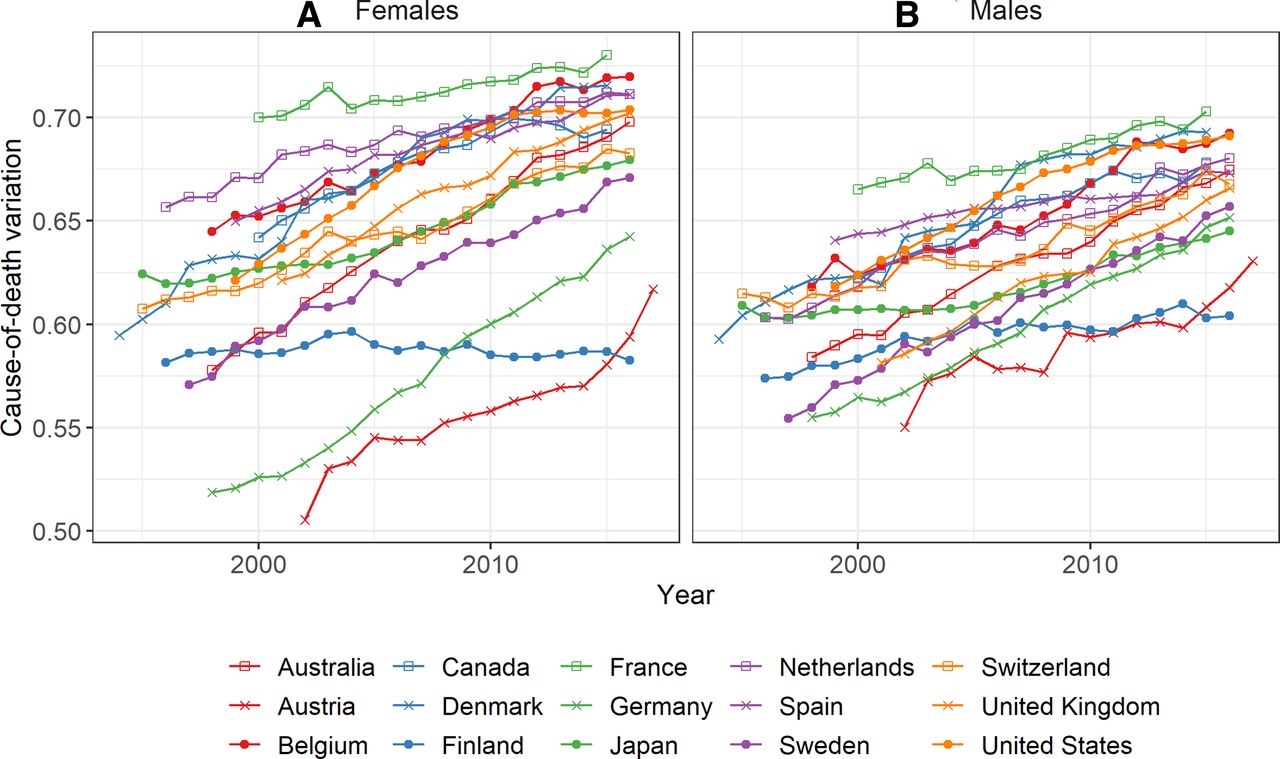
Cause-of-death variation has increased in recent decades for all selected countries and both sexes, except for Finnish females (figure 1). Deaths are thus being more equally distributed across groups of causes in low-mortality countries.

Cause-of-death variation over time for 15 low-mortality countries, 1994–2017; (A) females and (B) males.
Since the mid-1990s and in most countries, females experienced more variation in causes of death than males, with the exceptions of Austria, Finland and Germany. These three countries also had lower levels of cause-of-death variation compared with the other countries, and the highest share of deaths from diseases of the circulatory system. In Austria, Germany, and Finland the shares of death from diseases of the circulatory system were, respectively, 49.5%, 43.3% and 39.2% in 2015, compared to values between 36.6% and 25.1% in other countries for females (41.6%, 37.5% and 38.6% for males, with values between 36.6% and 24.4% in other countries). The country with the highest variation was France, for both sexes. However, the countries with the highest variation were not necessarily those with the smallest proportions of death from circulatory diseases. For example, females in Belgium had a higher proportion of death from diseases of the circulatory system than Japan, Netherlands, Canada, the UK and Denmark, despite having higher variability in causes of death.
Figure 2 presents how cause-of-death distributions changed, showing the mean annual change in each cause-specific share of deaths by country. The blue hues represent a decrease over time in the cause-specific share of deaths and the red hues suggest an increase within each country. The darker colours represent a stronger change than the lighter ones. The causes are ordered decreasingly, starting with those that showed the highest average increase in the share of deaths across populations.

Mean annual change in the cause-specific share of death by country (for 100 deaths), 15 low-mortality countries, 1994–2017: (A) females and (B) males. Note: The breaks in the legend are based on quantiles (25%, 50%, 75% and 95%) of the absolute difference in proportions higher than 0.005%. A linear scale does not allow to depict smaller differences relative to the larger ones.
The main change in the cause-of-death distributions came from a decrease in the share of deaths from diseases of the circulatory system. For example, diseases of the circulatory system accounted for around 40% of the deaths in 1994 in Denmark for both sexes, and their proportion decreased to around 25% in 2015—leading to a depicted mean annual change of 0.7 percentage points.
Alongside the important reductions in deaths from diseases of the circulatory system, the share of deaths of many other causes increased. Mental and behavioural disorders and diseases of the nervous system took over a relatively large share of deaths in recent years for all countries - except for mental and behavioural disorders in Finland. Ill-defined causes, diseases of the genitourinary system, neoplasms and infectious and parasitic diseases also had a relatively important increase in their share of deaths in most countries. This redistribution of deaths from one dominant cause to many others is, to some extent, responsible for the increase in cause-of-death variation observed in figure 1. However, even when removing diseases of the circulatory system from the distribution, cause-of-death variation still increased for most selected populations. Cause-of-death variation increased by 12% on average across all countries and both sexes, but when diseases of the circulatory system were completely excluded from the analysis, it increased by 4% (online supplementary material section D). The increased variation was thus not only driven by reductions in diseases of the circulatory system, but also by redistribution among other causes.
Changes in nutritional and metabolic diseases, diseases of the respiratory system, external causes and diseases of the digestive system varied more across populations. For example, the nutritional and metabolic diseases’ share of deaths decreased in nine countries for females and three countries for males, but increased in the remaining populations.
It was only Finnish females who did not experience a diversification of causes of death. This occurred because diseases of the nervous system took over a large share of deaths, larger than in other countries. In 2002, diseases of the nervous system accounted for 5.0% of deaths in Finland for females, compared with values between 0.9% and 5.9% for the other countries. However, in 2015, diseases of the nervous system accounted for 21.2% of deaths for Finnish females, compared with 2.6% to 9.6% for females in other countries.
Figure 3 shows the changes in the age and cause-of-death distributions over time for females and males in the 12 countries with available data up to age 95+. The analysis is extended here to the age and cause distribution, rather than to the cause distribution only, as in figure 2. Deaths can thus be simultaneously redistributed across ages and causes over time in this analysis. Only eleven causes are shown in the figure, as no substantial changes were recorded for the remaining causes (as shown in figure 2), although they are still considered in the calculation. The figure shows that deaths have been redistributed from younger towards older ages over time, with people dying at increasingly higher ages (given that the blue hues are to the left of the red hues). At the same time, deaths were redistributed towards a wider range of causes.

Mean annual change in the age and cause-of-death distribution (for 100 deaths) by age and cause of death in 12 low-mortality countries, 1995–2016: (A) females and (B) males. Note: The breaks in the legend are based on quantiles (25%, 50%, 75% and 95%) of the absolute difference in proportions higher than 0.0025%. A linear scale does not allow to depict smaller differences relative to the larger ones.
The share of deaths from diseases of the circulatory system decreased between the ages of 55 and 95 for females and between 45 and 90 for males. These deaths from circulatory diseases were only partly redistributed to older ages within the same cause. Most of these deaths were instead redistributed to a wide range of other causes of death above age 75–80. The proportions of neoplasms, diseases of the respiratory and digestive systems, external causes (the main exceptions being the USA and the UK) and endocrine, nutritional and metabolic diseases (females), also tended to decrease at younger ages and to increase at older ages for many countries, suggesting a certain postponement in the time of death from these causes. Small decreases in proportions of mental and behavioural disorders and infectious diseases were also observed at younger ages in some countries, especially for males. However, the share of deaths from some causes, including mental and behavioural disorders and diseases of the nervous system, mainly increased at older ages, taking over the share of other causes. The proportion of deaths from diseases of the genitourinary system, infectious diseases and ill-defined causes also mostly increased at high ages in many countries, suggesting an emergence of these causes.
Relationship with life expectancy and lifespan variation
Figure 4 shows the correlation between cause-of-death variation and (a) life expectancy at birth and (b) lifespan variation for females. Similar results were found for males (see online supplementary material section E, figure E1). The cause-of-death variation was positively correlated with life expectancy, with a Pearson correlation coefficient above 0.8 for each country and sex (population-specific correlation), except for Finnish females. Longer lifespans generally accompanied an increase in cause-of-death variation, since the mid-1990s. Exceptions to these trends were however observed: Finnish females’ cause-of-death variation did not change despite an increase in life expectancy and US males had a decrease in life expectancy in recent years, but the cause-of-death variation continued to increase (time-series for life expectancy at birth are provided in online supplementary material section E, figure E2).

Relation between cause-of-death variation and (A) life expectancy at birth and (B) lifespan variation in 15 low-mortality countries, females, 1994–2017.
Cause-of-death variation was negatively correlated with lifespan variation, suggesting that as uncertainty about lifespan decreased, the uncertainty about the cause of death increased. The Pearson correlation coefficient is also below −0.8 for each population and for both sexes, except for Finland and the USA. As with life expectancy, we also observed exceptions to this negative relation. The USA recorded an increase in lifespan variation over the studied time period, despite changes in cause-of-death variation that were similar in magnitude to those in other countries (time-series for lifespan variation are provided in online supplementary material section E, figure E3).
Age-Specific cause-of-death variation
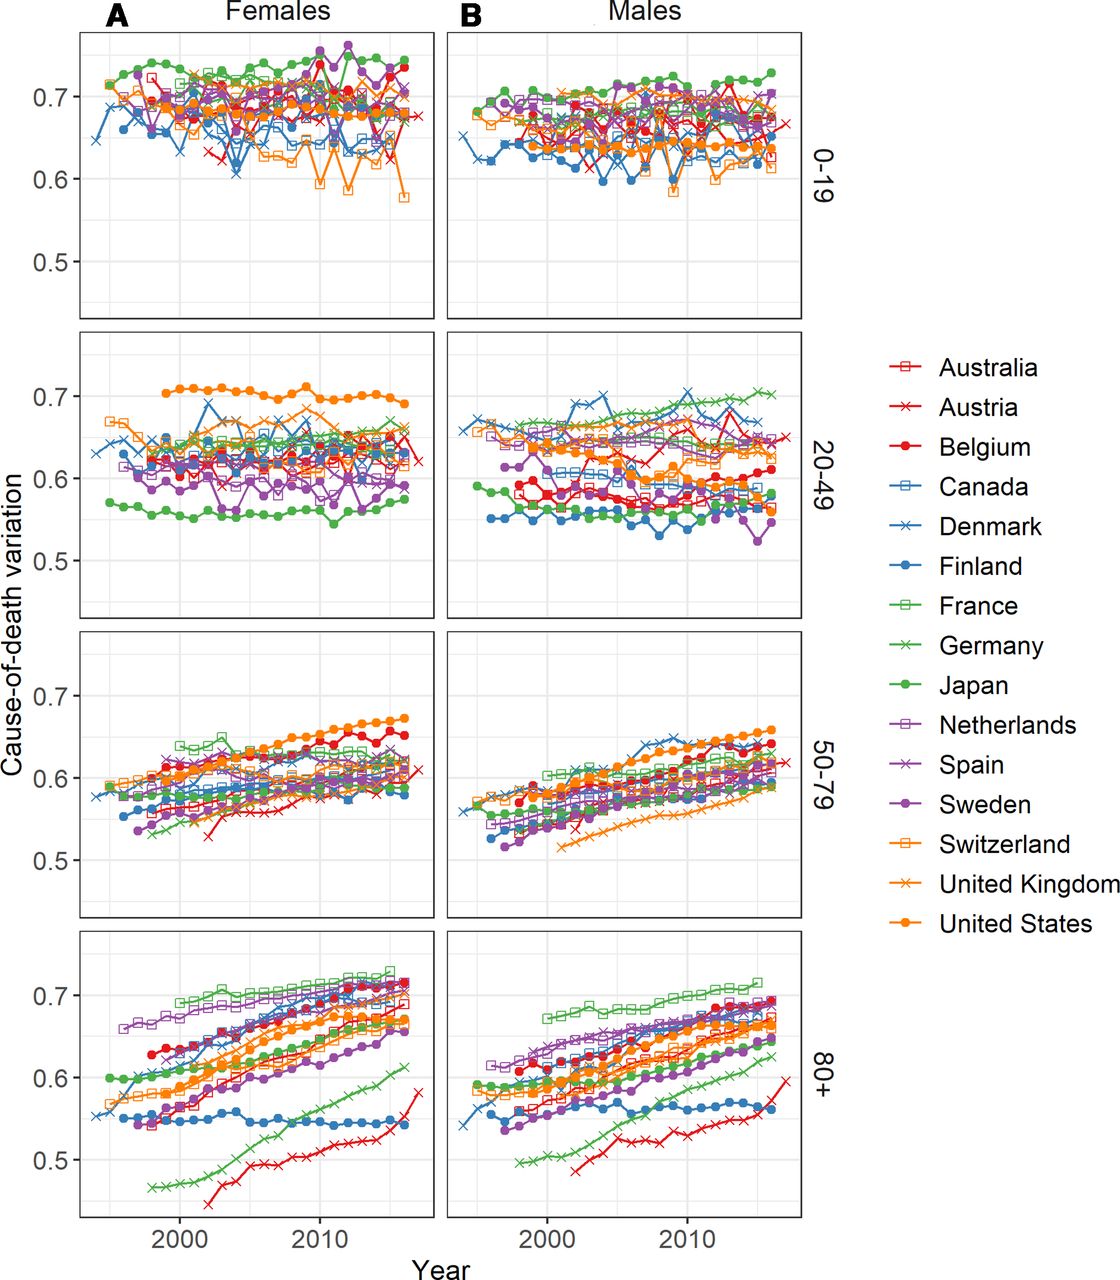
Up until now, we have provided results for the overall population, where the trends are dominated by ages where most deaths occurred. In this section, we recalculated trends in cause-of-death variation within four broad age-groups. Cause-of-death variation tended to be higher for the youngest (0–19) and oldest (80+) age-groups than for the middle age-groups (figure 5).

Cause-of-death variation over time by age-group for 15 low-mortality countries, 1994–2017. (A) females and (B) males.
The range in cause-of-death variation across countries was largest in the middle (20–49) and oldest (80+) age groups. The country rankings of cause-of-death variation were inconsistent across different age groupings. At the youngest age-groups (0–19 and 20–49), variation has stayed roughly constant over time, on average. Important differences between countries are, however, observed. For example, variation has decreased for both sexes at ages 0–19 in Switzerland but increased in Japan. For the age-group 20–49, variation increased in Germany, but decreased among males in the USA. For the age-groups 50–79 and 80+, cause-of-death variation has been increasing in most countries. The increase in the overall variation could thus result from increasing age-at-death, towards ages (80+) which experienced both high and increasing variation (see online supplementary material section F, figure F1, for differences in the cause-specific share of deaths by age-group).
Discussion
Summary
Our results highlight the increased complexity of cause-of-death distributions in low-mortality countries over the last two decades, with most countries experiencing a diversification in causes of deaths. This diversification has been previously hypothesised, given ageing populations and increasing life expectancy,30 but never rigorously tested.
It is important to note that the increases in the share of deaths for most causes was modest. This is because there was an increase in the share of deaths for a relatively high number of causes—compared to causes that showed a decrease. For example, if the proportion of deaths from diseases of the circulatory system declined by ten percentage points, these ten points were redistributed between 5 and 10 causes, leading to modest absolute increases in the proportion of deaths in each of these gaining causes of death (see online supplementary material section C, table C1).
Limitations
Our results are sensitive to the cause-of-death grouping. By normalising the entropy, we reduced the sensitivity of the measure to the number of causes used, although without eliminating the problem. We tested the sensitivity of cause-of-death variation to the grouping (see online supplementary material section G) and found that while levels changed marginally, trends remained similar, and our overall conclusions were unchanged. The adoption of ICD-11 in the coming years might change the level of cause-of-death variation by introducing more chapters. However, we should expect somewhat similar trends, given that deaths are redistributed across a wide range of causes.
Other measures of difference between two distributions could have been used, such as the Kullback-Leibler divergence (KLD).36 The KLD, also known as the relative entropy, is interpreted as the amount of information loss if one distribution is used to estimate another. The KLD provides similar results to those shown in the Diversification of causes of death section and the conclusion of the paper would have been unchanged if this measure would have been used (see online supplementary material section C).
There are underlying issues with cause-of-death data that might bias the results. Causes of death are sometimes misreported by the clinicians and physicians who are in charge of completing death certificates.37–39 The magnitude of the problem is, however, hard to assess and might vary across countries and age groups (eg, misreporting can be more important at higher ages, where multimorbidities are generally more common). The unfolding COVID-19 pandemic has cast a spotlight on the challenges of assigning underlying causes of death among the frailest patients who might still have died in the absence of contracting the virus.40 This has long been an issue in identifying levels and country-differences in other infectious diseases at older ages, particularly influenza-related mortality.41–44
Coding practices and applications of the ICD-10 tend to differ between countries,45 which could explain, in part, the between-country differences. For example, we found that Finland did not experience an overall diversification in causes of death, due to the important increase in the share of deaths from diseases of the nervous system. Finland has the highest mortality rate for dementia and Alzheimer’s disease in Europe.46 47 Environmental factors can be at play,46 but it is conceivable that part of these differences are due to different coding practices. In addition, despite the data being of generally high quality from the selected countries, some countries did use ill-defined codes more excessively, such as France and Japan. This could have artificially increased the level of causes-of-death variation for these countries (see online supplementary material section A). Countries like Belgium, Denmark and France have also been shown to use garbage codes for cardiovascular diseases, cancers and injuries more frequently than other countries.48 As these garbage codes were included within their respective chapters, they did not influence the results.
Interpretation
Deaths have been simultaneously redistributed towards older ages and towards a wide range of causes over time, with life expectancy being positively correlated with cause-of-death variation. As individuals reach older and older ages, they become increasingly vulnerable to multiple diseases. Ageing is a strong risk factor for many chronic diseases. This has usually been attributed to the long-term accumulation of unrepaired damage and the dysregulation of many organ systems that accompany ageing.49 50 Multimorbidities also increase with ageing,49 51 suggesting a higher competing risk between diseases to be registered as the cause of death.
The negative association between lifespan variation and cause-of-death variation can be attributed to changes in the age-at-death distributions. The decrease in lifespan variation has been driven by declines in premature mortality6 while the increase in cause-of-death variation can be attributed to increasing ages at death. Thus, the redistribution of death from younger to older ages, and the increase in life expectancy in general, tend to simultaneously decrease lifespan variation and increase cause-of-death variation.
While these processes broadly represent the contemporary pattern across low mortality countries there are exceptions, underscoring that these are not mechanical relationships. For instance, lifespan variation has been increasing in the USA since 20108 52 and stagnant in the UK.53 The stagnant cause-of-death variation that we observed among US females since 2010 is consistent with the proposed negative correlation between lifespan and cause-of-death variation, but US males and both sexes in the UK have experienced internationally comparable increases in cause-of-death variation alongside their increasing or stagnant lifespan variation. Meanwhile we found that cause-of-death variation was low and stagnant among Finnish females, which contrasts with their low and declining lifespan variation levels.54 These exceptions highlight that cause-of-death variation is a distinct metric of diversity in survival.
In addition to ageing, the increasing cause-of-death variation over time could have resulted from better diagnoses and awareness of certain diseases. These would only impact our results if the diagnoses resulted in a death being registered in a different ICD chapter. For example, Alzheimer’s disease (classified as diseases of the nervous system) was rarely reported before 1970s, but a better understanding of the disease and its partitioning with dementia (often classified as mental and behavioural disorder) in coding systems increased the number of diagnoses and deaths classified as Alzheimer’s.55 Likewise, mental disorders are increasingly recognised as a cause of death, rather than as an expected consequence of ageing, and coding practices have changed accordingly.56
Understanding the differences between populations
Large differences in cause-of-death variation are observed across populations. One explanation could be that differences in life expectancy also explain differences in cause-of-death variation, due to their positive correlation. This could also, in part, explain the difference between sexes. However, we observed a wide range of entropy values at similar levels of life expectancy (figure 4), suggesting that other factors are also at play. As previously discussed, differences in coding practices could, among others, contribute to these regional differences.
Diseases of the circulatory system remain the leading causes of death in most high income countries,27 57 and was the cause of death that experienced the largest absolute change during the time period we studied. Thus it is not surprising that we found that countries such as Austria, Finland and Germany which are known laggards in circulatory diseases decline,28 57 were also those with low cause-of-death diversification. However at the other end of the spectrum the negative association between circulatory disease levels and cause-of-death diversification appeared weaker. France and Japan are at the forefront of circulatory disease decline, having experienced similar levels and trends in age-standardised death rates since 2000.58 Yet while France experiences the most diversity in causes of death, Japan consistently ranked among the middle of the countries we studied. This could be because the cause of death structure has long been known to be different in Japan compared to Western European and Anglophone countries.59 It could also be that countries differ in their redistribution patterns from circulatory disease to other causes of death. Thus circulatory disease reduction might be viewed as a precursor to experiencing high levels of cause-of-death diversification, but this reduction alone does not determine the degree to which causes of death eventually become varied.
Apart from diseases of the circulatory system, changes in the share of deaths from other causes—especially nutritional and metabolic diseases, diseases of the respiratory system, external causes and diseases of the digestive system—differed between countries and sexes. These diseases tend to be strongly associated with certain behaviours (eg, smoking, drinking and overdoses) and an increase in their share might reflect population-specific factors. For example, an increase in the share of death from external causes in the USA is explained, in part, by an increase in overdoses, including misuse of opioids.14 60 61 This pattern is more pronounced in the USA but has also been observed in other Nordic and Anglophone countries.61–63 Increasing shares from smoking-related causes such as respiratory diseases and certain cancers could signal increasing proportions of smokers entering old age, but could also come about through competing risks. Ischaemic heart diseases are one of the leading causes of death among smokers.64 Over the period we analysed they declined substantially among smokers, former smokers and non-smokers alike, while death rates from other smoking-related respiratory diseases and cancers were far more stable.65 Thus the cause of death profile among smokers as a group could be undergoing diversification even if the population of smokers remained constant.
Overall, multiple causes of death are involved in changing cause-of-death distributions, making it challenging to isolate the role of any single behaviour or determinant on increasing cause-of-death variation from the aggregate results presented here. Other factors could explain the differences in levels and trends between countries than those discussed, for example, geography, and more general differences in social structures, health policies and other social determinants of health. Of note, few similarities were found between neighbouring countries or countries with similar welfare systems (eg, Denmark, Sweden and Finland).
Implications
Why should we monitor cause-of-death variation? The degree to which causes of death vary across individuals is not generally a matter of health equity. Indeed, we showed here that cause of death variability is strongly related to the overall life expectancy level, reflecting changes to the macro-epidemiological environment that accompany mortality decline. Instead we argue that monitoring cause-of-death variation serves two important functions: (1) It is a metric summarising the individual-level uncertainty in the cause of death, which is likely to track misdiagnosis; (2) At the macro-level it is an indicator of fragmentation in disease categories, with major fiscal and policy implications.
The measure of variation used in this paper is often interpreted as a measure of predictability, in which greater variation is a sign of lower predictability. For example, if individuals could only develop cardiovascular diseases and neoplasms, with 90% of patients developing cardiovascular diseases and 10% neoplasms, variation would be low and medical doctors would then have a good chance of predicting the correct outcome by diagnosing cardiovascular diseases. With increasing variation, the predictability of diseases decreases and renders diagnosis more complex. Diagnostic errors for older patients are common.66
Research funding is generally associated with the burden of disease.67 The high cost of bringing new pharmaceuticals to market for less common diseases is a known impediment to developing novel treatments for such diseases. Public health policies would become increasingly difficult to coordinate to the extent that the social and behavioural determinants of mortality from different major disease categories differ. Preventive health services might need to involve more holistic approaches. While the increase in life expectancy since the 1960s has been driven mainly by reductions in cardiovascular disease mortality,32 future improvements in life expectancy would require mortality reductions over a wider range of diseases. Overall efforts to reduce mortality will be complex, fragmented, and as a result, possibly less effective, potentially leading to slowdowns in life expectancy improvements. Nevertheless, most deaths today are still from diseases of the circulatory system (24% to 49%) and neoplasms (18% to 31%) and major improvements in life expectancy can still be achieved by reducing mortality from these causes (see online supplementary material section C, table C1).
It has been argued that, with more equal lifespans, health resources could be more concentrated by targeting individuals in a narrower age group. Uncertainties around lifespan are reduced, increasing health equity and making investments more worthwhile.6 However, the potential gains made by reducing lifespan variation could have been offset by an increased variation in causes-of-death.
Increasing variation in causes of death has potentially important implications as the causes of mortality become more unpredictable. Greater variation in causes of death require healthcare systems to monitor a wider range of morbidity and mortality causes. Health resources would also need to be divided between preventions and treatments of a wider range of causes. Our results highlight the need for new approaches to monitor causes of death and new strategies to address a more diverse mortality profile in low-mortality countries.
Acknowledgments
The authors wish to thank Jim Oeppen, Virginia Zarulli, Heather Booth and Vladimir Canudas-Romo for their useful comments on earlier versions of the paper.
References
Footnotes
Handling editor Sanni Yaya
Twitter @jm_aburto, @AlysonVanRaalte
Contributors M-PB-B and JMA have contributed to the design of the study. All three authors contributed to the interpretation of the results; and the drafting, revision and approval of the manuscript. M-PB-B conceptualised the study, did the analysis and produced the results. The corresponding author attests that all listed authors meet authorship criteria and that no others meeting the criteria have been omitted.
Funding The first author received funding from the SCOR Corporate Foundation for Science. The second author acknowledges support from the Newton International Fellowship from the British Academy. The third author is funded by a starting grant from the European Research Council (grant # 716323). SCOR, the British Academy, and the European Research Council played no role in this study.
Competing interests None declared.
Patient and public involvement Patients and/or the public were not involved in the design, or conduct, or reporting, or dissemination plans of this research.
Patient consent for publication Not required.
Provenance and peer review Not commissioned; externally peer reviewed.
Data availability statement Data are available in a public, open access repository. The data are publicly available in the WHO Mortality Database and Human Mortality Database. R code to reproduce the results can be shared upon request to the corresponding author.