Article Text

Abstract
Background Literacy is championed as a pathway out of poverty, yet it is vulnerable to the risk circumstances it seeks to mitigate. This study explored the developmental circumstances that gave rise to stark inequalities in reading achievement in Australian children across 6 years of school.
Methods We used data from Growing up in Australia: the Longitudinal Study of Australian Children linked to Australia’s National Assessment Program-Literacy and Numeracy across school years 3, 5, 7 and 9. Latent class analysis and growth curve modelling (n=4983) were used to identify risk profiles for reading achievement for children (ages 8.2–15.2).
Results Four distinct profiles were identified: developmentally enabled profile (62% of children); sociodemographic risk profile (25% of children); child development risk profile (11% of children); and sociodemographic and child development (double disadvantage) risk profile (2% of children). Children with a developmentally enabled profile achieved the expected rate of growth of 1.0 year per year of school across years 3, 5, 7 and 9. By comparison, children with sociodemographic and/or child development risk profiles started behind their developmentally enabled peers, and lost ground over time.
Discussion Across 6 years of school, multiple risk-exposed children lagged behind low risk-exposed children in the order of years of lost gains in reading achievement. The results point to the complex contexts of educational disadvantage and the need for cross-cutting social, health and education policies and coordinated multiagency intervention efforts to break the cycle of educational disadvantage.
- education
- inequalities
- life course epidemiology
- longitudinal studies
- public health
This is an open access article distributed in accordance with the Creative Commons Attribution Non Commercial (CC BY-NC 4.0) license, which permits others to distribute, remix, adapt, build upon this work non-commercially, and license their derivative works on different terms, provided the original work is properly cited, appropriate credit is given, any changes made indicated, and the use is non-commercial. See: http://creativecommons.org/licenses/by-nc/4.0/.
Statistics from Altmetric.com
Introduction
Reading is a tool for life that confers human, social and economic benefits to individuals and populations. Literacy is championed as a pathway out of poverty. Yet, it is vulnerable to the risk circumstances it seeks to mitigate.1 This is a complex (ie, ‘wicked’) policy problem.2
Education testing across Organization for Economic Co-operation and Development countries highlights that education policies are not closing education achievement gaps between socioeconomically advantaged and disadvantaged children. Early life adversities cast a long shadow and the human and economic costs of poor health and education outcomes have led to heavy investments in early childhood policies and interventions.3
Recent research has drawn attention to the multidimensionality of developmental disadvantage.4 5 These studies have painted a picture of the complex developmental circumstances that set the context for very poor outcomes for children that have lasting effects on their future capabilities. This body of work provides guidance about the policy levers needed to improve the circumstances that give rise to inequalities in child development. There is no one-size-fits-all policy solution to address the mix of disadvantages operating in these study populations.
Early childhood policies and interventions are grounded in a bioecological model of child development. This model recognises the complex interplay between children’s biopsychosocial capacities and the relationships, resources, experiences and opportunities that influence their developmental trajectories and in turn define their developmental circumstances. According to this view, developmental achievements (eg, language development) can also be thought of as developmental means for related capabilities (eg, reading achievement). The bioecological model was developed with an explicit interest in applications to policies and interventions.6
The bioecological model is the predominant conceptual model guiding variable selection in longitudinal life course studies, such as the Longitudinal Study of Australian Children (LSAC), explicitly tasked with producing evidence for policy.7
Longitudinal studies grounded in a bioecological model characteristically measure risk and protective factors relating to the child and their developmental contexts (eg, family, community, school). There is no one single approach to risk variable selection and measurement that fully captures the dynamic and complex interplay between a child and their developmental circumstances. In the case of the LSAC, variable selection and measurement was guided by a group of expert Australian researchers.7
Two recent LSAC studies used different approaches to quantify the multidimensionality of child disadvantage. Goldfeld and colleagues8 tested an a priori child disadvantage framework in a cross-sectional study of general academic achievement in the LSAC. Their disadvantage framework combined a bioecological and social determinant approach. Four latent factors: (1) sociodemographic, (2) geographical environments, (3) health conditions, and (4) child, family and community risk factors, measured at ages 4–5 years, were associated with academic achievement, measured at ages 8–9 years. All four latent factors were associated with poorer academic achievement.
Christensen and colleagues9 used a data-driven approach (latent class analysis, LCA) to test the multidimensionality of 16 single risk exposures in a longitudinal study of language ability in the LSAC. Six distinct risk profiles were identified and characterised using a human capability framework.10 Each profile was associated with different language development trajectories and invited different policy approaches tailored to the capability/resource mix in each profile.
Studies of reading achievement in general population representative samples have revealed a complex mix of independent child, family, community and school influences on reading achievement. Child factors, measured in the preschool years, that have been consistently associated with variation in reading achievement include gender, ethnicity, cognitive and non-cognitive skills and school readiness. In the school years, behavioural problems and school attendance have shown consistent associations with academic achievement. Skills beget skills by the process of dynamic complementarity.11 That is, individual capabilities in early childhood build the foundation for success at school. Family factors consistently associated with variation in reading achievement include parental education and family income; human, psychological and social capital are important resources for child development. Likewise, school-area advantage/disadvantage is part of the resource mix for children’s academic achievement and consistently associated with variation in reading achievement.
The risk factors selected for modelling in this study were ethnicity, cognitive and non-cognitive skills; school readiness, parental education, family income, home learning environment, school attendance and school-area disadvantage. The selection of risk factors was based on evidence from longitudinal8 12–15 and cross-sectional16 studies, drawn from general population samples, not samples selected for disability (eg, language impairment, dyslexia, special healthcare needs). Variable selection was guided by clear evidence of visibility in school settings, risk modifiability and amenability to a range of policy responses. A pragmatic consideration was the recommendation that LCA works best with 5–12 risk factors.17 For example, in the 10 risk factor model used in this paper, there are 210 (1024) possible combinations of risk factors.
Here we used LCA and growth modelling to conceptualise the developmental circumstances associated with different trajectories of reading achievement across 6 years of school, using data from Growing up in Australia: the LSAC linked to Australia’s National Assessment Program-Literacy and Numeracy (NAPLAN) reading scores across school years 3, 5, 7 and 9.
Methods
Sampling and data collection
Growing up in Australia: the LSAC
The LSAC is a national longitudinal study that began in 2004. The study design is enumerated elsewhere.18 In this study, we used data from the LSAC kindergarten cohort, collected in the first two waves of the LSAC and linked to data from My School 19 and the NAPLAN20 (see table 1). These data were collected throughout the cohort’s childhood and adolescence (4–15 years). The analytic sample used all 4983 children who for whom My School data were available, and/or participated in either wave 1 or wave 2 of LSAC (see table 1). Survey weights were applied to all analyses.
Data sources, waves/ages of data collection, sample size and sample retention
Ethics approval
Written informed consent was obtained from the caregiver on behalf of each of the study children and retained by the field agency, the Australian Bureau of Statistics.
Measures
LSAC is an ongoing life course epidemiological study designed to provide an evidence base for policies and interventions across health, education and human services. Guided by a bioecological model of child development, information is collected about children, their parents, families, communities and schools. The selection of individual measures is guided by a consortium of expert Australian researchers and is comparable to indicators used internationally.7
Reading achievement outcome measure
In Australia, 10 years of education is compulsory. The NAPLAN has been conducted annually since May 2008 in years 3, 5, 7 and 9 to monitor students, and performance between schools, jurisdictions and states/ territories.20 Four waves of NAPLAN data were available for the LSAC cohort.
Here, we used the student’s performance on the NAPLAN Reading test in years 3, 5, 7 and 9 as our measure of reading achievement. The NAPLAN Reading test assesses reading comprehension. The age of children at each wave of NAPLAN varied, with schooling slightly different between Australia’s states and territories. Children in the study sample were aged 8.2–11.4 in year 3; 9.7–12.3 in year 5; 10.4–14.0 in year 7; and 12.10–15.2 in year 9. Adjustments for students with disability are made to support their participation in the NAPLAN tests.
We converted NAPLAN Reading scale scores to Equivalent Year Level (EYL) scores. EYL scores benchmark students’ progress to the year level in which a typical (median) student would be expected to achieve a given NAPLAN Reading scale score. EYL scores measure reading achievement progress in years and months.14 Scores outside the EYL range were bottom and top-coded to 1.3 and 13.1 years, respectively. Extensive testing of how NAPLAN was coded and transformed indicates that the relative gaps between risk classes are robust to the treatment of NAPLAN.
Sociodemographic and child development risk measures
This study used 10 well-substantiated risk factors for low reading achievement in general population samples.8 12–16 These risk factors were dichotomised into an ‘at risk’ group and a reference, ‘low risk’ group. Where no a priori cut-point existed, children who scored in the bottom 15% of the sample were categorised as ‘at risk’. Risks ranged in prevalence from indigenous status (3.9%) to maternal education year 11 school or less (49.1%).
Sociodemographic risk measures
The four sociodemographic measures were maternal education, family income, study child indigeneity and school-area disadvantage.
Maternal education. In Australia, 10 years of education is compulsory. Mothers with year 11 or less were considered ‘at risk’ (49.1% of the sample).
Family income. Families were asked to report their total weekly family income from all sources. Responses were partitioned into quintiles. Families with a total income of less than $599 per week ($31 199 per year) (ie, bottom quintile) were classified as ‘at risk’ (19.4% of the sample).
Aboriginal and/or Torres Strait Islander descent. A small proportion of children (3.9%) were of indigenous Australian (Aboriginal and/or Torres Strait Islander) descent and were coded to distinguish them from those who were not.
School-area disadvantage. School-area disadvantage was measured via the Index of Community Socio-Educational Advantage (ICSEA). The ICSEA uses a mix of aggregate parent occupation and education data, student enrolment information and measures of school remoteness.21 Children in schools with high school-area disadvantage (18.4%) were classified as ‘at risk’.
Child development risk measures
The six child development factors were low non-verbal intelligence, low receptive vocabulary, low school readiness, low task attentiveness, behavioural problems at school and poor school attendance. The three direct cognitive measures were the Who Am I?,22 a measure of school readiness at ages 4–5; the Matrix Reasoning subtest of the Wechsler Intelligence Scale for Children, fourth edition,23 a measure of non-verbal intelligence at ages 6–7; and the Adapted Peabody Picture Vocabulary Test24 at ages 6–7. Low school readiness (16.1% of the sample), low non-verbal intelligence (14.8% of the sample) and low receptive language ability (16.4%) were defined as performance in the bottom 15% of the sample. The three parent-report non-cognitive measures were task attentiveness at ages 6–725 (16.9% of the sample); behavioural problems at school (ie, if the parent was contacted by the school in the last 12 months because the child was behaving poorly at school) at ages 6–7 (10.0% of the sample); and school attendance (ie, the number of school days the child was absent from school in the last 4 weeks) at ages 6–7 (15.1% of the sample).
Statistical analysis
Missing values were imputed using PROC MI in SAS V.9.4.26 The proportions of missing data ranged from 0.9% (maternal education) to 37.2% (NAPLAN reading at year 3). We generated 25 imputed data sets, with results averaged according to Rubin’s rule, using PROC MIANALYZE. The distribution of characteristics is described in table 2.
Distribution of risks and outcomes in those with observed and imputed data
There are 210 (1024) possible combinations of these risk factors, of which 907 combinations were empirically observed in the data.27 An LCA was used to identify and describe profiles of risk for academic achievement for the study children. This technique aims to identify substantively meaningful classes within which participants have a similar response pattern on a set of observed variables.27 LCA estimates class probability parameters, which estimate the proportions of the population that fall in each class, and the item response probabilities, which provide information on the probability of an individual in that class to endorse the observed measures.27 All LCA analyses were conducted using SAS PROC LCA V.1.3.2.28
Model fit in LCA is guided by statistical measures of model fit and by the subjective interpretation of the assigned classes. The Akaike information criterion and Bayesian information criterion were used as the statistical measures of model fit in this paper.
Information from the LCA model was used to assign children to risk profiles. Individuals were assigned to latent classes based on their maximum posterior probability. Using each child’s assigned risk profile, each child’s NAPLAN score was assessed in years 3, 5, 7 and 9, to determine the association between the discovered risk profile classes and children’s reading achievement outcomes. A four-class model was selected based on statistical criteria and the fact that this model produced a clear distinction between classes.
Using each child’s assigned risk profile, the child’s NAPLAN Reading score in years 3, 5, 7 and 9 was assessed by a growth model, conducted in PROC MIXED in SAS V.9.4. Our growth curve modelling uses a two-level nested structure. Level 1 is the within-person model while level 2 is the between-person model. This approach has been described extensively elsewhere.29 These models estimate intercept and slope effects of NAPLAN development in relation to the derived risk profiles.
Results
Risk profiles
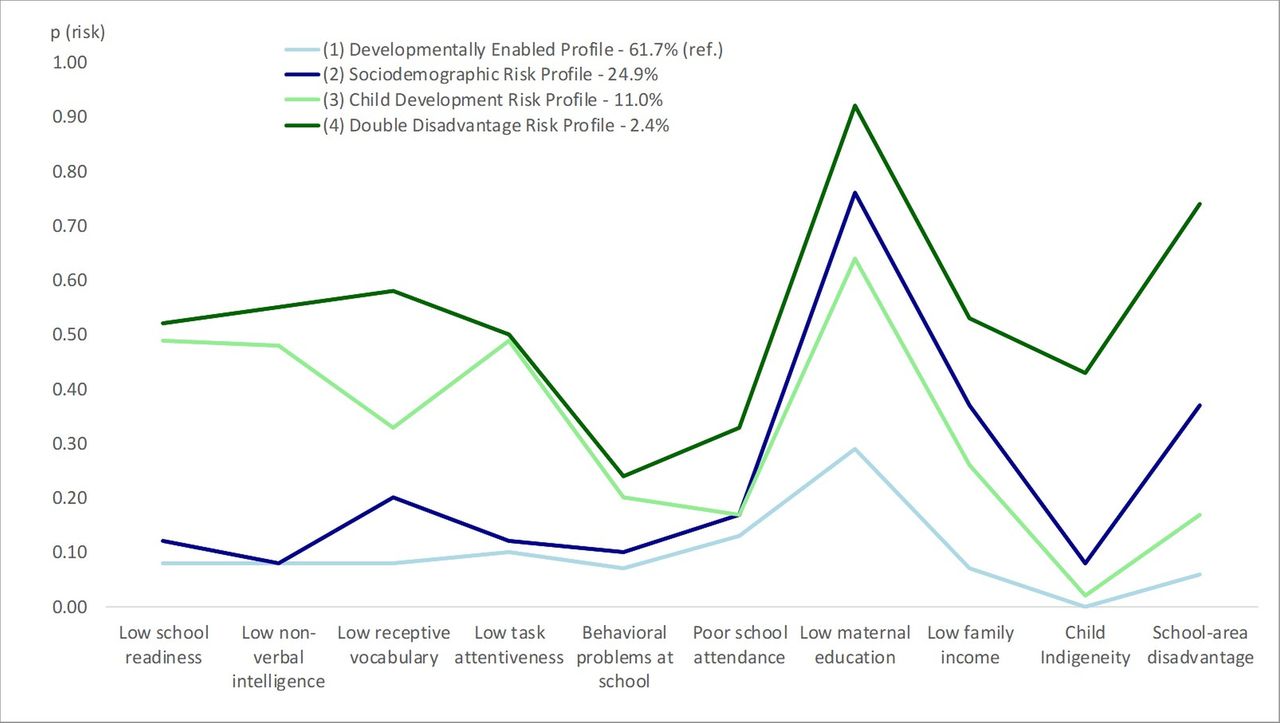
Based on model fit (table 3) and subjective interpretation, we identified four classes (ie, profiles) representing quantitatively and qualitatively different clusters of risk factors: (1) developmentally enabled profile (62% of children); (2) sociodemographic risk profile (25% of children); (3) child development risk profile (11% of children); and (4) double disadvantage profile (2% of children). The average number and type of risks experienced by children in these groups differed considerably and no group was defined exclusively by the presence or absence of a single risk factor (figure 1).

Probability of risk exposure by profile.
Model fit indices, latent class analysis
Table 4 shows the probability of risk exposure for each risk by class membership for each of the latent classes. We also provided the estimated population probability average for each of the risks. This allows comparisons to be made between the reference group (developmentally enabled profile) and each of the remaining groups but it also allows comparison with the population average probabilities. Because of the binary nature of the predictors, these probabilities can be interpreted as proportions within each cluster. The population of each group is estimated by allocating children to the group they best match.
Conditional probabilities and distributions of risks, four-class latent class analysis
Developmentally enabled profile
The developmental circumstances that defined this profile (62% of the sample) were lower exposures to all sociodemographic and/or child development risks, relative to the average population risk exposures (ie, reference group). On average, children with this profile were exposed to 0.9 risk (95% CI 0.7 to 1.1).
Sociodemographic risk profile
The developmental circumstances that defined this profile (25% of the sample) were higher than the population average exposure to sociodemographic risks: low maternal education (76%), low family income (37%), indigeneity (8%) and school-area disadvantage (37%). On average, children who fit this profile were exposed to 2.8 risks (95% CI 2.2 to 3.4).
Child development risk profile
The developmental circumstances that defined this profile (11% of the sample) were higher than the population average exposure to child development risks: low school readiness (49%), low non-verbal intelligence (48%), low receptive vocabulary ability (33%), low task attentiveness (49%) and behavioural problems at school (20%). On average, each child in this group was exposed to 3.8 risks (95% CI 3.3 to 4.4).
Double disadvantage risk profile
The developmental circumstances that defined this profile were higher than the population average exposure to both sociodemographic and child development risks: low maternal education (92%), low family income (53%), indigeneity (43%), school-area disadvantage (74%), low school readiness (52%), low non-verbal intelligence (55%), low task attentiveness (50%), behavioural problems at school (24%) and poor school attendance (33%). On average, each child in this group was exposed to 6.0 risks (95% CI 4.9 to 7.1).
Reading achievement trajectories for each profile
Table 5 shows the results of fitting a growth model for NAPLAN EYL reading achievement for children with each of the four profiles. The intercept indicates the NAPLAN EYL score for children with a developmentally enabled profile in year 3, and the grade term shows the change expected for every additional school year after year 3. The intercept and slope for the other profiles show their expected difference from children with a developmentally enabled profile (ie, reference group).
Growth model for NAPLAN Reading EYL scores for the LCA profiles
These groups revealed stark inequities in reading achievement trajectories across years 3, 5, 7 and 9 (figure 2).

Reading achievement trajectories by profile. LCA, latent class analysis; NAPLAN, National Assessment Program-Literacy and Numeracy.
The rate of growth in EYL scores for children with a developmentally enabled profile (ie, reference group) was 1.0 year per year of school. By year 9, these children had an average NAPLAN EYL score of 10.4 years. Children with a sociodemographic risk profile were 1.2 years behind the reference group in year 3. Their rate of growth was 0.2 year slower per school year than their developmentally enabled peers. By year 9, these children had an average NAPLAN EYL score of 8.3 years, which was 2.1 years behind their developmentally enabled peers. Children with a child development risk profile were 2.0 years behind the reference group in year 3. Their rate of growth was 0.2 year slower per school year than their developmentally enabled peers. By year 9, these children had an average NAPLAN EYL score of 7.1 years, which was 3.3 years behind their developmentally enabled peers. Children with a double disadvantage risk profile were 2.7 years behind the reference group in year 3. Their rate of growth was 0.4 year slower per school year than their developmentally enabled peers. By year 9, these children had an average reading year level of 5.1, which was 5.3 years behind their developmentally enabled peers.
Discussion
This study explored the developmental circumstances that gave rise to stark inequalities in reading achievement in Australian children across 6 years of school. Because risks for child development rarely occur in isolation, we explored clusters of risks that comprised different developmental circumstances for children. Four distinct profiles were identified: a developmentally enabled profile (62% of children); a sociodemographic risk profile (25% of children); a child development risk profile (11% of children); and a double disadvantage profile (2% of children).
The developmentally enabled children outperformed their developmentally disadvantaged peers at every time point and extended their lead over 6 school years. From a human capability perspective, these children were ‘enabled’ by their cognitive, non-cognitive and behavioural capabilities and resources in their home and school environments. Children with risk profiles lost ground over time, relative to their low risk-exposed peers.
Across childhood and adolescence, children’s cognitive, non-cognitive and behavioural capabilities become developmental means for capabilities such as reading (ie, self-productivity).11 In year 3, cognitive, non-cognitive and behavioural risk factors (ie, person capabilities) were associated with lower reading achievement scores than sociodemographic risk factors. That is, children with a child development risk profile had lower reading achievement at the intercept, relative to children with a sociodemographic risk profile. The rate of growth for both groups was similar, 0.1–0.2 years slower per school year than their developmentally enabled peers, meaning that the group differences slightly increased across 6 years of school. This finding reinforces the importance of including the child’s capabilities as well as sociodemographic factors in disadvantage models. It was interesting to observe that these qualitatively distinct risk profiles had a similar effect on the rate of growth for children with these risk profiles. It is important to note that while the rates of growth are indeed similar for these two groups, the underlying risk circumstances are different and that this difference has different implications for policies and services. This is considered more fully below.
Implications for policies and services
Some comments are warranted about the policy and service needs of children with different risk profiles.
Broadly, those with a developmentally enabled profile is a group that policymakers would like to expand through universal antenatal, child and maternal health and early childhood education in the first 5 years of life. Engagement in any of these universal services before children start full-time school is an opportunity for service providers to detect to and respond to developmental concerns in the absence of known risk factors for child development. The latest results from the Australian Early Development Census conducted in 2015 showed that 22% of 5-year-old children were developmentally vulnerable on one or more domains (physical health and well-being, social competence, emotional maturity, language and cognitive skills, communication skills and general knowledge). While there was a strong social gradient in developmental vulnerability, most developmentally vulnerable children were not living in the most socioeconomically disadvantaged communities.30 Therefore, most developmentally vulnerable children will not be reached by early childhood services targeted to socioeconomically disadvantaged communities.
By contrast, the sociodemographic risk profile leads to consideration of policies aimed at young mothers, elevating maternal education and maintaining maternal contact with onward education and employment pathways. Children with this risk profile are likely to benefit from progressive universal early childhood services,31 high-quality early childhood education and care,32 and human services to alleviate poverty, provide education and employment pathways for parents and improve housing circumstances. Children and families living in the most socioeconomically disadvantaged communities face disproportionate barriers in access, choice and quality of early childhood services.33 Even if these barriers can be overcome, early childhood services alone will not alleviate the lived experience of deep and persistent socioeconomic disadvantage.
The service needs of the children with a double disadvantage risk profile span health, welfare and education service systems. This is a population group with complex and inter-related service needs that are not adequately addressed through universal service platforms. For this group, there is a compelling conceptual argument for a service model that integrates traditionally separate health, education, non-parental care and human services under one roof. Ideally, this service model supports the child’s readiness for and transition to school. Examples of these models include Children’s Centres in the UK, Promise Neighbourhoods in the USA, Better Beginnings, Better Futures and Toronto First Duty in Canada, and Child and Family Centres in Australia.34 Evaluating complex service models presents many challenges and evidence to hand supports the potential for the model rather than robust evidence of intervention effects.35
Limitations
This study had limitations. First, LCA is a data-driven technique that carries the risk of the results being sample or risk factor dependent. Further, the technique works best with small set of 5–12 risk factors.17 Second, while the characterisation of each profile is data driven, substantive interpretation is involved that can oversimplify the complexities of multiple risk exposures.27 It is important to not reify these classes. Third, we were confronted with substantial missing data, particularly for NAPLAN. While sensitivity testing of original versus imputed data indicates that our findings are robust to this attrition, this remains a concern.
Conclusion
While literacy is an enabler of human capability formation, it is also very vulnerable to risk circumstances. Schools alone cannot be expected to compensate for developmental disadvantage and lost personal, social and economic opportunities. The breakdown in developmental gains observed at school originated in early childhood. Where children started their reading trajectories mattered, and disrupted the dynamic complementarity between earlier developing skills (eg, language ability) and later developing skills (eg, reading). The results point to a combination of early and late investments in child capabilities.11 The wide range of reading abilities observed here at each time point highlights the need for individual monitoring of students’ progress and teaching that is targeted to students’ abilities.36 The equity argument is simple, ‘Wherever a student starts from on the first day of the year, he or she deserves to have made at least a year’s worth of progress by the end of it’ (p 1).36
What is already known on this subject
Recent research has drawn attention to the multidimensionality of developmental disadvantage.
These studies have painted a picture of the complex developmental circumstances that set the context for very poor outcomes for children that have lasting effects on their future capabilities.
What this study adds
This study provides new evidence about the patterning of risks for low reading achievement over time.
The results draw attention to the sociodemographic patterning of risk factors that are especially detrimental to reading achievement when combined with cognitive and non-cognitive risk factors.
The results point to the complex contexts of educational disadvantage and the need for cross-cutting social, health and education policies and coordinated multiagency intervention efforts to break the cycle of educational disadvantage.
Acknowledgments
This study uses data from Growing Up in Australia: The Longitudinal Study of Australian Children and My School and NAPLAN data provided by the Australian Curriculum, Assessment and Reporting Authority (ACARA) and linked to the LSAC data sets. LSAC is conducted in a partnership between the Department of Social Services (DSS), the Australian Institute for Family Studies (AIFS) and the Australian Bureau of Statistics (ABS). Data collection for the LSAC is guided by a consortium of expert Australian researchers. We especially thank the children and families who participated in the Longitudinal Study of Australian Children.
Footnotes
Contributors CLT, SRZ and DC conceived the paper. CLT, SRZ and DC contributed to the study design. DC undertook the analyses. CLT, SRZ and DC contributed to the interpretation of the results and writing of the paper. CLT, SRZ and DC approved the final manuscript.
Funding This research was funded by the Australian Research Council Centre of Excellence for Children and Families over the Life Course (CE140100027).
Disclaimer The findings and views reported in this paper are those of the authors and should not be attributed to DSS, AIFS, ABS or ACARA.
Competing interests None declared.
Patient consent Not required.
Ethics approval The study has ethics approval from the Australian Institute of Family Studies Ethics Committee.
Provenance and peer review Not commissioned; externally peer reviewed.
Data sharing statement LSAC data are publicly available. Users may apply for an individual or organisational licence. Information about data access is available at http://www.growingupinaustralia.gov.au/data/dataaccessmenu.html. There is a fee for the licences and release of data.