Article Text

Abstract
Background Socioeconomic status (SES) is an important predictor for outcomes of chronic diseases. However, it is often unavailable in clinical data. We sought to determine whether an individual housing-based SES index termed HOUSES can influence the likelihood of multiple chronic conditions (MCC) and hospitalisation in a community population.
Methods Participants were residents of Olmsted County, Minnesota, aged >18 years, who were enrolled in Mayo Clinic Biobank on 31 December 2010, with follow-up until 31 December 2011. Primary outcome was all-cause hospitalisation over 1 calendar-year. Secondary outcome was MCC determined through a Minnesota Medical Tiering score. A logistic regression model was used to assess the association of HOUSES with the Minnesota tiering score. With adjustment for age, sex and MCC, the association of HOUSES with hospitalisation risk was tested using the Cox proportional hazards model.
Results Eligible patients totalled 6402 persons (median age, 57 years; 25th–75th quartiles, 45–68 years). The lowest quartile of HOUSES was associated with a higher Minnesota tiering score after adjustment for age and sex (OR (95% CI) 2.4 (2.0 to 3.1)) when compared with the highest HOUSES quartile. Patients in the lowest HOUSES quartile had higher risk of all-cause hospitalisation (age, sex, MCC-adjusted HR (95% CI) 1.53 (1.18 to 1.98)) compared with those in the highest quartile.
Conclusions Low SES, as assessed by HOUSES, was associated with increased risk of hospitalisation and greater MCC health burden. HOUSES may be a clinically useful surrogate for SES to assess risk stratification for patient care and clinical research.
- HEALTH BEHAVIOUR
- QUALITY OF LIFE
- MORBIDITY
- SOCIAL FACTORS IN
Statistics from Altmetric.com
Introduction
Reducing healthcare costs while improving health outcomes and healthcare quality is a national priority in the USA, and is reflected in the strategic goals of the Centers for Medicare and Medicaid Services. Health systems strive to improve quality of life and health outcomes at a reasonable cost through a healthcare value equation, the Institute of Healthcare Improvement's Triple Aim.1 Adults with multiple chronic conditions (MCC) are disproportionately at risk for increased morbidity, healthcare costs and death.2 Identification of factors predicting all-cause hospitalisation and MCC will be useful in achieving the Triple Aim. The underlying causes for all-cause hospitalisation and MCC are likely multifactorial, with sociodemographic, socioeconomic and clinical influencers. The causes also are likely multidimensional at individual, neighborhood and societal levels.3
As Oakes and Rossi4 have discussed, socioeconomic status (SES) reflects differential access to desired resources of materialistic, human and social capital. These factors may account for underlying health disparities under the model suggested by the Centers for Population Health and Health Disparities, which is sponsored by the National Institutes of Health.5 SES likely operates its impact on health outcomes through multiple pathways.6 SES measures provide an important basis for identifying populations with greater unmet medical or social needs, such as MCC and frequent hospitalisations. In a systematic review of SES factors affecting hospital readmission for patients with heart failure and pneumonia, social factors such as education, income and employment were associated with hospital readmission. However, some questions are ongoing about the influence of the living situation and social support.7
SES may be an important predictor of health outcomes and behaviour. Yet, it often is unavailable in the medical record or in health system administrative data. To address this concern, investigators commonly have used a neighbourhood SES derived from census data as a surrogate marker for a person's SES.8–14 However, neighbourhood SES causes misclassification (22%–31%) of individual SES and can itself be a predictor of health outcomes.3 ,15–18 Therefore, we developed and validated a distinct housing-based SES measure termed HOUSES.19 This SES index was formulated by geocoding address information with individual property data (ie, individual-level SES measure) at the time of a health event of interest. Although HOUSES has been shown to be associated with paediatric health outcomes19 and postmyocardial infarction mortality in adults,20 whether HOUSES can predict future all-cause hospitalisation and MCC is unknown. We hypothesised that a lower SES, as measured by HOUSES, is associated with higher risk of hospitalisation and MCC.
Methods
Study setting and participants
This study enrolled all eligible adult Mayo Clinic primary care patients who were enrolled voluntarily in the Mayo Clinic Biobank (MCB)21 and were residents of Olmsted County, Minnesota, USA.22 We limited our study patients to MCB participants living in Olmsted County at the time of MCB enrolment because HOUSES is available to the Olmsted County population only. All participants were enrolled in primary care and had an assigned primary care provider. A participant was seen by the medical provider within 3.5 years of the index date. Mayo Clinic primary care involves family medicine, community paediatric medicine and internal medicine. The MCB and the present study were both approved by the Mayo Clinic Institutional Review Board.23 The study also was approved by the MCB access committee. It adhered to the principles of the Declaration of Helsinki and maintained participant privacy.21
Covariate data
Age and sex data were obtained from the electronic medical record. At enrolment in the MCB, participants completed a questionnaire that included self-reported educational level and race/ethnicity. Race/ethnicity was dichotomised into white and non-white. Educational level was categorised into high school or less, some college, bachelor's degree and graduate school. We also obtained any missing educational level information. The MCB questionnaires are available online (http://www.mayo.edu/research/documents/biobank-questionnaire/doc-20086430).
Categorisation of participants by HOUSES
HOUSES is a composite index formulated from housing characteristics of property data and address information. Development and initial testing of the HOUSES index were completed in Olmsted County and in Jackson County, Missouri, USA. After development, HOUSES was applied to a study setting in Sioux Falls, South Dakota,19 ,20 ,24–26 which suggested the potential generalisability of HOUSES to other study settings. The details of HOUSES have been described elsewhere.19 In brief, staff obtained and geocoded patients’ addresses at MCB enrolment, using publicly available property data from the Olmsted County Assessor's office. Our original work, based on principal components factor analysis, showed four housing features: assessor's housing value, square footage, number of bedrooms and number of bathrooms. These housing features were not adjusted for family size. We formulated a standardised HOUSES index score by summing each variable after transforming the four variables to z-scores. This formulation allowed a comparison across different study settings using a standardised index. A higher HOUSES index score represents a higher SES. HOUSES was categorised into four quartiles for comparison.
Hospitalisation and Minnesota Medical Tiering
For hospitalisation, billing codes were used to identify all hospitalisations in the study population from 31 December 2010, to 31 December 2011. Hospitalisation was based on billing codes for the inpatient hospitalisation, with exclusions for outpatient surgical procedures. All patients in Mayo Clinic primary care had Minnesota Medical Tiering (MMT) performed on 31 December 2010, which included the subset in the MCB.27 MMT is based on the Johns Hopkins Adjusted Clinical Groups (ACG) system.28 MMT compares well with other instruments that measure MCC, including the Charlson Comorbidity Index and the Hierarchical Condition Categories.27 In brief, the International Classification of Diseases, Ninth Revision, billing codes for each outpatient encounter (≤4) and for each inpatient admission (≤25) were obtained and a computer algorithm was used that counted comorbid conditions, and scored patients on the basis of the number of conditions and the severity of the chronic condition. The algorithm placed the conditions within expanded diagnosis clusters, which were further categorised into 22 major, expanded diagnosis clusters. All patients had a cluster count and were placed into tiers based on the cluster count: tier 0, low (0 chronic condition); tier 1, basic (1–3 conditions); tier 2, intermediate (4–6 conditions); tier 3, extended (7–9 conditions) and tier 4, complex (≥10 conditions). MMT is the basis for case-mix disease severity for Minnesota medical home patients. We dichotomised tiers into participants in tiers 3 and 4 and those in tier 2 or under. This is a clinical distinction because patients in MMT tier 3 or 4 in our clinical practice are eligible for care management.
Statistical analysis
Participant characteristics were compared across groups with the Kruskal-Wallis test for continuous variables and Pearson χ2 test for categorical variables. A p value of 0.05 or less was considered significant. Cox proportional hazards model was used to estimate the impact of HOUSES (unadjusted, adjusted for age and sex, and adjusted for age, sex and MMT) on the hazard of hospitalisation. The relation between MMT scores (MCC) and HOUSES was assessed by calculating the γ coefficient for degree of association. Logistic regression models (unadjusted and adjusted for age and sex) were used to test the association between HOUSES and high MMT score (tier 3 or 4 with high comorbid health burden compared with 2 illnesses or less). The highest quartile of HOUSES with the highest SES was used as the reference. Degree of concordance between HOUSES and level of education was estimated using the γ coefficient. The spline method was used to incorporate non-linear age function. Level of education also was considered in the model, with and without HOUSES. Receiver operating characteristic curves for each model (HOUSES only, education only, and both HOUSES and education) and their area under the curve (AUC) were also calculated to estimate the predictability of each model for higher MMT score. Education level was considered with and without MMT. The C statistic also was reported.
Results
Participants
As of 31 December 2010, a total of 16 578 participants were enrolled in the MCB, with 8927 (54%) receiving primary care at Mayo Clinic's campus in Rochester, Minnesota. Among this percentage, 6402 participants resided in Olmsted County and had HOUSES indexing at enrolment. MCB participants outside Olmsted County who received primary care but were not included in the study had similar median age and sex distribution compared with the study participants (data not included). In the overall group, median age was 57 years, 95% were white and 50% had at least a bachelor degree (table 1). In Olmsted County, in 2010, 86% self-identified as white and 40% with a bachelor degree in people older than 25 years.29 The distribution is illustrated in online supplementary figure S1. Higher HOUSES index score was associated with lower proportion of adults older than 75 years, as well as higher level of education (see online supplementary figure S2). The γ coefficient for degree of association equalled 0.31 (p<0.001) (see online supplementary figure S2). There were differences in missing educational data, with 10.8% (95% CI 9.3% to 12.5%) missing for participants in the lowest-quartile HOUSES compared with 7.6% (95% CI 6.4% to 9.0%) in the highest quartile (see online supplemental table S1).
Demographic characteristics and HOUSES index overall and by quartiles in study participants
HOUSES and MMT
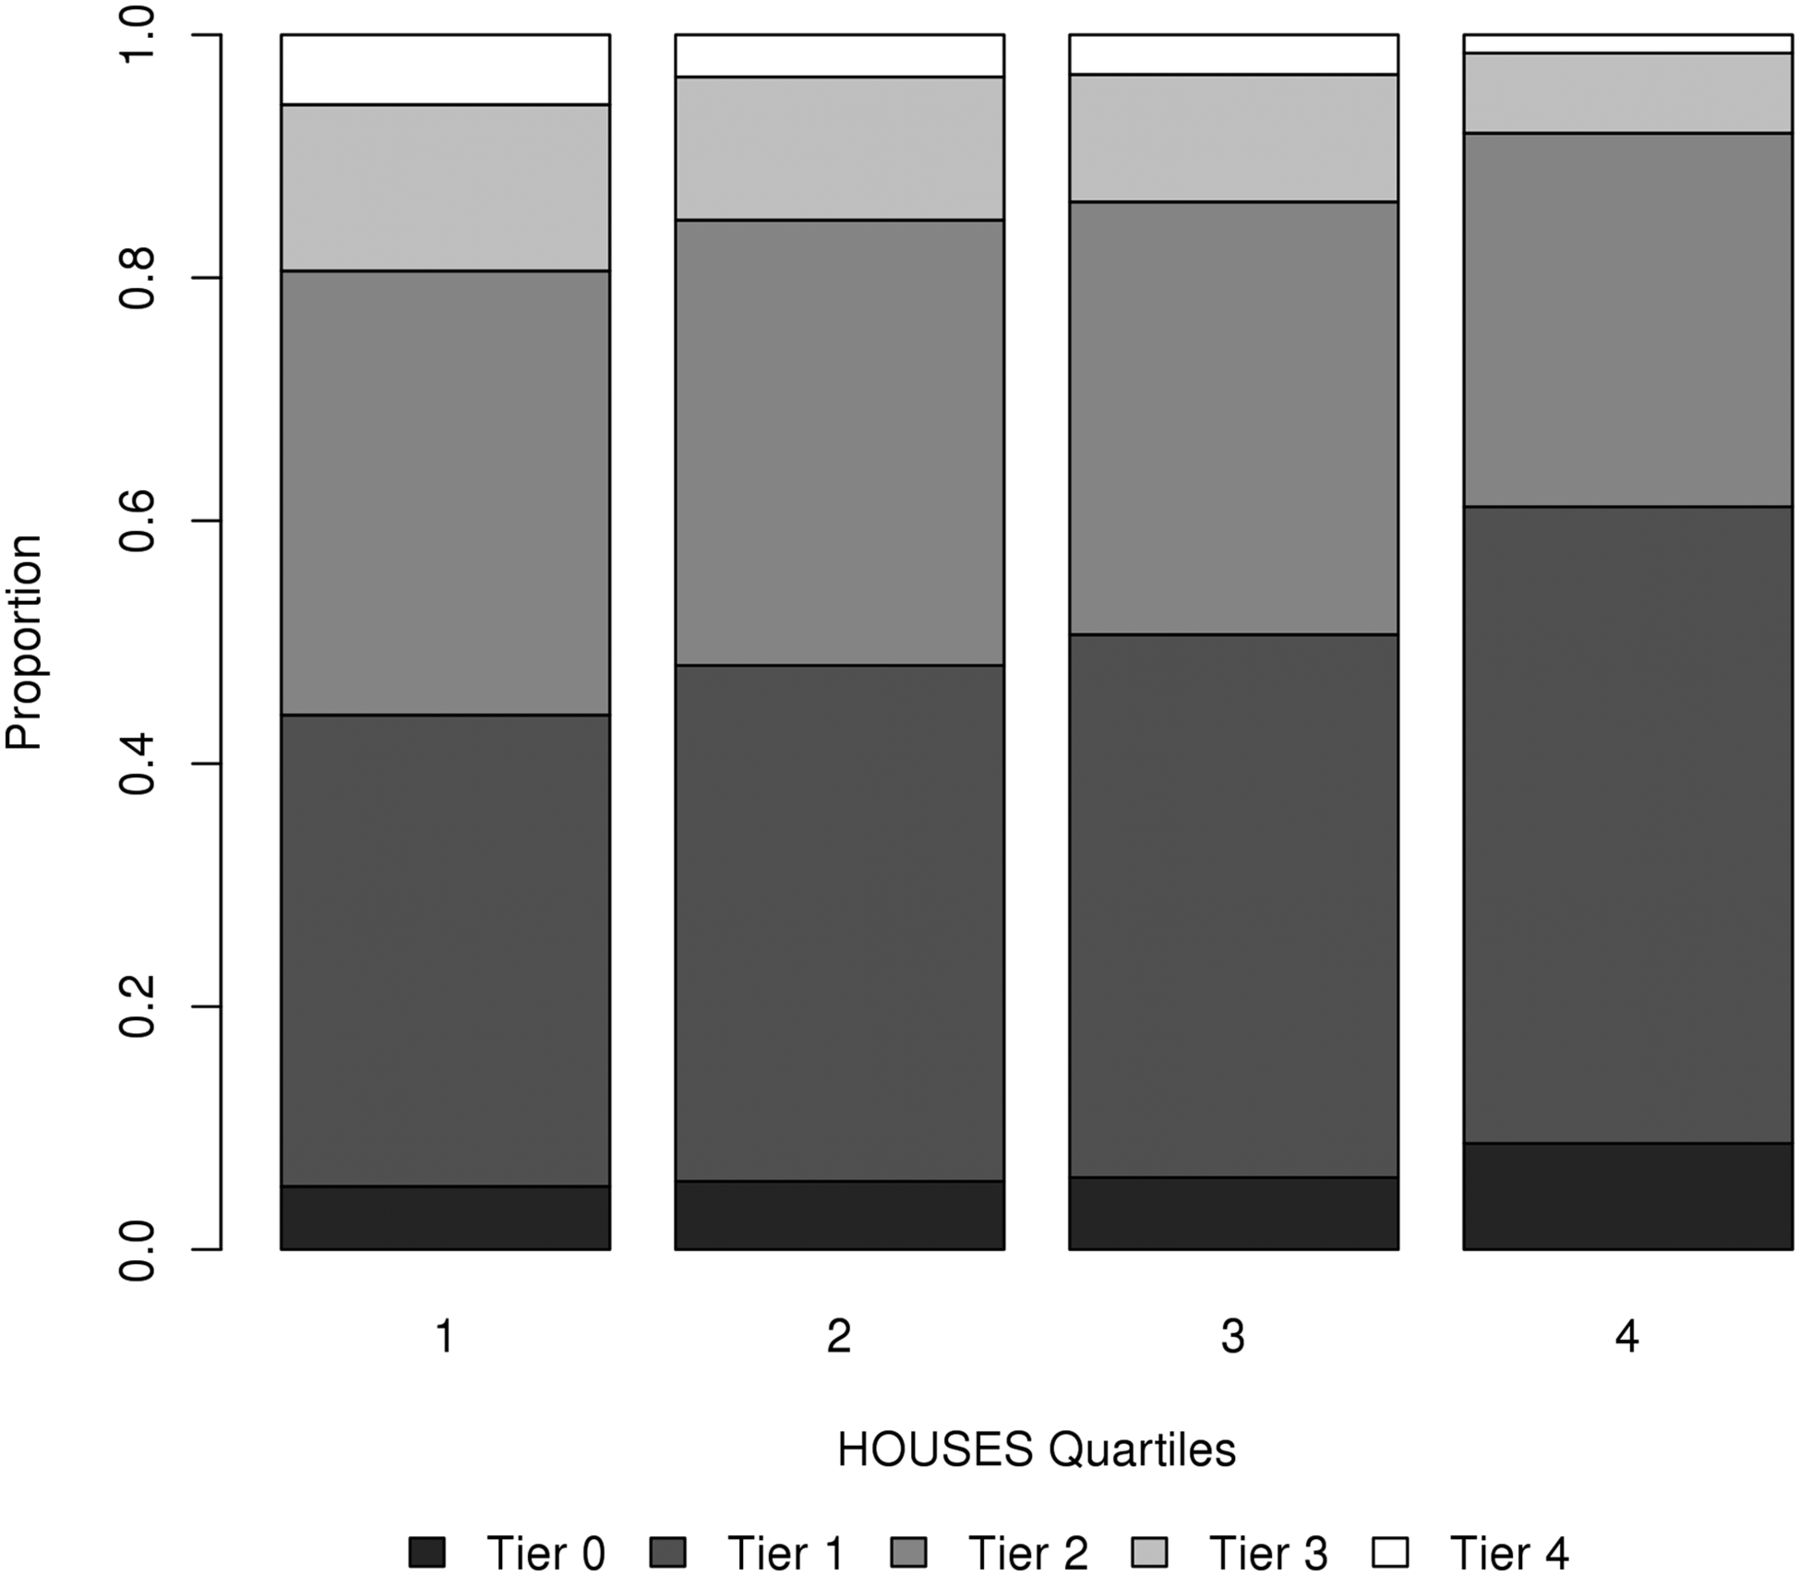
Table 2 outlines the counts and percentages of MMT by the HOUSES quartiles. Patients with a higher HOUSES score had a lower MMT score (figure 1), with the γ coefficient for degree of association at −0.17 (p<0.001). We found that only 1% of patients in the highest HOUSES quartile were tier 4 versus 3.5% of patients in the lowest quartile. When we dichotomised MMT into the highest (tier 3 or 4) and lowest (tier 0, 1, or 2) risks, we found that 14.3% of patients in the highest HOUSES quartile were in tier 3 or 4 versus 34.4% in the lowest quartile. The odds of a higher risk MMT decreases as the quartile of HOUSES increases (tier 3 or 4) (OR (95% CI) 2.7 (2.2 to 3.4) for lowest HOUSES quartile vs highest quartile). Patients in the lowest HOUSES quartile had an OR of 2.4 (95% CI 2.0 to 3.1) for being in tier 3 or 4 compared with the highest HOUSES quartile (see online supplementary table S2). Predictability of all three models was similar (AUC was 0.66 for model with HOUSES, 0.64 for model with education, and 0.66 for model with HOUSES and education). All three models were adjusted for age and sex.
Medical comorbidity determined through MMT and HOUSES index quartiles for 6402 patients

Relation between multimorbidity as determined by Minnesota Medical Tiering and HOUSES (housing-based socioeconomic status) index quartiles for 6402 patients.
HOUSES and hospitalisation
We found 200 hospitalisations (12.5%) over 1 year in participants in the lowest quartile compared with 93 hospitalisations (5.8%) in the highest quartile (figure 2). This finding shows that, after adjustment for age and sex, the lower the HOUSES index, the higher the risk of hospitalisation. When we compared the first, second and third quartiles to the fourth quartile, we found the following data: HR (95% CI) 1.78 (1.74 to 2.84); 1.45 (1.12 to 1.88); and 1.30 (1.0 to 1.69), respectively. After adjustment for age, sex and MMT, the effect was attenuated but stayed significant (HR (95% CI) 1.53 (1.18 to 1.98)) for the first quartile compared with the fourth quartile and for the third quartile compared with the fourth quartile (table 3).
Association of HOUSES index with risk of hospitalisation after adjustments for age, sex and MMT tiers

Kaplan–Meier curves comparing hospitalisation risk with HOUSES (housing-based socioeconomic status) index quartiles.
Discussion
In our cohort study, we found an association between lower SES as measured by HOUSES and an increased risk of future all-cause hospitalisation. The increased risk of being hospitalised in 1 year was greater than 50%, after adjustment for age, sex and MMT, for patients in the lowest HOUSES quartile compared with the highest quartile. In a previous study of the HOUSES index for 637 patients with myocardial infarction, a lower HOUSES score predicted death; however, it was non-significant after adjustment for age and comorbidity.20 In a systematic review of 27 risk prediction models for hospitalisation, 8 models included a measure of SES as a predictor of hospitalisation, with most accounting for living alone or the presence of a caregiver.30 The probability of repeated admission is a commonly used hospital predictor and employs informal caregiver status as a predictor for hospitalisation31; however, the team did not find a relation with hospitalisation and low income or race.31 Our findings suggest an association between SES as determined by housing characteristics of the patient and increased hospitalisation independent of age, sex and ongoing MCC health burden.
The findings that a lower HOUSES index is associated with higher hospitalisation use have clinical and public health face validity. We found that lower HOUSES quartile was associated with higher MMT score, which may account for some of the increased risk of hospitalisation. We previously reported higher risks of hospitalisations and emergency department visits for patients with MMT of 3 or 4 compared with lower tier scores.27 ACG, on which MMT is based, has also shown a relation between a higher ACG score and hospitalisation.32 After accounting for high MMT scores, we still saw an increased risk of hospitalisation among the patients in the lowest HOUSES quartile.
The living situation may account for health status beyond a comorbid health diagnosis. In the Health and Retirement Study, the 16 191 participants living in public housing were more than twice as likely to self-rate their health as poor or fair compared with participants living within the community.33
HOUSES had a moderate correlation with education levels, suggestive that HOUSES potentially captures a different construct underlying SES (eg, wealth) from education level. Because the AUC for models with HOUSES and the AUC for models with HOUSES plus education levels were the same, education level did not seem to improve predictability of MCC beyond the HOUSES predictability. Thus, HOUSES likely represents the constructs of SES that predict adverse health outcomes. In a systematic review of education and hospitalisation in heart failure patients, educational levels did not predict future hospitalisation.34
We are not sure why housing characteristics are associated with hospitalisation. Housing may reflect the physical environment of the house or the neighbourhood. For example, in the Health in Common study of 812 participants living in Boston, Massachusetts, those participants in low-income housing had greater exposure to pests, combustion byproducts, mould and ventilation problems.35 In people living in the lower HOUSES quartile, smoking may be more acceptable in their neighbourhood, which can be seen with persons living with lower SES.36 They also reported a low self-rated health level. The potential adverse health events from poor housing include mental health concerns, asthma, lead exposure and injuries.37 Patients living in low-SES housing may lack access to the ‘built environment attributes’ such as sidewalks or bike lanes or to nutritious food.38 In Rochester, the largest city in Olmsted County, many older adults living in the community lack access to various services within a walkable distance.39
The HOUSES index has potential advantages over other measures of SES. Its primary advantage is potentially that it overcomes the absence of SES measures in commonly used clinical or administrative data sets. We found that participants in the lowest quartile of the HOUSES index were more likely to omit self-reported education than those in the highest quartile, which suggests a potential systematic reporting bias. Another advantage is the dynamic ability to reflect changes in housing status. Education level is a common SES measure, with a relation to other health outcomes or behaviours in older adults.40 The measure is generally static after young adulthood. While education is generally static, changing homes is relatively common—thus, the dynamic nature of HOUSES. In 2012–2013, 11.7% of US households moved,41 although we do not have this information in our cohort. Some of these moves reflect changes going up or down in SES that may be captured in home characteristics; however, further work is required to quantify this detail within our population. The moves may represent a change in functional status or disability. Using an index that reflects these changes may be beneficial.
Another important advantage of using the HOUSES index includes the ability to account for changes in functional status, as well as economic status. We speculate that participants may move to smaller living environments as they get older and have functional disability with less ability to care for a bigger home. We found that 15% of participants in the lowest HOUSES quartile were older than 75 years compared with 4% in the highest quartile, indicating a higher concentration of older adults. However, the US Census suggests that poverty rates decrease after the age of 65 years;42 thus, the housing changes may reflect factors other than financial considerations.
The present study has some limitations. The primary outcome of MMT classification score is dependent on accurate coding of the medical diagnosis. Possibly, misclassification or missed diagnosis occurred if the patient sought care outside of the Mayo Clinic Health System. HOUSES may not completely represent SES because SES is a multifactorial classification. Our cohort was derived from the MCB and may not reflect a population-based sample, and may reflect some selection bias.22 In addition, Olmsted County tends to have a greater white population and higher education levels than counties nationwide. It represents the Upper Midwest of the USA and may not represent other populations.43 The use of geocoded data that form the basis of HOUSES may not be widely available, which may hinder the applicability to certain locations. Despite these limitations, the findings confirm other widely published results on SES and hospitalisation. Another important strength of our study is that both SES measure and health outcomes are based on objective measures instead of self-report.
Conclusion
We found that participants within the lowest HOUSES quartile had an increased risk of hospitalisation and MCC compared with those in the highest quartile. These findings provide evidence that HOUSES is a useful tool for clinical research concerning health disparities, as a surrogate measure for SES. These findings also provide further evidence of the connection between SES measured by the HOUSES index and health outcomes. The clinical utility involves further emphasis on the broader understanding of health in the social context.
What is already known on this subject
Socioeconomic status impacts health outcomes and the burden of chronic illness; however, information on education or other measures may be missing or inaccurate in the medical record. The HOUSES index is an individualised, housing-based socioeconomic status measure that potentially overcomes the unavailability of socioeconomic status in commonly used data sources for research and patient care.
What this study adds
The HOUSES index predicts future hospital utilisation and multiple chronic conditions and may help better predict which patients have greater medical and social needs.
Acknowledgments
The authors acknowledge the Robert D and Patricia E Kern Center for the Science of Health Care Delivery for funding support, as well as the Mayo Foundation for Medical Education and Research
References
Supplementary materials
Supplementary Data
This web only file has been produced by the BMJ Publishing Group from an electronic file supplied by the author(s) and has not been edited for content.
- Data supplement 1 - Online supplement
Footnotes
Contributors All the author reviewed and made modifications to the manuscript. This included adding intellectual content to the manuscript. PYT, ER and YJJ were responsible for design, execution and analysis. MAH was responsible for execution and analysis. JEO, SJB and JRC were responsible for design and analysis. JR-W was responsible for execution.
Funding This publication was supported by grant number UL1 TR000135 from the National Center for Advancing Translational Sciences.
Competing interests PYT serves on a medical advisory board for Axial LLC.
Ethics approval Mayo Clinic Institutional Review Board.
Provenance and peer review Not commissioned; externally peer reviewed.