Article Text

Abstract
Background Multiple approaches that can contribute to reducing obesity have been proposed. These policies may share overlapping pathways, and may have unanticipated consequences, creating considerable complexity. Aiming to illuminate the use of agent-based models to explore the consequences of key policies, this paper simulates the effects of increasing neighbourhood availability of good food stores, physical activity infrastructure and higher school quality on the reduction of black/white disparities in body mass index (BMI) in the USA.
Methods We used an agent-based model, with parameters derived from the empirical literature, which included individual and neighbourhood characteristics over the life course as determinants of behaviours thought to impact BMI. We systematically varied the strength of the 3 policy interventions, examining the impact of 125 different policy scenarios on black/white BMI disparities.
Results In the absence of any of these policies, black/white BMI disparities generally increased over time. However, we found that some combinations of these policies resulted in reductions in BMI, yielding decreases in the black/white BMI disparity as large as a 90%.
Conclusions Within the structure of relationships captured in this simulation model, there is support for the further use of agent-based simulation models to explore upstream policies as plausible candidates for the reduction of black/white disparities in BMI. These results highlight the potential insights into important public health problems, such as obesity, that can come from uniting the systems science approach with policy analysis.
- OBESITY
- EDUCATION
- PUBLIC HEALTH POLICY
Statistics from Altmetric.com
Background
Obesity is a serious and growing problem for the public's health,1 with considerable impact on population health. The Foresight group's2 systems map of the drivers of obesity illustrates the many pathways over different and interactive levels, and with multiple feedback loops, that are implicated in the obesity system. It is increasingly recognised that to reduce obesity, researchers, practitioners and policy makers need to confront a complex dynamic system.3
Most of the extant literature focuses on independent determinants of obesity. The search for independent causes is widely pursued because it has the potential to suggest targeted and focused interventions. However, research and interventions informed by the search for independent causes may mislead by oversimplification. For example, over the life course, people move between neighbourhoods and change behaviours. Many of these influence determinants of BMI and they feedback on each other, creating a dynamic pattern that further changes with residential mobility. Residential mobility changes neighbourhood composition, and these changes in composition, in turn, change access to neighbourhood resources with resultant changes in individual behaviours, thereby affecting inflows and outflows from the neighbourhood, and changing social influences and norms that may affect diet and physical activity. In short, this is a dynamic system with many characteristics influencing each other. It is a multilevel system with cross-level interdependence and feedback, people with heterogeneous characteristics, and interdependence between individuals, with change over time. It is a system potentially characterised by many positive feedback loops, allowing considerable dynamic, non-linear behaviour. All these are characteristics that suggest the use of an agent-based model.
Embracing the dynamic, complex, multifactor and multilevel nature of a system holds promise from both an analytical and conceptual perspective. Computer-based simulation models make it possible to begin to model the complexities inherent in the obesity system. For example, agent-based modelling techniques can be designed to capture the key characteristics of the obesity system: multiple levels of analysis, interdependence between levels, heterogeneity in agents/actors, and interdependence within levels (eg, between individual people in a social network). In short, the agent-based modelling approach captures both the microlevel detail (similar to microsimulation models), and the interindividual and social network processes in a dynamic framework. Further, in terms of policy and intervention, agent-based models can test what-if scenarios in a way that is transparently related to key policy levers.
In this paper, we use an agent-based model to provide a proof-of-concept of the use of such a model to explore what might happen to body mass index (BMI) disparities between blacks and whites in the USA under conditions where multiple policies are implemented in parallel. It is important to establish the relative effects of various policies on BMI. However, and perhaps even more importantly, many of the multiple overlapping and interacting pathways that potentially mediate the effects of these policies on BMI and disparities in BMI are affected by these policies, making it difficult to understand the effects of one if not considering the other. In addition, these separate and overlapping pathways are part of a complex system in which it is possible that certain combinations of policies may emerge as particularly efficacious in reducing BMI black/white disparities. Therefore, we used a complex systems approach that captured some of the inherent complexity of the obesity system and allowed us to conduct simulations of what-if policy scenarios specific to the implementation of multiple policies.
Methods
Overview of the model and simulations
The population of agents in our model represented the economic and racial distributions of black and non-Hispanic whites in the 100 largest metropolitan statistical areas in the USA. For the purposes of the simulation, there were 64 neighbourhoods, each with 25 households, with the racial/ethnic and economic distributions of these neighbourhoods matched to empirical data sources.4 Please see the online supplementary material for details on these procedures.
Supplemental material
Policy simulations were run for 100 time steps, approximately 2.5 generations, during which agents in the model were born, changed neighbourhoods (residential mobility), went to school at age 6 years, got jobs after they left school, retired at age 65 years, had one child at age 25 years, and died at age-specific rates reflective of the US population. In the process, these agents exhibited health behaviours (smoking, diet, exercise) that produced health outcomes (BMI, cardiovascular disease and death). These health behaviours were dependent on the agent's education level, neighbourhood school quality, neighbourhood physical activity infrastructure, access to healthy foods and the behaviours of others. The agents were connected via social ties (to represent social networks) and social norms affected the extent of social influence. The parameters in the model were, wherever possible, based on published reports, as described below and in the online supplementary material. At initialisation of the model, distributions of BMI, income, education, diet and physical activity levels were based on national data (National Health Interview Survey (NHIS), census and other sources) as indicated in the online supplementary appendix.
Policy variables and their pathways
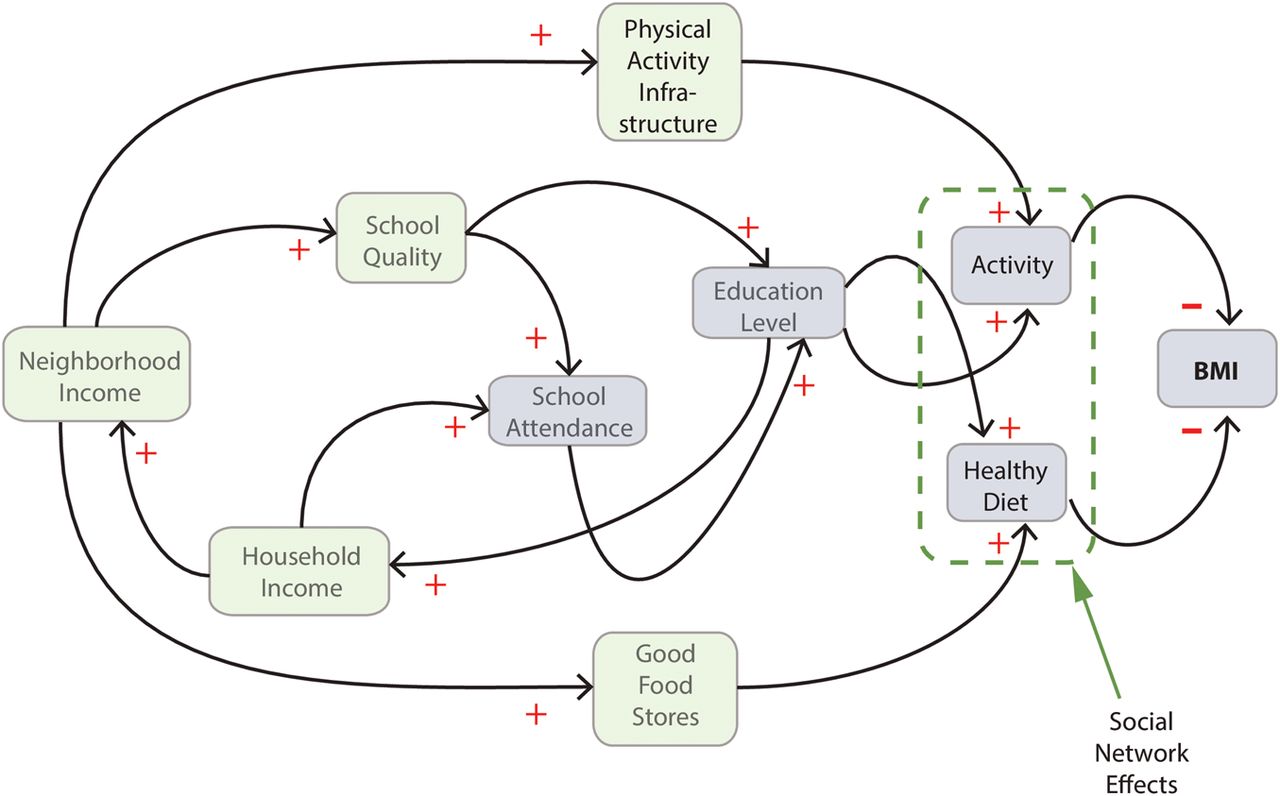
The key policy variables, good food stores, physical activity infrastructure and school quality were conceptualised as neighbourhood-level variables. Figure 1 illustrates the chain from the policy variables to BMI in our model. We describe the logic behind our model below, with details in the online supplementary material.

Diagram of agent-rule structure related to agent body mass index (BMI). The light-green boxes depict neighbourhood-level variables; light-blue depicts agent-level variables. The dotted-green circle highlights that an agent's diet and activity behaviours are also a function of direct social ties to other agents in the agent's social network. The red plus and minus signs express the nature of the causal rule; positive is direct, negative is inverse.
Good food stores reflected the number of supermarkets per 10 000 people in a neighbourhood. The link between neighbourhood income level and good food stores was derived from a study that investigated neighbourhood characteristics and access to different types of food stores.5 We note that a recent systematic review indicates some uncertainty as to the impact of neighbourhood food environment on obesity.6
School quality was designed to reflect neighbourhood-level student-teacher ratios. Although not the only determinants of school quality, student-teacher ratio is associated with the economic returns from increasing education, and some evidence suggests other benefits as well.7–9 The amount of variation in school quality was derived from a study that established its empirical variation.10 School quality directly affected the number of years an agent attended school; an agent's education level was a function of both school quality and the number of years of school attendance.
Physical activity infrastructure reflected the varied environmental correlates of physical activity as measured in the Physical Activity Neighborhood Environment Survey (PANES).11 Specifically, in our model, physical activity infrastructure reflected the seven-point neighbourhood environment index (0–6) derived from PANES in prior work.12
In the model, the most proximal drivers of BMI were healthy diet and activity, our measures of diet behaviour and physical activity, respectively. Healthy diet was designed to reflect the quality of nutrient intake per the Healthy Eating Index–2005.13 We derived the relation between good food stores and healthy diet from a study on the relation of healthy food in nearby food stores and a healthy diet.14 The relation between education level and healthy diet was established using a study on the relation between education level and fruit and vegetable consumption.15
Activity was meant to reflect the number of MET-hours/week for each agent. The relationship between activity infrastructure and activity was established using data on the relation between the built environment and activity levels12; the link between education level and activity was derived directly from the 2007 National Health Interview Survey (NHIS).16
Outcome variable
As shown in figure 1, BMI was a direct function of diet and activity. Our assumption regarding the influence of healthy diet on BMI was chosen to match the cross-sectional relationship between the Healthy Eating Index (HEI-05) and BMI.17 The influence of activity on BMI was derived from a meta-analysis on the effects of activity on weight loss.18
The primary outcome is the average difference in BMI between blacks and whites (BMI Disparity Index). Each of the 125 policy conditions (defined below) was simulated 20 times. Each of the 20 simulations, within a condition, produced a time-series of BMI for each race (ie, a BMI value for each time step from time steps 1 to 100). For each policy condition and each race, we calculated the average of the 20 BMI time-series separately by race. Finally, we computed the BMI Disparity Index for each policy condition by subtracting the average white time-series from the average black time-series, thus producing a BMI Disparity Index across time steps in the model, that is, a time-series of the BMI Disparity Index.
Model analysis and experimental design
Policy manipulations
We ranked the neighbourhoods on each policy variable, and the bottom 20% in each policy domain were targeted for the intervention. We created 125 separate conditions, each representing a unique combination of the three policies and five policy strengths. We varied the strength of each policy manipulation by five levels. The strength of the policy manipulations in our simulation experiments varied from one to four SDs from the average (which was computed empirically within the agent-based model). For example, given a policy manipulation of one SD in school quality, we first computed the average and SD of school quality at initialisation of the simulation. Then, we computed the level of school quality that is equal to one SD above the mean (mean plus 1 SD), and assigned this value to all of the neighbourhoods in the lowest 20% of school quality. Table 1 shows the values of these manipulations in real terms.
Strength of policy manipulations in real terms
Under the conditions of multiple simultaneous policies, the targeting operated independently among the policies. Policies were implemented on start of the simulation and remained in force for its full duration.
Statistical analysis
The analyses were conducted in four steps. First, we calculated the percentage of the 125 conditions for which the value of BMI at the end of the simulation was higher than at the beginning separately for blacks and whites. We used this to rule out the possibility that reductions in BMI disparities were generated by increases in BMI for whites. Second, we calculated the average BMI Disparity Index for each policy by policy strength, averaging across all simulation time steps. Third, we plotted the BMI Disparity Index for all 125 conditions at time steps 20, 30, 40, 60 and 100 using a heat map. In the heat map, we present the percentage of change from baseline of BMI Disparity Index defined as baseline minus time step X (positive values mean that the BMI Disparity Index lessened). Baseline was defined as the BMI Disparity Index at the beginning of the simulations under the condition in which none of the three policies were implemented. To give a sense of change over time, the heat map presents five time steps (20, 30, 40, 60, 100). Finally, we regressed the BMI Disparity Index onto the three policies using linear regression, separately for each of the time steps used in the heat map analysis (each of the 125 policy conditions was a data point). In this analysis, the policies were measured on a continuous scale in SD units to reflect policy strength—the value for the no-policy condition was the average number of SDs across policies for the lowest 20% of neighbourhoods, calculated empirically from the simulation. For each time step, we ran two analyses. First, all three policies were simultaneously entered without interaction terms. Then, we entered all two-way and three-way interactions between policies. If the results of the interaction model explained significantly more variance in the BMI Disparity Index, we present both analyses for interpretation.
Results
The percentage of the 125 conditions for which BMI increased over time was 6% for blacks and 3% for whites. Thus, reductions in the BMI Disparity Index (shown in the analyses below) were not due to increased BMI for whites.
Table 2 presents the average change across all time steps in the BMI Disparity Index, by policy strength for each of the policies. The three policies each had an impact on BMI disparities, and there was a graded relationship between policy strength and the extent to which disparities were reduced, with the greatest reduction, in absolute and relative terms, associated with physical activity infrastructure.
Average percentage change in body mass index (BMI) Disparity Index across policy strength over all time steps in the simulation
Figure 2 presents the heat map analysis. This analysis provides a graphic overview of the percentage of change in the BMI Disparity Index from baseline across all policy combinations for time steps 20, 30, 40, 60 and 100. We present this analysis, in part, to make the design matrix of the policy experiment more concrete and, in part, to provide an overview of how the BMI Disparity Index varied both across policy combinations and over time. From this analysis, it is clear that a variety of policy combinations led to decreases in the BMI Disparity Index. Furthermore, most of the conditions in which the physical activity infrastructure policy was strong showed a large reduction in the BMI Disparity Index. The same was not true for the good food stores and school quality policies. Finally, the overall pattern of results seemed to vary somewhat over time. At most times, an increase in physical activity infrastructure reduced the BMI Disparity Index, whereas strength of the school quality policy seems to have become more important over time. The impact of the good food stores policy was weakest and did not change much over time. Visual analysis of the heat map only provides a somewhat heuristic view of the simulation results. Next we present a more rigorous statistical analysis of these data.

Percentage change in the body mass index (BMI) Disparity Index across conditions by time steps. The heat map showing the percentage change in BMI Disparity Index from baseline across all 125 conditions, by time steps 20, 30, 40, 60, 100. The metarows represent each time step, the metacolumns represent school quality strength. The microrows/columns represent the strength of good food stores and physical activity infrastructure, respectively.
Table 3 shows the regression analysis at time steps 20, 30, 40, 60 and 100. Across the time steps, each of the three policy manipulations was independently (p<0.05) related to a decrease in the BMI Disparity Index when the interaction terms were not included in the analysis. The effects on the BMI Disparity Index were strongest for the physical activity infrastructure policy compared to the other two. Furthermore, the coefficient for the school quality policy increased systematically as time steps increased. Only at time step 100 did the interaction model fit better than the non-interaction model. In that case, the interaction model indicated that the effects of the good food stores policy was dependent on the school quality policy, and vice versa.
Associations between good food stores, physical activity infrastructure, and school quality and the BMI Disparity Index
Taken together, these results can be summarised as follows. First, all the policies had some effect, with physical activity infrastructure showing the strongest effect. Second, the effects of the school quality policy were time-dependent, becoming stronger as the simulation progressed. We hypothesise that the effects of school quality may have reflected two time delays, one related to the direct, shorter term effects of improved school quality as an agent progresses through 12 years of school, and the other related to indirect, longer term effects of neighbourhood change via a feedback loop that included school quality, education level, household income, neighbourhood income, and residential mobility. Third, the effects of the good food stores and school quality policies showed some signs of a multiplicative interaction, but only very late in the simulation, the nature of which can be described as the effect of school quality as slightly dependent on good food stores.
Discussion
These results indicate that an agent-based model can be used to encompass a number of the determinants of BMI, and they suggest that neighbourhood-focused upstream policies might reduce disparities in BMI between blacks and whites. This is in accord with the large literature on the important role of upstream determinants of population health.19–21
A key finding from our simulations is that reducing racial disparities in BMI using upstream policy may take time, and the time signatures of different policies may differ. This is not necessarily surprising, but simply reinforces the theme that even strong social policies may affect population health slowly.22 To some extent, this may reflect the process by which policies move through the population. For example, the impact of improving school quality on BMI would be expected to be slower than intervening on the food or physical activity environment, as it requires cohorts of students to move through the educational system. In fact, table 2 suggests that over time, the impact of school quality is accelerating, whereas the impact of improving the neighbourhood physical activity environment does not change much over time. Thus, the effects of upstream policies on population health and health disparities may manifest over a variety of time windows.
While part of the rationale for simultaneously examining multiple policies was the possibility that we might find potentiation or interference among them, we found little evidence for interaction, with interactions only appearing after 100 time steps of the model. While this evidence for interaction is interesting, one must be very wary of projecting so far into the future, as many of the parameter values that drive the simulation may change over time.
Although our model was based on hundreds of variables and parameters that were, where possible calibrated to existing data sources, the model is intended as a proof-of-concept and remains an abstract representation of what drives black/white obesity disparities in the USA, thus the results cannot be interpreted for policy purposes, but are only suggestive. There are a number of caveats. First, the scope of the model is relatively narrow. It does not incorporate many elements such as macroeconomic factors, the food production industry and market, the media, healthcare, and it excludes some important agent-level decision-making mechanisms, such as attitudes, beliefs and intentions. Second, some of the structures in the model are simplified in a way that does not afford an accurate representation of the US population—for example, agents have no gender and only a very simple social network structure, a relatively small preferential attachment network that is known to capture some but not all qualities of human social networks.23 An alternative for future research similar to what we presented here would be to use synthetic populations that capture key aspects of the US population,24 and to include more information regarding key issues such as a focus on changes in weight in children and adolescents, and inclusion of other racial/ethnic groups (eg, Latino). Third, the time-horizon of the policy scenarios was very long. While the BMI Disparity Index is essentially eliminated for some policy combinations after 20 years, our model did not capture long-term and large-scale population changes over time in social and economic conditions–for example, rapid changes in unemployment, changes in the real estate market, changes in corporate practice regarding targeted advertising for food products, which would potentially interact with the policies we modelled in unanticipated ways. Similarly, our model does not include several other population-level changes that are always in flux over time, such as changes in population age structure and the distribution of race/ethnicity. Fourth, the policy interventions are, in some cases, heroic, involving large changes from existing policies. Fifth, the model is, at its core, dependent on parameter estimates and temporal processes, where possible, gleaned from the existing literature. Given the absence of extensive meta-analyses in each domain, we chose best estimates for these based on our assessment of the literature. We include an extensive appendix that provides considerable transparency as to the bases for estimating, in some cases speculatively, the sources for these estimates. It would be reassuring to be able to conduct extensive sensitivity analyses for each of the parameters in the model, but the number of such analyses can increase exponentially with the number of parameters, thereby making such an exploration desirable but infeasible. While it is not possible to predict how the results will change as the literature in these areas evolves and improves, our simulation approach does make it possible to periodically update conclusions. Relatedly, although there are existing frameworks and methods for model validation (eg, see refs. 25 and 26 for two opposing but useful viewpoints), these are difficult to apply to abstract, proof-of-concept models, as the choice of validation targets are not obvious—for example, our model does not include gender, and has artificial geography, so it is not entirely clear what would be a valid BMI target.
Given these limitations which, presumably, resulted in our model showing a smaller black/white disparity in BMI than expected from the literature, the results of this modelling exercise should not be interpreted literally, but as a proof-of-concept that using a systems approach to study obesity disparities has great promise, an indication of the level of complexity and specification required for such a model, and as a tool for highlighting gaps in available empirical data to inform parameters. In fact, there is considerable strength that comes from being able to simultaneously simulate the impact of three upstream policies on disparities in BMI in a format that allows policy effects to evolve over generations, with a combination of policies that are unlikely to be simultaneously implemented in a population-based trial, and with processes such as individual preferences and residential mobility explicitly represented. While we believe that the use of a systems science tool, such as agent-based modelling, has much to offer, the enterprise is still very much in its infancy. With further developments, and with cross-fertilisation from other approaches, we may be able to move forward in understanding the critical challenges to population health and health disparities such as those represented by the obesity epidemic.
What is already known on this subject
Considerable evidence suggests that education and access to healthy food and physical activity are related to body mass index (BMI), and to differences in levels of BMI between population subgroups. Efforts to leverage these drivers of BMI must contend with the inherent complexity of what is considered the obesity system, a complex web of interacting social and behavioural processes.
What this study adds
A proof-of-concept that agent-based simulations can increase our understanding of the complexities and uncertainties in complex social health problems. Specifically, this study explored the potential to reduce disparities in body mass index between blacks and whites in the USA via large-scale neighbourhood-focused interventions that target quality of education and access to healthy food and physical activity infrastructure.
References
Footnotes
Funding Institute for Integrative Health; Network on Inequalities, Complex Systems, and Health (grant no. HHSN276200800013C); Robert Wood Johnson Foundation (grant no. 60466).
Competing interests None declared.
Provenance and peer review Not commissioned; externally peer reviewed.