Article Text

Abstract
Background Socioeconomic development has been considered as a solution to the problem of sex differentials at birth and under-five mortality. This paper analyses longitudinal data from the Ballabgarh Health and Demographic Surveillance System (HDSS) site in north India to check its veracity.
Methods A cohort of children born between 1 January 2006 and 31 December 2011 at Ballabgarh HDSS were followed till death, emigration, 3 years of age or end of the study. Socioeconomic status (SES) was measured by caste, parental combined years of schooling and wealth index and divided into low, mid and high strata for each of them. Sex ratio at birth (SRB) was reported as the number of girls per 1000 boys. The Kaplan-Meier survival curves were drawn and a Cox Proportional HR of girls over boys was estimated.
Results A total of 12 517 native born children (25 797 child years) were enrolled of which 710 died (death rate of 56.7/1000-live births and 27.5/1000 child-years. Socioeconomically advantaged children had significantly lower death rates. The SRB (10–16% lower) and neonatal death rate were consistently adverse for girls in the advantaged groups by all the three indicators of SES. The first month survival rates were better for girls in the lower SES categories (significant only in caste (HR 0.58; 0.37 to 0.91). High SES categories consistently showed adverse survival rates for girls (HR of 1.22 to 1.59).
Conclusions Better socioeconomic situation worsened the sex differentials, especially at birth. Therefore, specific interventions targeting gender issues are required, at least as a short-term measure.
- Child Health
- Genderi
- Social Class
Statistics from Altmetric.com
Introduction
Despite advances in medical technology and increased global wealth, and strong global and national commitments to the health of children, the health outcomes among children continue to be poor.1 In spite of the decreases in overall childhood death rates, inequalities between population subgroups persist and may actually have increased.1 ,2 It is important to focus on inequities in childhood as there is increasing evidence that the early years of development play a vital role in creating and maintaining socioeconomic and health inequalities through to adulthood.3
In the last decade, the social determinants of health have gained considerable interest. The social determinants of health, including gender, are mostly responsible for health inequities—the unfair and avoidable differences in health status seen within and between countries.4 The sex differential in childhood mortality in South Asia seems to contradict information from other parts of the world that girls are physiologically hardier than boys and therefore have a better chance of surviving early childhood.5 Inequities in child survival by both socioeconomic status (SES) and gender have been well documented in India and elsewhere.2 ,6–12 A higher girl child mortality and, more recently, an adverse sex ratio at birth (SRB) for girls in India and other Asian countries have been reported.13–15 However, the role of SES in gender differentials in survival has not been that well documented.16 ,17
Measuring inequalities in childhood mortality requires information, preferably at the individual level, on births and deaths or survival time, and on socioeconomic position, usually of the parents or household. In developing countries, where these inequities are more common, however, the vital registration systems are most inadequate.7 Moreover, births in poorer households and by less educated mothers are least likely to get registered as are births of girl children.18 Most of the existing studies at the national level are from large surveys like the National Family Health Surveys (NFHS).
Data from the NFHS show that southern states like Kerala and Tamil Nadu, which are ranked higher in development, have about 1.6 times lower gender differentials in child death rates as compared to northern states like Haryana and Punjab.19 These have largely been extrapolated to mean that socioeconomic development is a solution to the problem of gender inequity in child mortality. However, the use of NFHS data, which collect the reproductive history of the last 5 years from mothers, has been shown to have a bias in measuring the overall fertility, mortality and gender differentials, possibly owing to poor recall of deaths, especially of girl children.20 ,21 Data from Health and Demographic Surveillance Sites (HDSS) can fill this gap.
Our study setting is in a state in India which is one of the most prosperous and yet reports one of the worst statistics on the status of women and girl children.22 We have earlier shown that this problem has become acute in the last decade and would seriously impact the achievement of the Millennium Development Goals on child mortality in India.23 This study looks at gender differentials in child survival (at birth, at the end of 28 days and 3 years) by SES (as measured by caste, parental education and household wealth).
Methods
The study was conducted in 28 villages in the Ballabgarh block of Faridabad District, located in the state of Haryana in northern India. This population is a part of the Comprehensive Rural Health Services Project (CRHSP), a collaborative effort between the All India Institute of Medical Sciences (AIIMS) in New Delhi and the Government of Haryana. The CRHSP includes a 50-bed hospital, 2 primary health centres and 12 subcentres and covered a total population of 85 759 in 2009. Multipurpose workers (MPW) make home visits to facilitate the delivery of primary and preventive care and conduct demographic surveillance concurrently. In addition, they also undertake the annual census of each household in December every year and record vital events of births, deaths and migration. This site is a member of the International Network for the Demographic Evaluation of Populations and Their Health in developing countries (INDEPTH network).
All the demographic information of the population is kept in an electronic database at Ballabgarh. Each person in the catchment area is recorded in this database and has a unique health information system number assigned to him/her.24 While the population has been under surveillance since 1961, the data have been fully computerised since 1992. A cohort of all native born children in the HDSS area between 1 January 2006 and 31 December 2011 (6 years) was identified in the database. Their relevant information on the date of birth, date of death, date of emigration, caste, education of mother and father, birth order of child and wealth index was assembled. Right censoring was carried out at completion of age 3 years, death, emigration or 31 December 2011. Children who immigrated in between were not included.
SES measurement and classification
Three indicators were used to measure SES. Caste is a traditional measure of social position in India. It differs from other indicators in that it is both endogamous and hereditary.22 National and State Governments classify castes into Scheduled Caste and Other backward castes for affirmative action. We created a three-tiered classification by adding forward caste to the above two categories in this study. Parental education was an index created by combining years of schooling of the mother and father and, based on its distribution, divided into tertiles. Finally, SES of the family was measured by Wealth Index, as has been used in NFHS-3.25 It is a pure economic variable that measures the relative economic standing. It uses information on household assets and utility services to construct a score with relative weights derived through Principal Component Analysis. This procedure first standardises the indicator variables (calculating z-scores); then the factor coefficient scores (factor loadings) are calculated; and finally, for each household, the indicator values are multiplied by the loadings and summed to produce the household's index value. The resulting sum is itself a standardised score with a mean of zero and an SD of 1. On the basis of the distribution of the population, the cohort was divided into tertiles. Data on Wealth Index were separately collected in 2009–2010 and linked with the demographic database. Information on Wealth Index was available for 91.5% of the houses, mainly due to the houses being unavailable for survey.
The study used only anonymised secondary data collected as a part of ongoing healthcare service delivery system. The study was cleared by the Institute Ethics Committee of AIIMS.
Statistical analysis
Two types of analysis were performed. The first was to look at the conventional ways of reporting child mortality in terms of per 1000 live-births. The study used three points for estimation of sex-specific mortality.
-
At birth (survival from conception to birth)—SRB as girls per 1000 boys.
-
At the end of the neonatal period (28 days)—Neonatal mortality rate (NMR) per 1000 live-births.
-
At the end of 36 months—Under-3 death rate per 1000 live-births. We analysed data for infancy as well but found that in the postneonatal period till 3 years, the gender differential in mortality keeps the same pattern and therefore can be logically clubbed.
The analysis compares SRB, sex-specific neonatal and 1–36 month death rate (per 1000 live-births) for three strata by each of the three SES indicators.
If we divided the births of 6 years into roughly three equal groups, we expected each strata to have about 4000 children. To estimate a relative risk of 1.6 between the high and low SES categories (with states as proxy as referred to above) with an expected excess girl child mortality of 15/1000 live-births in the high SES category as seen from our data before, we would have a power of 80%.
We also performed survival analysis using a person-time approach. The Kaplan Meier survival curves were generated by sex for different strata of each SES indicator, and a log-rank test was applied for testing the significance of difference. We present graphs only of the high and low socioeconomic groups of each indicator for clarity. The Cox proportional HRs (95% CI) of mortality for girls (boys as a reference group) were calculated for children in the stratum of each SES indicator after adjustment for birth order, distance to Ballabgarh, presence of health facility and other two SES indicators. The tests for collinearity and interaction between the three indicators of SES did not indicate any problems that needed to be taken care of. Clustering of children in the same family was adjusted for in the Cox regression analysis by using the variance estimator function in Stata to allow for independent observation of children across the family, but not within the family. All statistical analyses were carried out using Stata (Release 12, StataCorp LP).
Results
A total of 12 517 native born children were enrolled in the study during the 6-year period (2006–2011) providing a total of 25 797 child years. During this period, 479 (3.8%) children migrated out of the study area. A total of 710 children died during this period, giving a death rate of 56.7/1000 live-births in the under-3 year age group and 27.5/1000 child-years. Overall, 33% of mothers and 11% of fathers were illiterate. There was significant correlation between the total years of parental schooling and wealth index score (r=0.53). Children in the lower caste groups had a significantly lower wealth score compared to those in the highest caste group. The same pattern was observed in years of parental schooling (mean of 10.2 years in the lowest caste group vs 18 years in the highest caste group).
The total births, deaths, period of follow-up and death rates for each stratum of SES by caste, parental education and Wealth Index are given in table 1. As expected, children from higher socioeconomic strata had significantly lower death rates by all three indicators, most prominently in parental education and least prominently by caste. Children belonging to parents in the highest tertile of education showed 72% (11.7 vs 42.4) lower mortality compared to those with parents in the lowest tertile of education. Children belonging to a forward caste family had 39% (23.3 vs 38.1) lower death rate than those belonging to the scheduled caste.
Death rate in different socioeconomic groups in the study cohort from birth to 3 years at Ballabgarh, 2006–2011
In the population, the overall SRB in this time period was 827 against the international average of 952 girls per 1000 boys (table 2). On the basis of all the three socioeconomic indicators, girl child survival to birth from conception was better among the disadvantaged. However, even in this group the sex ratio (886–895) was adverse to females. The difference in SRB across the socioeconomic spectrum was significantly high for education (16% lower in the highest tertile compared to the lowest quintile) and wealth index (14.2%) but not by caste (10.5%).
Sex ratio at birth per 1000 boys (95% CI) among different socioeconomic strata in Ballabgarh, 2006–2011
Overall, there was a slight excess of NMR in girls (25.9 vs 23.5/1000 live-births) against the global norm of a slightly excess mortality among boys (table 3). In the lowest SES strata, on the basis of all the three indicators, there was lower neonatal mortality among girls as compared to boys, and the gap was least in the less educated and most by caste. The neonatal death rates were consistently lower among high SES strata as compared to low strata in all the three SES indicators. This was 2.6 times for parental education (32.3–12.3) and 1.4 times by caste-based groupings (31.0–23.0). The gradient of NMR decrease across the SES strata was more prominent among boys (2–3 times lower in the high groups) than among girls (1.5–2 times lower in the wealthy and educated class). This steeper decline in mortality for boys belonging to a higher SES resulted in an increase in the gender differentials in NMR at higher SES, with the highest strata surprisingly showing the severest of the gender differentials.
Neonatal death rate (95% CI) per 1000 live-births by SES categories in children of Ballabgarh, 2006–2011
Children aged 1–36 months in the high SES groups had a significantly lower mortality, and this pattern was consistent with that observed during the neonatal period (table 4). This social gradient was most prominent (4.5 times) by parental education (50.3–11.3) and 1.8 times by caste (46.8–25.4). In contrast to results from the neonatal period, girls fared worse in all SES groups by all the three indicators. However, the gap in the death rates between the boys and girls narrowed from being 1.5 to 1.7 times higher in the lowest category to 1.3–1.5 times higher in the highest category, indicating a slight improvement in the situation of girls in higher SES groups.
Postneonatal to 3-year death rate (95% CI) per 1000 live-births by SES categories in children of Ballabgarh, 2006–2011
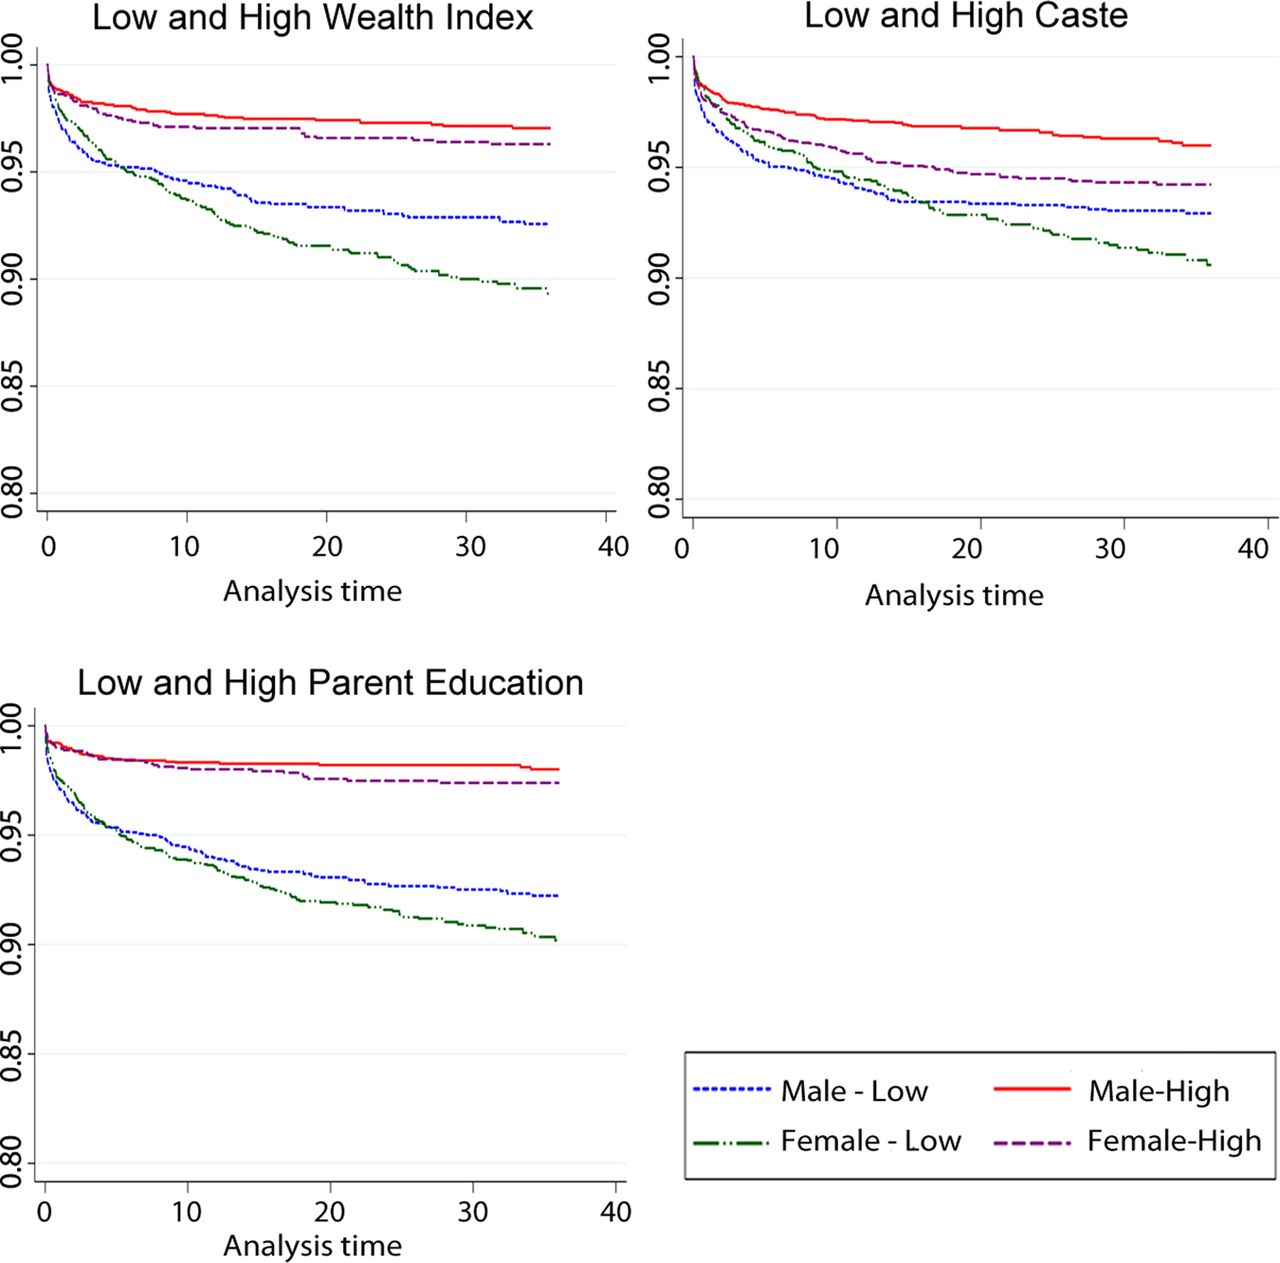
The Kaplan Meier survival curves for the high and low categories by the three indicators are shown in figure 1. In the high wealth index category, the survival curves for the two sexes overlapped for the first few months and then diverged with boys faring better (p=0.2). Among the low wealth index category, however, girls had better survival till about 6 months, after which the lines crossed and the gaps widened in favour of the boys (p<0.01). Though children in the higher educated parents’ groups had better survival than those in low SES, no significant gender differences in mortality were observed in both the high (p=0. 0.26) and low (p=0.06) educated groups. On the contrary, the gender difference was significant in the higher caste group (p<.001) but not in the lower caste group (p=0.14). Among the low caste groups, the girl advantage in survival was seen till 12 months, whereas in the high caste group, better survival rates of males was seen right from the birth.

Kaplan Meier survival estimate till 36 months of age for boys and girls by socioeconomic status category. This figure is only reproduced in colour in the online version.
Survival rates were consistently in favour of boys after the first month till the end of 3 years (table 5). By all the three indicators, the first month survival rates were better for girls in lower SES categories (though it was significant only in caste (HR 0.58; 0.37–0.91). In the first month, a trend (non-significant) of higher HR was seen in higher SES categories, whereas no specific trend was seen in the 1–36 month period. High SES categories consistently showed adverse survival rates for girls (1.22–1.59). As the gender differentials by SES categories in neonatal and postneonatal mortality were in different directions, the overall mortality differential by gender seems to have been masked.
Cox proportional HR (95% CI) for girls compared to boys for survival from birth to 36 months
Discussion
The basis for this study was enquiry into stagnant child death rates in the study area despite a well-functioning primary healthcare system, resulting in high coverage with government programmes targeting child survival as well as improving socioeconomic situation, better communication and connectivity. Our study shows that fewer of the conceived girls survived to birth as compared to boys, and this was more prominently observed in the high SES groups. After the neonatal period, where again the sex differential in mortality was unexpectedly adverse for girls in the high SES groups, excess girl child mortality was seen at higher levels in the low SES groups. Girls from high SES had better survival than both boys and girls of low SES groups, though it was still lower than boys of the same SES group. Overall, non-survivor girls were more due to the loss in the early period of life, and thus SES seems to be, in fact, hampering gender inequality.
The important causes of death in the neonatal period are low birth weight, birth asphyxia (within the first 7 days) and sepsis (after 7 days). Data from this area showed that sex differential in neonatal mortality is seen after the first 7 days and is largely mediated by a complex process of both gender-related child neglect and inappropriate seeking of healthcare. Recent data when the gender neglect was at its peak showed that this had made inroads into low-birth-weight-related mortality, probably due to denial of high cost care to girl children with low birth weight.23 In the postneonatal period, diarrhoea and malnutrition are the main causes of death that show major gender differentials and are again mediated by the same process of neglect in child rearing and seeking of healthcare. Unlike this, the cause of adverse SRB is largely due to seeking care to determine the sex of the child and aborting the female child.
Education
Education is perhaps the most studied social determinant of child mortality. In their analysis using village level census data, Deolikar et al17 found a strong negative effect of female literacy rates on juvenile sex ratios, with a one percentage point increase in female literacy reducing the juvenile sex ratio in a village by as much as six points. Using a large household dataset from a special fertility and mortality survey conducted in India in 1998, Jha et al26 found that the sex ratio among children was considerably more skewed (towards males) among educated mothers than among illiterate mothers. On the basis of a model of district level data of the 1991 census of India, Echavarri et al16 showed that there is an inverted U relationship between literacy rates and juvenile sex ratios. They reported that as the share of the literate population increased, SRB (expressed as boys per 1000 girls) tended at first to increase (more boys are born) but beyond levels of literacy situated at around 55% of the total population, a negative correlation between education and SRB was found. In the current study area, the literacy levels were 67% and 89% among mothers and fathers. We believe that for education to be effectively empowering, there should be education beyond school, that is, at the college level where critical thinking and exposure really happens and/or a larger proportion of the girls/population get educated so that there is a critical mass for change in thinking to happen at the community level. In our study area, less than 7% of mothers and 14% of fathers had education beyond school level.
Research on child mortality suggests that parental education is associated with better child care, better healthcare utilisation and higher value being placed on children, with greater autonomy.10 ,27 Education may be considered an instrument of preference change, due to enhancement of freedom and the power to question and reassess the prevailing son preference. However, it is being seen that due to efficiency considerations for achievement of family size and use of family resources, this has paradoxically increased the individual's freedom and power to have access to prenatal sex-detection technologies.16 ,28 ,29 The reverse association between female literacy and juvenile sex ratios may have other explanations as well. Female education and literacy are one of the strongest determinants of fertility decline in India,30 and fertility decline is typically associated with lower juvenile sex ratios. This was interpreted by Basu to indicate that the core level of son preference in India may actually be strengthened by ‘modernisation’ (eg, education) of women.31
Income/Wealth Index
Using a panel dataset of Demographic Health Surveys (DHS) surveys across Asian and African countries, Ueyama showed that income growth is positively associated with a reduction of antifemale bias in child mortality in most developing countries, which made him postulate that antigirl bias in South Asia will decline at a rate similar to those in other regions as income rises.6 However, the majority of previous studies have shown that the degree of gender bias is not correlated with socioeconomic conditions, such as poverty and income level, but is determined by social norms and customs.28 ,32
Given the strong male preference in the community, parents are not ready to commit resources to girl children. Traditionally, this has been seen in terms of denial of curative healthcare.33 ,34 The higher the ‘cost of treatment’ (distance to health facility, treatment in private sector), the more likely the denial will occur. In prenatal sex determination, it is the cost of sex determination by ultrasound followed by an induced abortion which is likely to be much higher than the cost of treatment of most childhood illnesses like diarrhoea or pneumonia. Some studies have shown that parents were ready to take a loan for getting sex determination followed by abortion as this saved them from taking a much higher loan later for marriage expenses. The awareness, accessibility (transport) and affordability of care is likely to be better among the more educated and wealthy class. The lower level of denial of care to girl children is also more likely in the high SES stratum as the incidence of diseases is known to be less.
Caste
At the macro level, Deolalikar et al17 have reported that villages with a higher scheduled caste population had higher juvenile sex ratios. Echavarri et al16 did not find caste to be a significant determinant of SRB. In NFHS 3, wanting to have at least one male child (an indicator of son preference) was more uniform across caste groups as compared to across education or wealth index groups.35 The use of ultrasound during pregnancy (a proxy for fetal sex determination) has been shown to be strongly related to parental education and wealth index and less so for caste.36 ,37 Thus, it appears that the role of caste is overshadowed by education and income. However, other researchers have made a case for including caste as a socioeconomic indicator apart from Wealth Index.22 ,38 Also, it has been shown that Haryana state, despite having a high per capita income, has the poorest record among the states for bridging the caste disparities.22
The strength of the study is the use of good-quality longitudinal individual level data and use of multiple indicators of SES. We chose to use three measures of socioeconomic position—caste, Wealth Index and parental education as they cover different domains, and from our past experience of working in this area, we knew that this could be important in understanding the changes in the community. Caste is generally unchanging throughout the life course and is a good measure of social status which may largely decide the customs and social mores. Wealth Index is based on material possession and focuses mainly on economic aspects. It is developed for households; hence, two or more children in the same household will be in the same tertile when we analyse the data at the individual level. Also, the indicator only measures the relative economic standing and not the absolute one. Parental education is basically a measure of empowerment that indicates how parents are able to negotiate for a better outcome given their social and economic status. However, these several measures of socioeconomic position are not interchangeable and show the complex sources of socioeconomic disadvantage in India, which also complicate a public health response to the problems.39
The main limitation of the data was the non-availability of Wealth Index information for about 10% of the households. We used data from 2006 to 2011 to attain the desired sample size. As the data for Wealth Index was collected only in 2009–2010, we felt that the assumption of stability of Wealth Index over time could be taken only thus far. Other limitations included the non-availability of information on other possible confounders that might influence child mortality such as nutritional status, care seeking, etc. The unanticipated difference in directions of association between gender gap and SES for neonatal and 1–36 month mortality reveals the importance of looking at stratified results, as aggregated results can mask the inequity across population subgroups. The study area is a typical north Indian rural setting which covers a wide expanse of states in north and north western India (Uttar Pradesh, Haryana, Punjab, Rajasthan and Madhya Pradesh), covering almost a third of the country's population. However, it is admitted that the complex interplay of caste, income and education could be played out differently in other parts of the country. Increasing sex discrimination at the prenatal and neonatal stages, followed by a narrowing of the sex differential in the higher age groups in a high SES population, could be due to a survival bias. In high SES, girl children who survive are wanted and are therefore less likely to receive differential treatment.40
The study shows that increasing education and income levels occurring in the context of pre-existing feudal social structures and attitudes could result in the misuse of ‘newfound knowledge and wealth’. In this case, sex determined abortions. Thus, there could be a worsening of the situation if the lower socioeconomic groups decide to imitate their more advantaged brethren. Similar evidence exists in the area of non-communicable diseases where, as SES improved initially, the families and individuals were more likely to have higher risk behaviours like smoking, alcohol use and inappropriate diet. After some time, this social gradient is reversed and higher SES regains its ‘healthy’ status.41 ,42
This means that there are not going to be any short-term solutions to this serious gender inequity issue. It is also clear that we cannot hope for socioeconomic development to take care of this problem in future and there is a need for specific interventions to address gender imbalance. This includes the creation of an enabling environment for individuals to make the right choices. Social norms and customs have to be challenged. The wealthy and more educated group has to take the lead in this social transformation, as is true for addressing all social evils. Women's empowerment programmes, including women's education and income generation schemes implemented through the local governments (Panchayats), have to become functional. Till now, government's efforts in this front have largely focused on controlling access to ultrasound technology, which does not seem to be sufficiently well enforced to make a difference.43 Conditional cash transfer schemes have been initiated to improve child survival, but their appropriateness and effectiveness need to be evaluated. Ultimately, this problem calls for a social transformation on the way girls and women are treated in the society. Though this is beyond the scope of the Health Ministries, they can catalyse a ‘whole-of-government’ response to enable such a transformation to take place.
What is already known on this subject
-
There are significant gender differentials which are adverse to girls, especially in South Asia.
-
It is generally believed that these differentials will narrow as development progresses with better education and incomes.
What this study adds
-
Improved education and income levels in the backdrop of underlying feudal social structures and attitudes in north India worsen the sex differentials especially for sex ratio at birth and neonatal mortality.
-
Therefore, specific interventions targeting gender issues are required as a short-term measure.
References
Footnotes
-
Contributors KA conceived the paper, designed the analysis and wrote the first draft. VG and PD retrieved the data from the database, managed the analysis and provided comments on the manuscript. CSP and PB provided critical inputs into the study design and analysis and reviewed the manuscript. NN rechecked the design and analysis, reviewed the manuscript and is the guarantor of the paper.
-
Funding This research received no specific grant from any funding agency in the public, commercial or not-for-profit sectors.
-
Competing interests None.
-
Ethics approval AIIMS Institutions Ethics Committee.
-
Provenance and peer review Not commissioned; externally peer reviewed.