Article Text

Abstract
STUDY OBJECTIVE To assess the validity and factors related with the validity of self reported numbers of visits to a primary health care centre, in comparison with the recorded number.
DESIGN Cross sectional study.
SETTING The urban area served by the Zaidín-Sur Primary Health Care Centre (Granada, Spain).
PARTICIPANTS Two population samples (236 high users and 420 normal users) who were seen at the centre from 1985 to 1991 were interviewed in 1993.
MAIN RESULTS A net tendency to overreport the actual number of visits was observed. Absolute concordance between self reported and recorded utilisation decreased as time interval lengthened, although this mainly reflected the increase in maximum variability both with time interval length and with the number of recorded visits. Corrected Spearman ρ coefficients obtained between the number of self reported and recorded visits ranged from 0.602 for the two weeks before the interview to 0.678 for the year before. Regression slopes of self reported utilisation upon recorded utilisation did not change between periods. In multiple regression analyses the actual number of visits was the main factor associated with both underreporting and overreporting. Older age was also significantly associated with underreporting. Poor health status and high satisfaction with health care were significantly associated with overreporting.
CONCLUSIONS There was a substantial degree of inaccuracy in self reported utilisation, with a net tendency to overreport the number of visits. In relative terms, however, accuracy of self reports did not seem to decrease appreciably as the recall time lengthened. To compare the accuracy of different measures, it is important to take into account the maximum variability of each one. Otherwise, contradictory results may be obtained.
- self reported utilisation
- primary health care
- validity
Statistics from Altmetric.com
The utilisation of health services has been studied from different angles during recent decades,1-10 and usage patterns have been widely used to plan health care services.11-15 Utilisation of primary health care services can be measured from records, health diaries, and questionnaires,16-21 but questionnaires are the most frequently used source of data.22-30 However, few studies have focused on the accuracy of self reported utilisation, and the factors that influence it. Both issues are central to the soundness of methods used to analyse the utilisation of primary health care services.30 31 Therefore a number of questions need to be answered to establish the validity of self reported utilisation data. How accurate is self reported utilisation? Does accuracy of the information decrease as the recall interval increases? If the answer to this latter question is yes, when does the information cease to be valid? And finally, what variables influence the validity of self reported utilisation data?
Methods
This cross sectional study was originally designed to identify factors related to high usage of medical services in primary health care. A detailed description of the method has been published in a previous article.32
SETTING
The research was done at the Centro de Salud Zaidín-Sur in Granada (a city of 300 000 inhabitants in south eastern Spain), which serves a population of approximately 24 000 inhabitants living in a defined area within the city limits. As part of the national health service, the centre provides free medical care to 100% of the population in the catchment area. More information about the Spanish national health system is available in Hart's 1990 article.33
POPULATION AND SAMPLES
The eligible population consisted of all subjects aged 14 years or older who were seen at the health centre between 1 August 1985 and 1 March 1991. Five of the 10 family physicians of the centre participated. From their patient lists we selected a random sample of 2018 people, for whom we recorded use during the period from 1 March 1991 to 29 February 1992 from the centre's patient records. High use (HU) was defined as a number of visits to the health centre greater than the mean plus one standard deviation for the age and sex group. The HU group contained 285 subjects (14% of the sample). The remaining 1733 subjects were considered normal users (NU).
All high users and a random sample of 511 NU were asked to respond to a specially designed questionnaire. Forty nine patients in the HU group and 91 in the NU group could not be interviewed. Therefore the final sample consisted of 236 HU and 420 NU. There were no significant differences in age or sex distribution between patients who were unavailable for interview and those who were interviewed.
MEASUREMENTS
All variables except recorded utilisation were obtained in the course of individual interviews with the patient in their home. The interview conditions were standardised, and all interviews were held between 1 January 1993 and 30 June 1993. The following information was obtained:
-
Number of scheduled visits during the 2 weeks, 3 months, 6 months and 12 months before the interview.
-
General variables: age, sex, marital status, educational level and employment status according to the classification of the Spanish Instituto Nacional de Estadística34; socioeconomic level according to an adaptation of the Clasificación Nacional de Ocupaciones to social class35; number of persons per household.
-
Health status: self reported health and number and type of reported chronic illnesses according to the pertinent items in the Encuesta Nacional de Salud36; mental health, measured using Goldberg's GHQ-28 questionnaire.37 38
-
Family function, measured with the family APGAR index.39-41
Information about scheduled recorded utilisation during the same periods for which the patients were questioned in the interview was obtained from the list of patients who had a scheduled appointment at the health centre.
DATA ANALYSIS
Descriptive statistics of self reported utilisation (SU), recorded utilisation (RU), and the difference between them (DSR = SU−RU) were estimated for each time interval. The logarithm of the SU/RU ratio was also calculated (replacing 0 values with 0.001) to obtain estimates of relative discordances weighted by the actual number of visits. The Wilcoxon rank test was used to find significant differences between SU and RU distributions. The correlation between the two measures was studied by estimating Spearman's ρ coefficient. Because maximum variability differed for each interval we calculated corrected coefficients (ρc) for maximum possible variability in each interval with the equation: ρc = ρ/ρmax, where ρmax was obtained according to the expression proposed by Shih and Huang.44 Simple linear regression of SU upon RU was done for each time interval, and DSR was plotted against RU for each period.
To identify factors related with validity, we constructed two multiple linear regression models for each time interval: one for overreporting and one for underreporting. In the first case, the dependent variable was DSR, ranging from 0 to its maximum value. In the second one we used absolute values of DSR, ranging from the minimum value to 0.
Finally, DSR values were grouped into three categories: underreporters (values lower than the mean minus one standard deviation (1SD)), accurate reporters (values within the mean (±1SD)) and overreporters (values greater than the mean +1SD). Nominal polychotomous logistic regression analysis was then done for each subperiod, using the category of accurate reporters as the reference. Two adjusted odds ratios (OR) were obtained for each independent variable to measure the strength of its association with overreporting and underreporting separately. The SPSS (version 6.0)45 and the BMDP (version 7.0)46 statistical packages were used for all analyses.
Results
key points
-
Self reported utilisation has a considerable degree of inaccuracy, with a net tendency to overestimate the actual number of visits. It seems advisable to assess the validity of studies based on this measure of utilisation carefully.
-
Validity expressed in relative terms does not seem to decrease appreciably as the recall period lengthens. It therefore seems advisable to use a recall period of at least one year to compensate for biases present in user responses for short recall periods.
-
Because estimates that do not take into account the maximum variability of each variable can yield contradictory results, they should not be used to compare the accuracy of different measures.
-
The number of recorded visits is the variable that most strongly influences the validity of self reported use: the greater the use (number of visits), the greater the tendency to underreport and, to a lesser degree, to overreport the number of visits. Other variables that influence the validity of self reported number of visits are older age (associated with underreporting) and poor perceived health (associated with overreporting).
CHARACTERISTICS OF THE SAMPLE AND NON-RESPONDENTS
Information about the number of recorded visits was not available for two subjects. Sixty five subjects (9.6%) did not answer the question about the previous number of visits for at least one of the recall periods considered. The proportion of non-responders increased as the recall period became longer: eight subjects (1.2%) for the past two weeks; 14 (2.1%) for the past three months; 38 (5.8%) for the past six months, and 63 (9.6%) for the past year. We present the results only for the 589 subjects for whom information about recorded and self reported visits was available for all periods.
Differences between responders and non-responders according to the main variables studied are presented in table 1. Non-responders were generally older than responders, and included a larger proportion of persons with a lower level of education, divorced or separated persons, widows and widowers, women who did not work outside the home, and retired persons. Their perceived health was worse, the number of reported illnesses higher, and their GHQ score significantly higher than in responders. Non-responders were more frequently high users; accordingly, the mean number of recorded visits in the previous year was significantly higher than for responders.
Distribution of the sample according to the main variables for respondents and non-respondents
VALIDITY ASSESSMENT
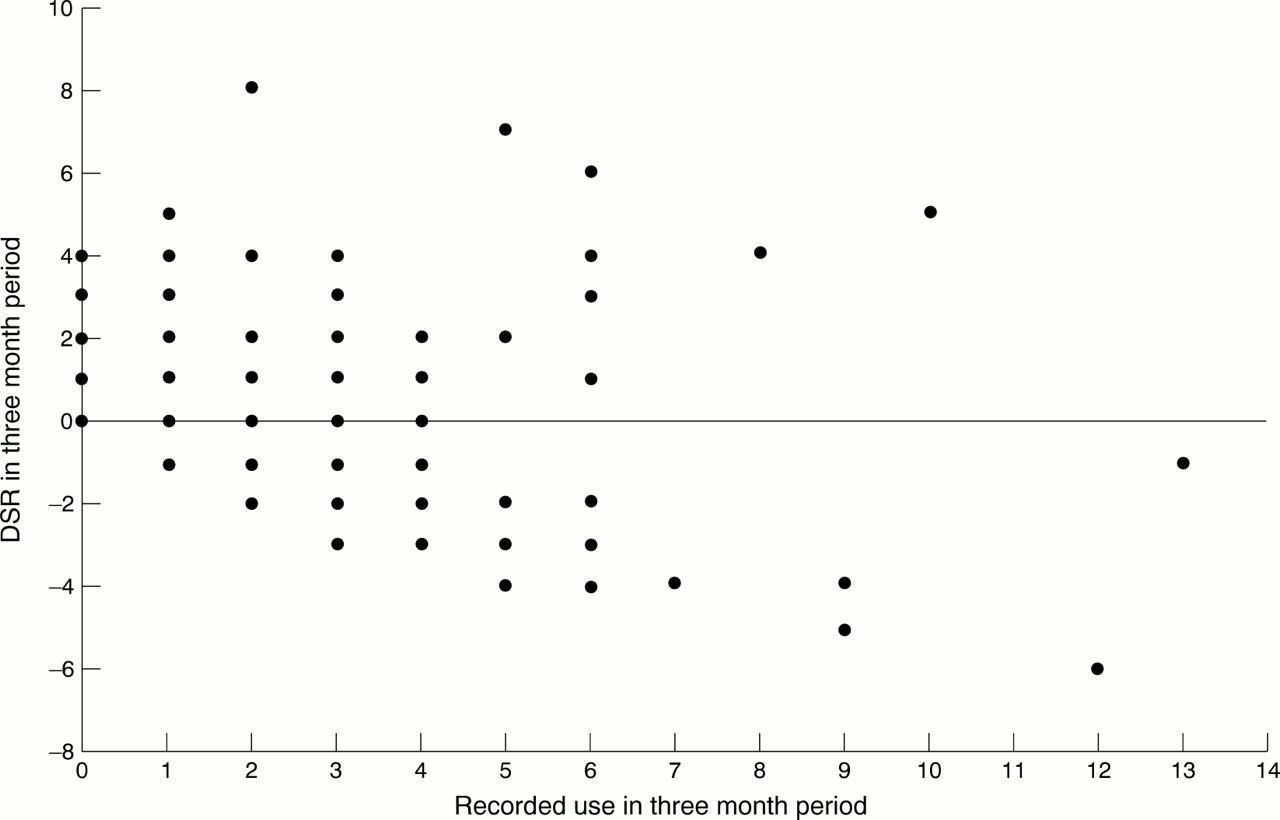
Table 2 shows descriptive statistics for SU and RU. Means, medians, standard deviations and maximum values of both SU and RU increased as the recall period lengthened. Mean values and standard deviations of SU were always higher than the corresponding RU values. Table 3 shows descriptive statistics for DSR. All mean values were positive numbers. Standard deviations and ranges both increased as the recall interval lengthened. Accordingly, the proportions of overreporters and underreporters also increased with length of the recall period, but the former were always higher. Table 3 also shows descriptive statistics for the logarithm of SU/RU. The proportion of accurate reporters (considered as those values between −1 and +1) did not differ between periods. Table 4 shows the measures of association between SU and RU. Significant differences between SU and RU distributions were observed for all time intervals except 12 months. The differences in the values of uncorrected Spearman correlation coefficients for each period (from 0.489 in the two week interval to 0.672 in the one year interval) were much lower when corrected coefficients were used (from 0.602 to 0.678 in the two week and one year periods respectively). The value of the intercept of the regression of SU upon RU increased as recall period lengthened, but the slopes did not change significantly across periods. Figures 1 to 4 show the plots of DSR against RU for each recall period. The plots for the three month, six month and one year periods were quite similar, and they showed that the magnitudes of both positive and negative DSR values increased with the recorded number of visits.
Descriptive statistics of self reported and recorded utilisation in the four periods
Comparison of the difference between self reported and recorded utilisation (DSR) and the logarithm of the ratio between self reported and recorded utilisation (ln SU/RU) in the four recall periods
Measures of association between self reported (SU) and recorded utilisation (RU)
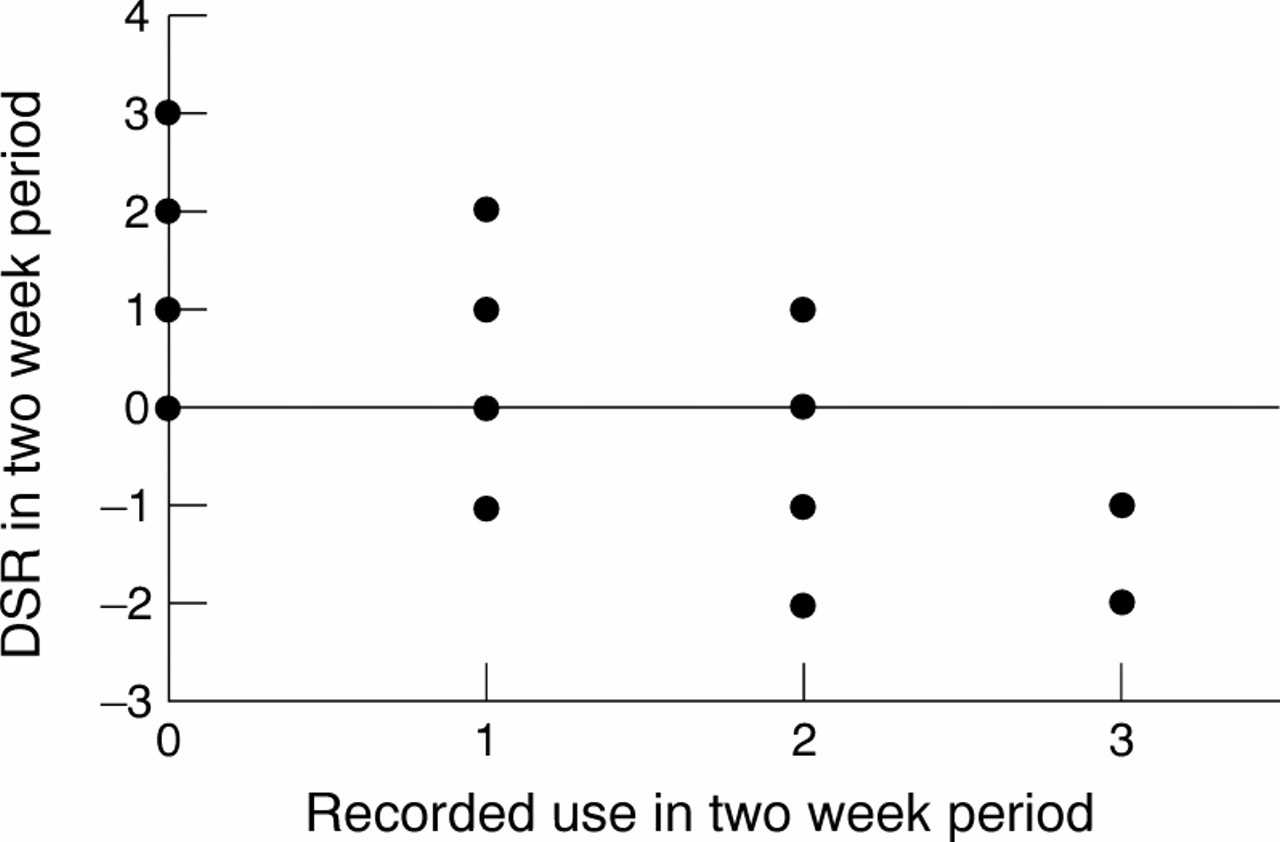
Plot of DSR against recorded use in two week recall period. DSR: difference between self reported and recorded use.

Plot of DSR against recorded use in three month recall period. DSR: difference between self reported and recorded use.

Plot of DSR against recorded use in six month recall period. DSR: difference between self reported and recorded use.

Plot of DSR against recorded use in one year recall period. DSR: difference between self reported and recorded use.
VARIABLES ASSOCIATED WITH ACCURACY
Table 5a shows the results of multiple linear regression analyses for the subsample of accurate or underreporting subjects (DSR ⩽ 0). The number of recorded visits was directly associated with underreporting in all recall periods. The magnitude of the coefficients increased as recall period lengthened. Older age was associated with underreporting in the one year period. The number of chronic illnessess and no schooling showed a significant inverse association with underreporting in the three month and six month periods. In the model for overreporting (DSR ⩾ 0) (Table 5b), the number of recorded visits was directly and significantly associated with overreporting for all but the first period. The number of chronic illnessess was also associated with overreporting in two week and six month periods. Finally, a strong direct association between visits to faith healers and overreporting was seen in the three and six month periods. In the same time intervals, the opposite effect appeared for visits to alternative medicine practitioners.
Multiple linear regression analysis
In the polychotomous regression model (table 6), the variable most strongly associated with underreporting was the number of recorded visits, followed by older age. The number of recorded visits was also associated with overreporting, although the magnitude of the association was smaller than for underreporting. Overreporting was also associated with worse subjective perception of health, a greater number of chronic illnesses, visits to faith healers, satisfaction with the health care system, and retirement.
Variables associated with reliability (DSR). Polychotomous regression analysis
Discussion
OVERALL ASSESSMENT OF VALIDITY
Our results seem to indicate that the accuracy of information provided in user surveys of the number of visits is relatively low. Other authors have found low validity for self reported utilisation in comparison with recorded utilisation. Roberts et al 30 obtained a Spearman correlation coefficient of 0.58, a value similar to ours and much higher than the 0.37 reported by Reynoso et al.47 Glandon et al 48 also reported relatively low validity in a study that used a six month recall period before interview. The proportion of concordant results they found (28.2%) was very close to the 29.9% obtained in this study.
In comparison with some earlier findings,30 48overreporting of the number of visits was more frequent in our sample. None the less, underreporting by our subjects seemed to be linked to the longer duration of the recall period, as found by Robertset al.30 One possible explanation for the excess number of recalled visits is that although the participants were instructed not to count unscheduled visits, they did not distinguish between visits that were being investigated and unplanned visits.
CHANGE IN ACCURACY WITH INCREASING RECALL PERIOD
Accuracy, expressed in absolute terms as a proportion of concordant results or as the reciprocal of the standard deviation of the DSR, clearly decreased as the recall period lengthened. However, neither of these measures is entirely suitable to compare accuracy across periods, as they do not take the differences in maximum variability between periods into account. The longer the period, the greater the total number of visits, and hence the greater margin of potential variability between the number of recorded visits and the number of recalled visits. Moreover, the increase in maximum variability as recall period lengthened probably accounts for the higher uncorrected correlation coefficients obtained for increasing recall periods. However, our analysis suggests that in relative terms (when different maximum variabilities in each period are taken into account), the validity of self reported utilisation does not decrease with time, at least for periods shorter than one year. All periods yielded similar corrected Spearman correlation coefficients, and there were no significant differences in the slopes of the regression of SU upon RU. Moreover, the one year period was the only one for which the Wilcoxon rank test did not detect a significant difference between SU and RU distributions. Finally, when the distribution of the logarithm of SU/RU was compared between periods, the proportion of accurate responses was practically equal in all of them.
FACTORS ASSOCIATED WITH VALIDITY
The number of recorded visits was strongly associated with validity of the number of visits recalled: the more visits, the greater the bias toward both underreporting and overreporting, although the magnitude of the former association was clearly higher. This finding suggests, in agreement with other studies,30 31 48 that the more recorded visits, the greater the likelihood that some visits will be forgotten. The association between increasing age and greater frequency of underreporting was expected, in view of the greater likelihood that older subjects would be more forgetful. Other studies also found this association,30 31 48 although the relation between the magnitude of underreporting and duration of the recall period was not investigated.
In our study the main factors directly associated with overreporting (poor health status, retirement, or high level of satisfaction with health care), or inversely associated with underreporting (low educational level), are those usually described as related with a higher use of primary health care services.36 49-51Although we included in the multiple regression models the actual number of visits (RU) and HU compared with NU status, the confounding effect of these variables might not have been completely removed. However, the opposite could also be true: as in the study by Cleary and Jette,31 our findings indirectly suggest that inaccuracy of self recorded utilisation by some subjects may distort the analysis of other factors related with utilisation. The association of poor health status with overreporting was also found by Cleary and Jette31 and by Glandon et al 48 in a study of elderly users. The tendency of persons who visit healers to overestimate the number of visits may be partially explained by confusion regarding the type of visit for which information was solicited.
METHODOLOGICAL CONSIDERATIONS
To control for potential confusion introduced by the orginal stratification of the sample in high and normal users, all results of the regression analyses were adjusted to take the level of use into account.
In comparison with responders, most of the subjects who did not respond to the item about the number of visits made shared characteristics generally associated with lower accuracy: older age, worse perceived general health, and greater number of recorded visits. This means that if we had been able to obtain information for the entire sample, the validity of self reported visits may have been even lower. We found no published studies that examined this source of bias in the estimation of the validity of self reported utilisation.
It should be noted that our validity analysis was limited to scheduled visits. This approach may differ from that used in studies of other types of contact with different health care facilities. For example, Roberts et al 30 found a high validity for self reported days spent in the hospital, even for recall periods as long as one year.
Acknowledgments
We thank Karen Shashok for translating substantial parts of the original manuscript into English.
References
Footnotes
-
Funding: none.
-
Conflicts of interest: none.