Article Text

Abstract
Background Prevalence of intellectual disabilities varies considerably between studies. People with intellectual disabilities experience health inequalities, but most studies comprise small or incomplete populations. We investigated in a whole country population the (1) prevalence of intellectual disabilities and (2) general health status compared with the general population.
Method Data were from Scotland’s Census, 2011. We calculated the prevalence of intellectual disabilities, reported general health status of people with and without intellectual disabilities and the extent of health-related limitations to daily activities. We conducted logistic regressions to determine the ORs of intellectual disabilities predicting poor health and associations with age and gender.
Results Of Scotland’s 5 295 403 population, 26 349 (0.5%) had intellectual disabilities; 15 149 (57.5%) were males and 11 200 (42.5%) were females; 5234 (0.6%) were children/youth (0–15) and 21 115 (0.5%) were adults (16–75+ years). Identification of intellectual disabilities rises until age 5 years, with a further small rise by age 9 years. Children and adults with intellectual disabilities reported more poor health (47.9% and 40.3%) than the general population (2.1% and 13.8%) and were more limited in activities by their health. Intellectual disabilities had an OR of 43.2 (95% CI 40.8 to 45.7) in predicting poor health; the influence of increasing age on poor health was markedly interacted by presence of intellectual disabilities, likely to be due to a ‘healthy survivor’ effect within the intellectual disabilities population.
Conclusion People with intellectual disabilities have poorer general health than other people, especially children and young people. Accurate information on population prevalence and health status is essential to plan appropriate resources.
- health inequalities
- health status
- Intellectual disabilities
Statistics from Altmetric.com
Introduction
Intellectual disabilities refer to impairments in intellectual functioning (an IQ <70), together with deficits in adaptive functioning (need for support for daily personal independence and social functioning), with onset during the developmental period.1 Intellectual disabilities may be identified at birth or during pregnancy, for example, Down syndrome, whereas other children may not be identified as having intellectual disabilities until they are schooled. A recent systematic review of prevalence studies reported an adult rate of intellectual disabilities of 4.94/1000, an adult and child/youth combined rate of 5.04/1000 and a rate for national studies (given the much higher rates found in rural and urban slum/mixed rural urban populations) of 6.23/1000 with these national studies skewed towards child/youth populations.2 The review was not able to report rates for specific age groups due to the information provided in the synthesised studies. Additionally, the included studies were highly variable in methodology, size and quality; and geography and time (cohort effects) can affect prevalence of intellectual disabilities.3 Hence, whole population studies on prevalence of intellectual disabilities are indicated.
Compared with the general population, people with intellectual disabilities have been reported to experience health inequalities,4–7 poor access to healthcare8–10 and premature mortality with over-representation of deaths that could have been amenable to healthcare.11 12 Ratings of general health have been found to be associated with morbidity and mortality in the general population.13–16 However, little is known about the reported general health of people with intellectual disabilities across the lifespan compared with the general population.9
We identified only three papers that investigated self/proxy-reported general health among adults with intellectual disabilities compared with the general population.9 17 18 Two UK studies revealed adults with intellectual disabilities were more likely to rate their health as ‘fair, bad or very bad’ (50.6%) than the general population (10.4%),17 or as ‘poor’ compared with the general population (13% vs 3%).9 They reported on adults aged 16–49 years only, living in private households only and included few adults with intellectual disabilities: 316 and 415 (two household surveys in England)9 and 299 (a household survey in England).17 Few if any people with severe intellectual disabilities are likely to be included in view of the small sample sizes. They did not include questions on intellectual disabilities; instead, deriving assumed intellectual disabilities based on self-reported difficulties in learning or understanding9 or by cognitive test at age 18+ years, plus no educational qualifications reported during schooling.17 The third survey recruited participants via mail from an administrative database of adults aged 18+ years who had used disability services in Victoria, Australia. Replies were received for 897 (14%), of whom proxy responses on general health status were received via telephone for 90.7%. They rated 24.5% to have poor or fair health, which compares with 18.3% of the general population found in a separate study of telephone interviews of Victorian adults living in private households, not standardised by age.18 All three studies reported poorer health status in the adults with intellectual disabilities but had different methods, variation in results and differences in the scales used for investigating general health.
With regards to children/young people, two studies have reported general health in comparison with the general population. Secondary analysis of a 1999 UK household survey of individuals aged 5–15 years, included 264 who met an operationalised definition of intellectual disabilities (based on parent and teacher reports). Parents reported their child’s general health to be very good, good, fair, bad or very bad. ‘Intellectual disabilities’ was found to have an OR of 4.22 related to having fair to very bad health, adjusted for age and gender.19 A further 2002 UK private household survey of children/young people aged ≤16 years, or 17/18 years and in education, also created an operationalised definition of intellectual disabilities that identified 593 (4.7%) of the children/youths to have intellectual disabilities. The OR of having parental-reported fairly/not good health (vs good health) was 2.4 for intellectual disabilities, adjusted for age and gender.20 In view of the original designs of these studies, only children/youth living in private households were included, and the results are likely to be predominately limited to children/youth with mild intellectual disabilities.
The aims of this study were to investigate (1) the prevalence of intellectual disabilities by age and gender and (2) the reported general health status of children, young people and adults with intellectual disabilities compared with the general population and associations with age and gender.
Methods
Data source
The data source was Scotland’s Census, 2011. This provides statistical information on the number and characteristics of Scotland’s population and households at the census day, 27 March 2011. The census is undertaken every 10 years. It includes people living in communal establishments (such as care homes and student halls of residence) as well as people living in private households. In 2011, the census in Scotland was estimated to have achieved a 94% response rate, which is close to the highest ever historic compliance rate. A coverage assessment and adjustment process was used to take account of non-response in the final census outputs. Scotland’s Census is probably one of few country censuses that identifies people with intellectual disabilities and distinguishes these from specific learning disabilities such as dyslexia; indeed, it may be unique in this regard. Full details of the methodology and other background information on Scotland’s Census, 2011 are available at: http://www.scotlandscensus.gov.uk/supporting-information.
The Census requires the form to be completed by the head of household or joint head of household on behalf of all occupants in private households, and the manager is responsible on behalf of all occupants in communal dwellings. It is a legal requirement to complete the census, and the census form clearly states this, and that a head of household not completing it or supplying false information can be fined £1000. The Census team follow up non-responders and also provide help to respond when that is needed, hence the high 94% completion rate.
Census variables
Intellectual disabilities
People with intellectual disabilities were identified by self/proxy reporting as having intellectual disabilities from the individual questions section; question 20: ‘Do you have any of the following conditions which have lasted, or are expected to last, at least 12 months? Tick all that apply’. There was a choice of 10 response options: (1) deafness or partial hearing loss, (2) blindness or partial sight loss, (3) learning disability (eg, Down’s syndrome), (4) learning difficulty (eg, dyslexia), (5) developmental disorder (eg, autistic spectrum disorder or Asperger’s syndrome), (6) physical disability, (7) mental health condition, (8) long-term illness, disease or condition, (9) other condition and (10) no condition. There was an additional option for reporting any ‘other condition’, in which a prompt was included for the respondent to report the type of ‘other’ condition. Under ‘other’, if a person indicated that they had one of the conditions previously specified, this was recoded so that this person was counted as if they had responded to the relevant option of the question. For example, if a person indicated they were blind under ‘other’, this would be recoded under option 2 of this question.
As this study is focused on people with intellectual disabilities, it only included people with a positive response to ‘learning disability (eg, Down syndrome)’. In Scotland, the term ‘learning disability’ is synonymous with the internationally recognised term ‘intellectual disabilities’. Importantly, the Census question distinguishes between intellectual disabilities, specific learning disabilities (eg, dyslexia) and autism, and provided examples beside each of these options to clarify the differences between each for respondents.
General health
General health status was collected by a single question with a five-point response scale: ‘How is your health in general’; (1) very good, (2) good, (3) fair, (4) bad, (5) very bad?.
Daily limitations by long-term illness
Limitations to daily activities due to health problems was collected by a single question with a three-point response scale: ‘Are your day to day activities limited because of a health problem or disability which has lasted or is expected to last, at least 12 months?’ (including problems related to old age): (1) no, (2) yes, limited a little and (3) yes, limited a lot.
Procedures
Following Scottish Government approval, data from Scotland’s Census 2011 were analysed under the auspices of a collaborative research project with National Records of Scotland at its premises in Ladywell House, Edinburgh. All resulting raw frequency tables of census data were checked to ensure they did not breach statistical disclosure control thresholds and were published on the Scotland’s Census website, available under the Health topic at: http://www.scotlandscensus.gov.uk/ods-web/data-warehouse.html#additionaltab
Data analysis
We calculated the number and percentage of people with intellectual disabilities, by age, gender, living arrangements, ethnicity and country of birth. We calculated the number and percentage of people with and without intellectual disabilities reporting very good, good, fair, bad and very bad health and the extent of health-related limitation to daily activities. We compared differences using χ2 tests. With the whole population, we then used binary logistic regression to calculate ORs (95% CIs) for intellectual disabilities, adjusted for age and gender, in predicting a derived, dichotomised variable of poor health (fair, bad or very bad health) versus good health (very good or good health), with good health as the reference group. Age was categorised into groups: 0–15 (reference group), 16–24, 25–34, 35–44, 45–54, 55–64, 65–74 and 75+ years. The reference group for gender was male. We then conducted a second regression, adding the interaction term age × intellectual disabilities to the above regression. All analyses were conducted with SPSS software V.22.
Results
Number of people with intellectual disabilities by age and gender
Scotland’s Census, 2011, includes records on 5 295 403 people aged 0–75+ years. A total of 26 349 (0.5%) people with intellectual disabilities were identified, including 15 149 (57.5%) males and 11 200 (42.5%) females, and 5234 (0.6%) children (0–15 years) and 21 115 (0.5%) adults (16–75+ years). Table 1 provides more information about the characteristics of people with intellectual disabilities and the general population/people without intellectual disabilities. The population with intellectual disabilities has a higher proportion of males (χ2=851.96; df=1; p<0.001) and is younger (χ2=1473.45; df=7; p<0.001) than the general population. People with intellectual disabilities were less likely to live in private households than the general population (χ2=16769.50; df=1; p<0.001). The country of birth data suggests lesser international mobility (χ2=701.38; df=5; p<0.001) for the people with intellectual disabilities. The data suggest less ethnic diversity (χ2=2025.63; df=5; p<0.001) for the people with intellectual disabilities.
Participant characteristics
Table 2 shows the reported prevalence of intellectual disabilities by age groups for the children/young people and adults with intellectual disabilities. Figure 1 presents these data for the children/young people. This shows that identification of intellectual disabilities increases to a prevalence of 0.6% by age 5 years and 0.7% by age 9 years. For boys, the prevalence suggests most are identified by age 5 (0.8%) years, increasing further between ages 10 and 13 years to 1%. For girls, the prevalence suggests most are identified by age 7 (0.5%) years, with further increase up to age 11 (0.6%) years. There is a gradual decline in adult prevalence with increasing age, from 0.7% at 16–24 years to 0.2% at 75+ years.
Prevalence of intellectual disabilities by age group

Prevalence of intellectual disabilities by year age groups for children and young people.
General health
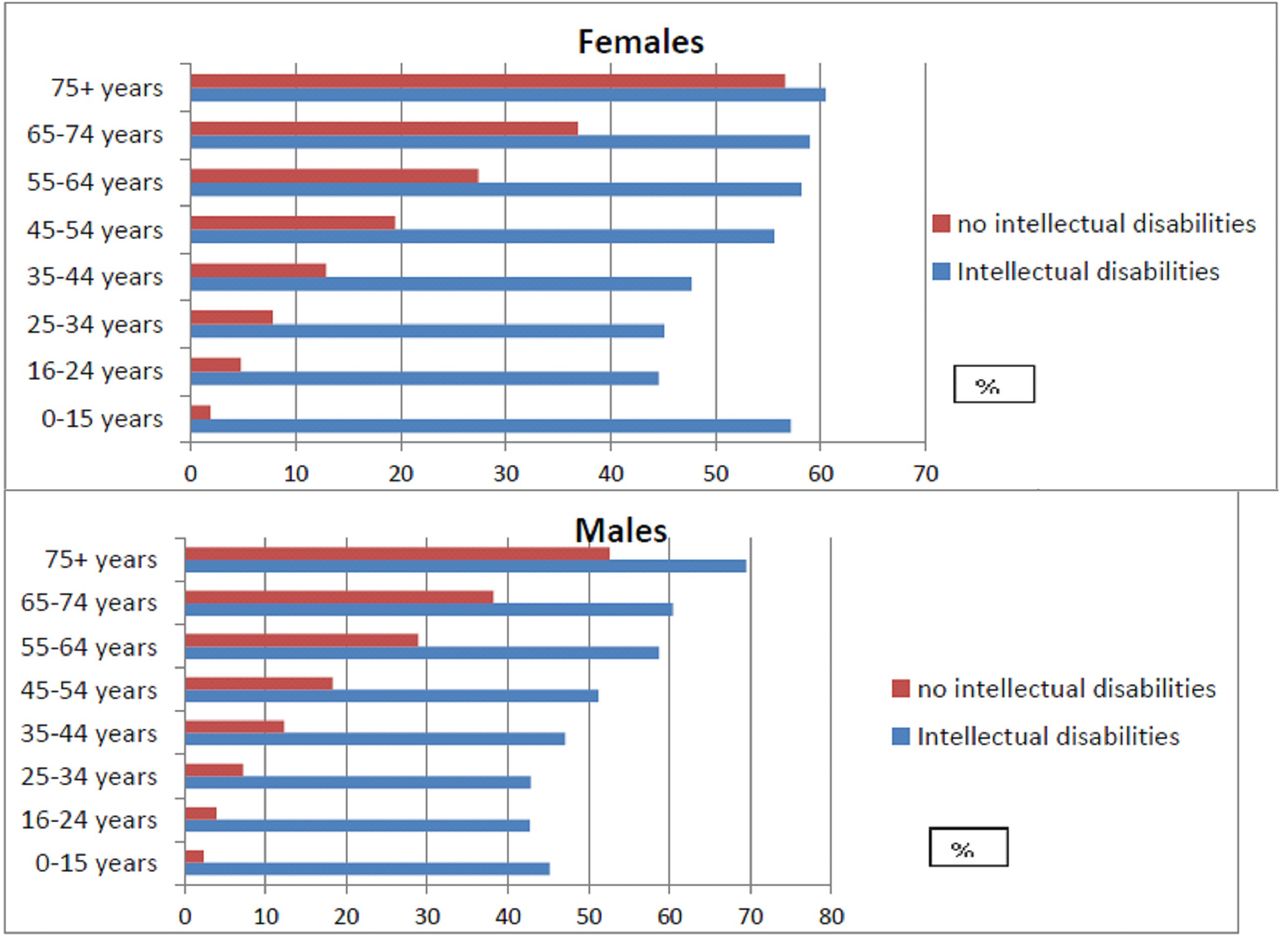
Table 3 and figure 2 show the reported general health status of people in Scotland with intellectual disabilities compared with the general population. This shows poorer health was reported more by children and young people (χ2=57 922.5; df=4; p<0.001), adults (χ2=20 817.7; df=4; p<0.001) and older adults (χ2=302.1; df=4; p<0.001) with intellectual disabilities. The differences between the health of people with and without intellectual disabilities are most marked for children and young people.
Reported general health status of people with intellectual disabilities (ID) compared with people without ID

‘Poor’ general health by gender and age group.
Adjusting for age and gender, given the different distributions in the two populations, intellectual disabilities had an OR of 9.16 (95% CI 8.91 to 9.42) in predicting poor health (table 4). In the whole population, adults at all ages rather than children were more likely to have poor health and progressively so at each older age group. When the interaction term is added (age × intellectual disabilities), it can be seen that intellectual disabilities is shown to have considerably more marked association with the outcome of poor health (OR=43.17; 95% CI 40.81 to 45.66) and more so at older age groups. Females had poorer health than males.
Independent predictors of poor health in the whole population
Limitations of long-term health conditions
Table 3 also shows how long-term health conditions impacted on the daily lives of individuals. People with intellectual disabilities were significantly more likely to report their daily activities were limited due to health problems than people without intellectual disabilities who had health condition/s. This was the case for children and young people (χ2=141805.8; df=2; p<0.001), adults (χ2=96021.5; df=2; p<0.001) and older adults (χ2=1730.0; df=2; p<0.001) with intellectual disabilities. Only 12.5% of people with intellectual disabilities reported no limitations to their daily activities due to long-term health problems, compared with 80.7% of people without intellectual disabilities.
Discussion
Principle findings and interpretation
Our study is novel in measuring reported general health of people with intellectual disabilities of all ages, in a large, total population study, complete with general population comparisons. Intellectual disabilities substantially influences health, 43 times so. The study is also novel for reporting age at identification of intellectual disabilities in a whole country study.
We found the prevalence of intellectual disabilities to be 0.5% on average across all ages, with a peak in children and young people at 0.7%/0.8% and 0.5% in adults. This lower rate for adults may reflect a combination of acquisition of life skills over time and premature deaths. The prevalence of intellectual disabilities in childhood provides a marker of age of identification of intellectual disabilities in childhood. During childhood, prevalence suggests most children are identified to have intellectual disabilities by the age of 5 years, and a small minority up to age 9 years, that is, during primary school education, with prevalence remaining at 0.7% between ages 9–24 years, apart from being 0.8% at age 13 years.
Reported general health was substantially poorer for people with intellectual disabilities compared with the general population and particularly so for children and young people. People with intellectual disabilities were 43 times more likely to have poor health, when the interaction between age and intellectual disabilities was taken account of. People with intellectual disabilities reported more limitations in their daily activities due to long-term health problems compared with people with no intellectual disabilities. Females had poorer health than males for both the people with intellectual disabilities and the general population, slightly more so for the people with intellectual disabilities.
The inequality with the general population is greatest in younger age groups, probably reflecting the longer survival of people with milder intellectual disabilities and less complex health needs. The interaction between age and intellectual disabilities is greatest at older age in view of this; that is, the effect of age in the whole cohort in statistically predicting poor health is even greater when the interaction of intellectual disabilities with age is also taken into account. Indeed, within the intellectual disabilities population, the 16–24 year-old group had better health than those aged 0–15 years, as did, to a lesser extent, the individuals aged 25–34 years. At age 35–44 years, there was no difference in reported health status in the population with intellectual disabilities compared with the individuals aged 0–15 years; thereafter, health was progressively poorer for each subsequent older age group. This suggests that some children with the most complex health needs do not reach adult ages, and it is not until after the age of 45 years that the health-related effects of ageing outweigh the health-related effects of the most severe intellectual disabilities within the population with intellectual disabilities. This is not to say that older adults with intellectual disabilities do not have substantial health problems; they do; poor health is a feature across the full lifecourse of people with intellectual disabilities, with greater problems related to intellectual disabilities in the population at younger ages and more age-related problems in the population at older ages. This pattern is, of course, different to that seen in the whole population, where at all ages, poorer health is associated with older age group.
Many reasons are likely to account for the health inequalities we report in this study, and these may differ for people living with their families and people living with paid carer support. While some of these disadvantages are constitutional, importantly, some are likely to be potentially modifiable. Within the whole population, there is a gradient across intelligence level in terms of lifespan and morbidity,21 22 and hence it is not surprising this is seen at the most extreme end (ie, people with intellectual disabilities). Societal, community and educational approaches impact on this, and are complex. Other relatively simple approaches have been shown to bring health benefits for adults with intellectual disabilities such as annual health checks conducted in primary care23 24 (not currently funded in Scotland), with mechanisms likely to relate to the poor access to healthcare and services that are typically reported for people with intellectual disabilities.25 It is important that future research focuses on further identification of solutions to the health inequalities we have evidenced.
Comparison with existing literature
The prevalence of intellectual disabilities was similar to that reported in a previous systematic review, though in the review there was wide variations between studies.2 The review reported an adult prevalence rate of 4.94/1000 and 5.04/1000 from studies of adults and children/youth combined. Most of the studies in the review did not include the early years of life, and as our study shows, prevalence increases fourfold from the early years to youth, plateauing at 0.7%/0.8%. Sources on receipt of support for learning due to intellectual disabilities from pupil/school censuses report a higher proportion in childhood/youth, for example, at individuals aged 7–15 years in the UK26 and in Australia.27 In childhood in developed countries, there is an advantage to the label of intellectual disabilities in view of the additional resources that come with it for support for learning at school. Very minor flexibility around an IQ cut-off of 70 has considerable impact on the proportion of children included; for example assuming that IQ approximates to a normal distribution, then given the slope of the normal distribution, the proportion of school-age children with an IQ of 70–75 would be greater than the proportion with an IQ <70. It is to the advantage of children around this cut-off point to be included. Indeed, the considerable impact of minor variation in the interpretation/use of terminology in education is clearly seen from changes in reporting in England. According to the School Census conducted in England each year, in 2014, 2.1% of children and young people attending state school had ‘learning disabilities’. The collection of information changed in 2015 resulting in a higher figure of 3.6% of children and young people with ‘learning disabilities’.28 29 This is a clear example of interpretation of data requiring an understanding of the purpose for which it was initially collected and definitions used. We consider it a strength of our study that information was systematically sought on intellectual disabilities for each person in Scotland, with there being no individual benefit or loss for any persons.
There is limited previous research on the self/proxy-rated health of people with intellectual disabilities across the life span. While all three previous adult studies and both childhood studies reported poorer health in the people with intellectual disabilities compared with the general population, few if any people with severe/profound intellectual disabilities were included in four of these, and the one that did include them drew from an administrative sample with a particularly poor response rate. Hence, absolute comparisons of ours with these studies in the differences found with the general population may not be valid.
Strengths and limitations
This Scottish total country study is the largest we have identified investigating prevalence of intellectual disabilities and reported general health of people with intellectual disabilities compared with people in the general population across the lifespan; indeed it may be unique in doing so. The Census has an extremely high completion rate and contained a very clear question to identify whom had intellectual disabilities. We have no reason to believe the results are not generalisable to other high-income countries.
Limitations include lack of information on whether the responses were completed by proxies or the person with intellectual disabilities. We consider it unlikely, given the style and questions on the Census, that people with intellectual disabilities would have been able to complete the form without help, and hence the great majority were likely to have been proxy-reports. Regarding proxy-reporting for presence of intellectual disabilities, limitations have been reported with young children (eg, age 3 years),30 and this is apparent in Scotland’s Census data as ascertainment increases up to age 9 years. Indeed, the prevalence of intellectual disabilities in childhood provides a marker of age of identification of intellectual disabilities in childhood. Adults would, of course, have been diagnosed in childhood, so the same issue is not relevant. In childhood, most general health ratings will have been completed by parents. For adults, they will have been completed by parents or support workers, and we do not know if this has a bearing on reported health status. Proxy-ratings could differ from self-ratings with regard to health ratings, but importantly, without them, we would have no information on people unable to self-report due to severe/profound intellectual disabilities. A review found that numerous causes of general inaccuracies have been described in both self and proxy reports on general health, with the conclusion that overall, proxy reports are a useful addition to determine aspects of well-being in people with intellectual disabilities when the need arises.31 We note that proxy-reporting is the basis for much of the healthcare provided for people with intellectual disabilities who cannot self-report.
Implications
It is important to know the prevalence of intellectual disabilities for resource allocation and financial planning. The poor general health ratings of the people with intellectual disabilities demonstrates an urgent need to focus on improvements in healthcare and supports and the wider determinants of health in this population, which differ from the general population.
What is already known on this subject
A minority of intellectual disabilities are identified antenatally or in infancy, but few studies report on age of identification. People with intellectual disabilities experience health inequalities, but their general health status has been little studied. Three studies with adults and two with children/youth reported poor general health compared with the general population but were limited by their failure to include severe/profound intellectual disabilities (four studies) or low response rate (one study), in addition to small sample sizes, inclusion of private households only, methods of identifying intellectual disabilities and the restricted ages of adults included.
What this study adds
In a whole country population, we found 0.6% of children/young people and 0.5% of adults had intellectual disabilities, with prevalence of identified intellectual disabilities rising until age 5 years, with a further small rise by age 9 years (prevalence was four times greater in youth than in the early years). Intellectual disabilities has an odds of 43 in statistically predicting poor health, and the health difference with the general population is more marked for children/young people than adults. It is essential to know population size and its health burden in order to appropriately plan resources.
References
Footnotes
Contributors LAH-M contributed to the study design, the analysis and interpretation of data, drafted the first article and revised it critically; ER contributed to the study analysis and interpretation of data and revised the article critically; AH, CM, JR contributed to study design, interpretation of data and revised the article critically; S-AC conceived and designed the study, contributed to study analysis, interpretation of data and revised the article critically. All authors approved the final version.
Funding Scottish Government via the Scottish Learning Disabilities Observatory.
Competing interests None declared.
Ethics approval Approval was gained from the Public Benefit and Privacy Panel for Health and Social Care.
Provenance and peer review Not commissioned; externally peer reviewed.