Article Text

Abstract
Background Whether or not, and how, health inequalities change throughout older age is currently under debate. The goal of this study was to assess the net impact of education, occupational class, income and wealth on frailty trajectories among older adults in Continental Europe.
Methods We modelled frailty index trajectories within a repeated cohort design among the community-dwelling population (50+) in 10 countries, using growth curve models based on 54 036 observations from 20 965 respondents in 4 waves (2004–2013) of the Survey of Health, Ageing and Retirement in Europe.
Results Gaps in frailty due to education, occupational class and wealth continued throughout old age, while the gap due to income, smaller in comparison, converged. Frailty levels were higher and trajectories steeper in later birth cohorts, and the impact of education increased over time. Frailty levels and growth curves were higher in Southern European countries, and results were consistent across countries regarding the continuous effect of education and occupation and more mixed regarding wealth and income.
Conclusions Health inequalities due to education, occupational class and wealth tend to persist throughout old age, whereas the negligible effect of income declines with age, which, substantially, highlights the importance of social conditions on the pace of physiological decline in older Europeans and, methodologically, highlights the need to assess multiple measures of socioeconomic position.
- Epidemiology of ageing
- Health inequalities
- LONGITUDINAL STUDIES
- MULTILEVEL MODELLING
- Social and life-course epidemiology
Statistics from Altmetric.com
- Epidemiology of ageing
- Health inequalities
- LONGITUDINAL STUDIES
- MULTILEVEL MODELLING
- Social and life-course epidemiology
Introduction
Health inequalities due to socioeconomic position (SEP), that is, health gaps due to differences in educational, occupational and economic resources and constraints,1 have been documented for numerous countries and time periods, and have spurred efforts to improve health equity.2 Against the backdrop of an ageing population in Europe, SEP-based health differentials in old age are a key concern for targeted and equitable health and social care provision. Cross-sectional research repeatedly found that, although health inequalities exist among older adults3 and even the oldest old,4 they are smaller than those in middle-aged individuals, that is, that they diminish with age. Recent longitudinal research has called this into question and found rather diverse patterns, where the influence of specific measures of SEP on specific measures of health has been shown to converge, continue or even increase throughout early and later old age.5–15
Three competing explanations have been suggested in this regard: (1) Convergence has been associated with the age-as-leveller theory, which outlines health inequalities to converge after a peak in middle or early old age either due to higher mortality among low-SEP individuals, morbidity compression in high-SEP individuals being caught-up by universal biological frailty and/or compensating welfare state policies.7 (2) On the other hand, continuity of the SEP-gap in health over time has been linked to the status maintenance hypothesis, which argues that educational and occupational attainment in adolescence and middle age hardly change afterwards, and thus continue to affect health in later life.16 (3) Finally, divergence has been linked to accumulation theory,17 ,18 which argues that SES-based health inequalities increase with age, due to a progressive accumulation of disadvantages at the social, behavioural and biological level.
The conflicting empirical results regarding the dynamics of SEP-based health inequalities in recent research could be due to a number of issues: (1) The selection of indicators of health and SEP could affect the outcome, as studies have shown different measures of SEP and health to correlate only moderately with each other, that is, are not interchangeable.1 ,19–24 This is also supported by multiple dynamic patterns found within single studies, depending on the selected measure.8 ,9 ,11–15 (2) Widely used and valid single-item measures of self-reported health25 have been shown to predict diseases and mortality more accurately among higher educated26 and thus may not be strictly comparable across SEP groups. Similarly, problems with single measures of SEP might arise given that retired older adults often have a low level of formal education, thus leaving only little room for differentiation;3 ,22 that they are no longer employed and therefore potentially less influenced by former occupational characteristics27 and that their economic resources are comprised by pension income and life-long accumulated, financial and non-financial (eg, housing) assets.21 (3) Differing patterns could also be due to different substantial mechanisms being associated with different SEP indicators. Educational differences are thought to translate into health inequality due to differences in self-efficacy, health literacy and health-promoting behaviour.18 ,28 Physical demands and (lack of) perceived control at work are also thought to affect health (decline).19 ,28 Available material resources, finally, can protect people from detrimental financial stress,29 facilitate access to health treatments and health-generating resources such as good housing and leisure activities28 and make it easier for them to adapt to age-related and illness-related restrictions in residences (eg, stair lift) or with regard to care arrangements (eg, 24-hour home care).30 (4) Conflicting results may also be due to methodological issues, for example, to differences between studies in the treatment of sample attrition or effects of selective mortality, which have been reported to explain some of the convergence in earlier research.5 ,11 In addition, (5) reported cohort differences10 ,14 may confound ageing-related results, and (6) the widespread use of static rather than dynamic predictors of SEP could overstate gaps in health trajectories.5 ,31 Finally, (7) conflicting results may be due to a neglect of societal contexts, as longitudinal studies are often based on data from single countries, while cross-national evidence is largely absent: it would be more robust and allow one to identify overall effects for a number of countries and country-specific deviations.15
We referred to frailty as a comprehensive concept and measure of health status in old age. Frailty has emerged as a distinct concept in ageing research that refers to a state of increased vulnerability to negative effects of environmental stressors as a result of a cumulative decline in multiple physiological systems, and is associated with adverse outcomes such as hospitalisation, institutionalisation and mortality.32 Frailty as a non-specific measure of general system damage has been operationalised as the frailty index (FI) based on a large number of health deficits,33–34 shown to be a valid measure of physiological decline and successfully applied in recent studies in order to assess health inequality among older adults.10 ,12–13
We estimated trajectories of frailty as a multidimensional comprehensive measure of health among community-dwelling older adults in 10 European countries over the past decade (2004–2013), using cross-national panel survey data (Survey of Health, Ageing and Retirement in Europe (SHARE)) in order to assess net health inequalities associated with four measures of SEP (education, occupational class, income and wealth).
Methods
Data
The SHARE provides harmonised, representative cross-national panel data of individuals in residential households aged 50 years and over, and of their partners. SHARE currently features five waves, four of which provide panel data of 10 European countries (Austria, Belgium, Denmark, France, Germany, Italy, the Netherlands, Spain, Sweden and Switzerland) over a 10-year period (2004–2013). The target population of the first wave of SHARE was born in 1954 or earlier, and the overall response rate was 61.8%. Interviews for the first wave took place in 2004–2005, and subsequent panel interviews (retention rates=70–86%) were conducted in 2006–2007 (wave 2), 2010–2011 (wave 4) and 2013 (wave 5). Out of the 24 383 respondents in the first wave of SHARE, 20 965 (86.0%) provided valid information for the variables used. In total, these respondents provided 54 036 observations across four waves of SHARE (n2004/2005=20 965, n2006/2007=13 601, n2010/2011=10 207 and n2013=9263), which is an average of 2.6 observations per person. Of the initial respondents, 10.6% (2573) died within 10 years of follow-up after the first interview.
Variables
The outcome variable FI was computed in accordance with established procedures.35 We used 40 identical items available in all four waves of SHARE, including self-reported health, diagnosed illnesses, mobility, restrictions in basic and instrumental activities of daily living, sensory impairment, body mass index deficit and grip strength (see online supplementary file). All items showed <5% missing values, except for grip strength (9.0–10.6%), which was nonetheless included for its topical relevance. The FI (range=0–1) was computed by dividing the sum score by the number of deficit items for all respondents who provided valid information in at least 35 out of 40 items, which amounted to >99% of the respondents in each wave.
Supplemental material
Key explanatory variables in this article were education, occupational class, income and wealth. Education was measured using the International Standard Classification of Education (ISCED-97): primary (0–1), lower secondary (2), upper secondary (3) and postsecondary education (4–6). Occupational class was measured through The European Socio-economic Classification using a three-class model (salariat/intermediate/working class) based on the International Standard Classification of Occupations (ISCO-88). Wave-specific and country-specific quartiles of income and wealth were calculated based on the five imputations provided in SHARE, which compensate for non-response. Income refers to purchasing power parity adjusted and equivalised net household-level income, including wages, pensions and social transfers. Wealth refers to household net worth, including real and financial assets minus financial liabilities. Measures of income and wealth refer to the year preceding the interview. Time variables included age (in years) and birth cohort (<1930/1931–1940/1941–1950/>1950). Control variables included sex (male/female), living alone (no/yes) and sample attrition, that is, a non-response in at least one wave after the first interview (no/yes) and respondent's death (no/yes) between waves. Missing data were negligible (<1%) for all variables except occupational class (15.0%), particularly because ISCO codes of respondents who did not participate in the labour market (homemakers, permanently sick/disabled and chronically unemployed) are missing by design. Consequently, these respondents were excluded from further analysis.
Model
Frailty trajectories were assessed based on growth curve models, using hierarchical linear modelling36 with three levels: up to four measurements of frailty were nested within individuals, which were in turn nested within countries. Using growth curve models allows one to compare average frailty levels and change over time for different SEP levels. Furthermore, the multilevel approach used for analysis can handle missing data in the dependent variable and unequal time spaces. We first estimated unconditional means models in order to assess random variance components. Second, we calculated within-person growth trajectories, controlling for birth cohort in order to assess the change in frailty across the life span. A non-linear quadratic model was found to provide the best statistical fit and was thus used for all further models. Regarding the impact of SEP, we estimated conditional growth models for each measure (education, occupational class, income and wealth) first separately (M1a–M1d), and then simultaneously (M2), in order to assess the extent of the overlap in explanation between SEP measures. The final model (M2) is depicted by the equation below, where  represents the FI for an individual i at age j in country k. Age was mean-centred (sample mean=67.2 years) and divided by 10 for readability, so that
  refers to the frailty level (intercept) at average age, while
  represents the linear and
  the quadratic growth rate per 10-year period. As an example for the full range of predictor variables included, the next portion in the equation depicts average differences in frailty by educational level
  , and trajectories
  via interaction terms with age. We thus modelled main effects and interaction effects with age for all predictors. The final part of the equation after the suspension marks depicts the random effects, that is, the degree of deviation of an individual's FI (
 ) and FI growth
  , and the country average FI
  and FI growth
  from the overall intercept
  and slope
  , as well as the residual error term
  .
.
Education, occupational class, gender, birth cohort, non-response and death were entered as time-constant predictors, and income, wealth and living alone as time-varying predictors. Additionally, cohort and country-separated models were fitted in order to assess between-country differences and across-cohort changes. We estimated maximum likelihood multilevel regression models with package lme4 (V1.1-9)37 for R: a language and environment for statistical computing (V3.2.2). Model comparison was based on goodness-of-fit statistics (Akaike information criterion, Bayesian information criterion), explained variance and likelihood ratio tests.
Results
Table 1 shows the sample characteristics for the first and the fifth wave. FI in the pooled sample ranged from 0 to 0.91, and showed the characteristic distribution with mean=0.13, median=0.10 and 95th/99th centile=0.33/0.51 (figure 1A). Correlations between the four measures of SEP were moderate at most (Spearman's ρ<0.35) except for education and occupational class (Spearman's ρ=0.52). In the unconditional means model, 48.4% of the total variance of FI was attributed to within-person change, 48.2% to between-person and 3% to between-country variance. Table 2 shows that despite considerable overlap, lower education, occupational class, income and wealth were statistically significant, independently and consistently associated with higher levels of FI at average age.
Sample characteristics in the first and last wave of SHARE
Multilevel growth curve models of FI

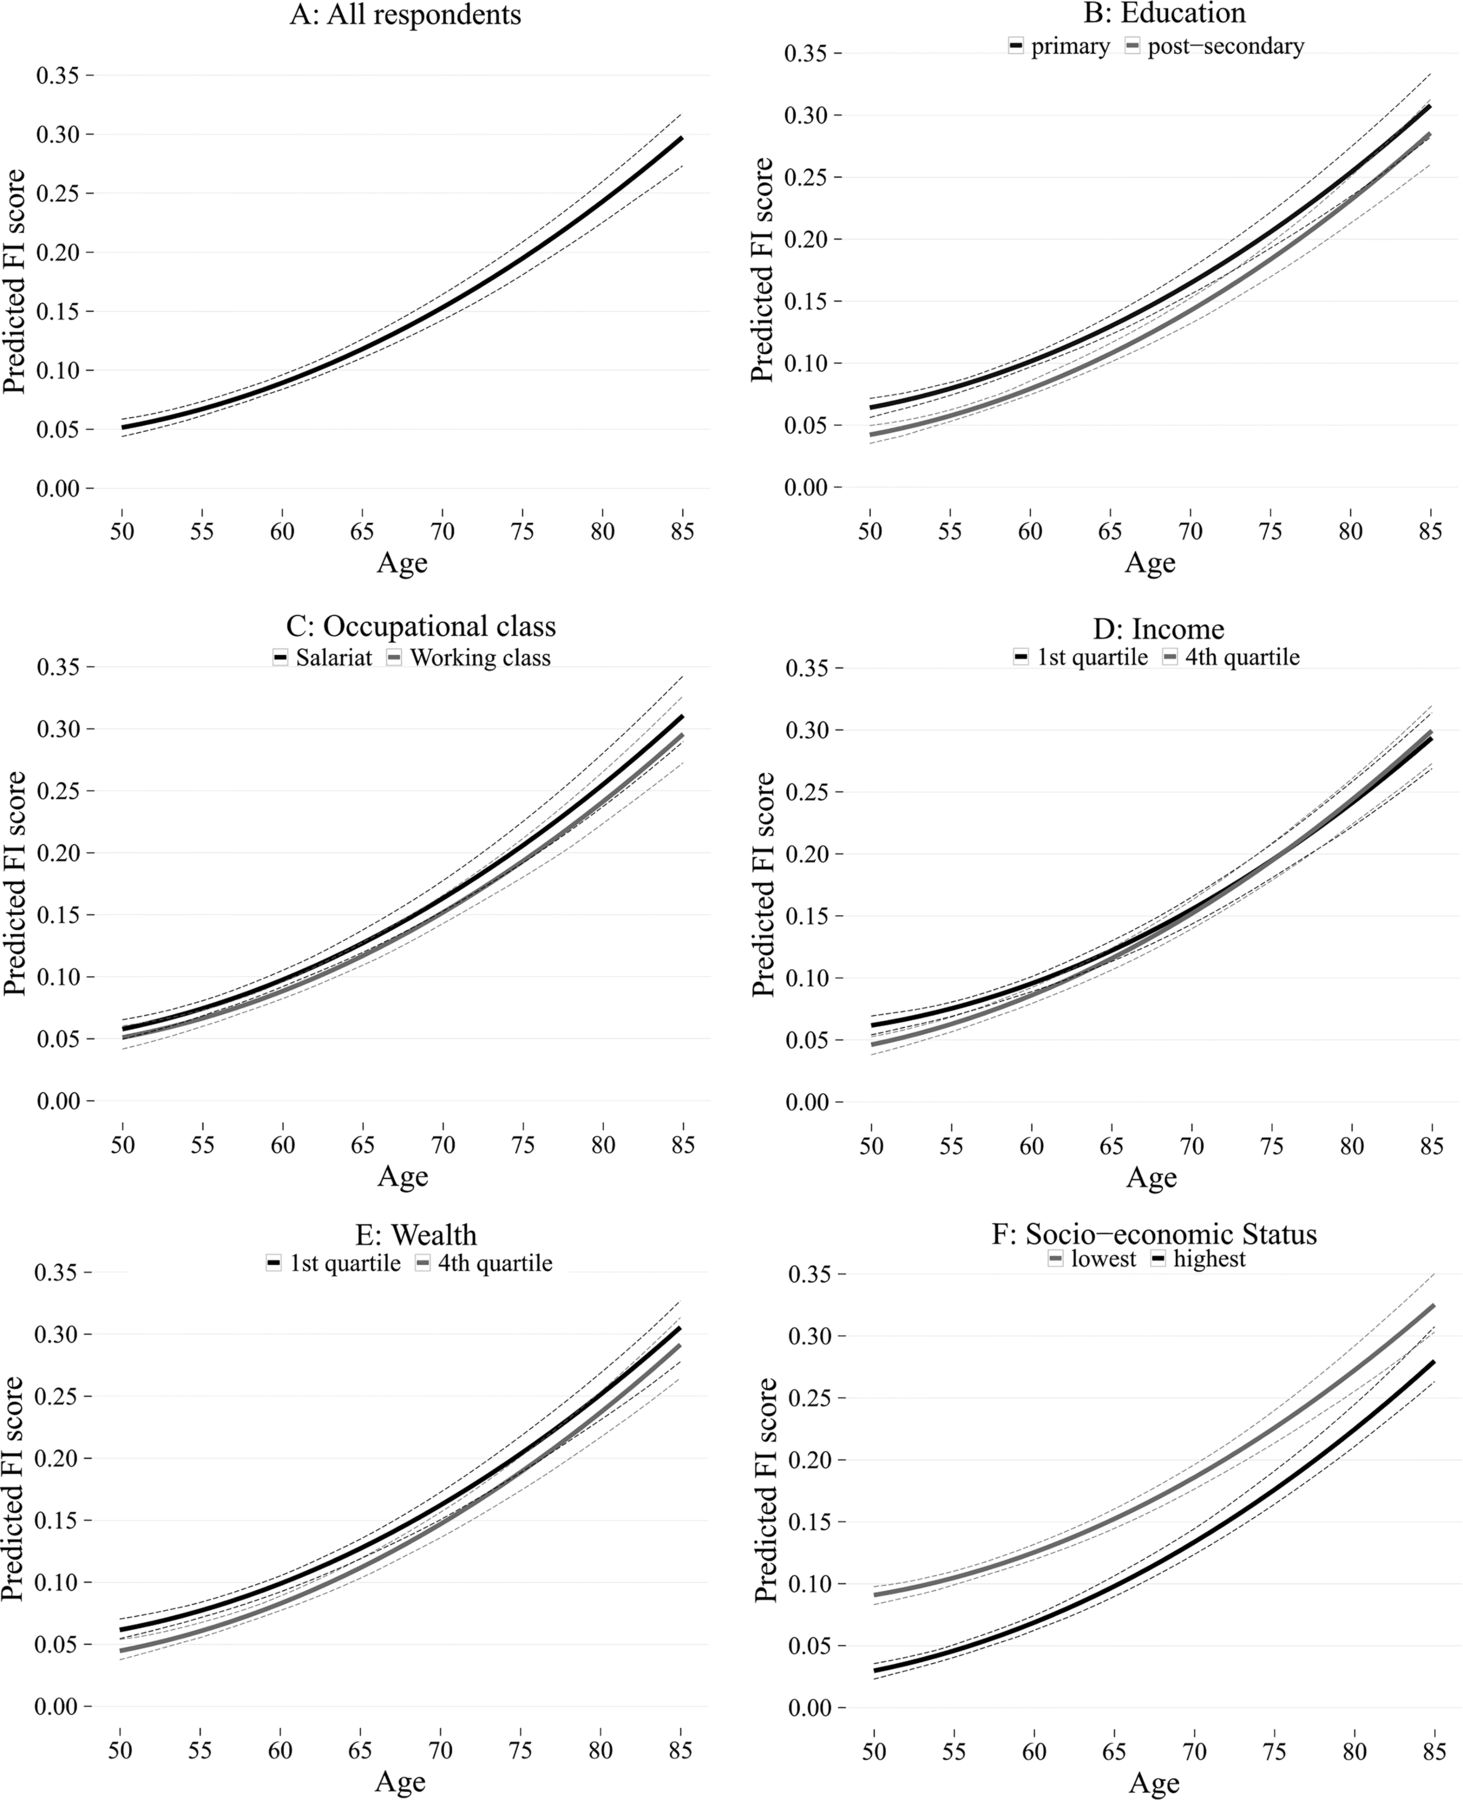
Predicted frailty trajectories for (A) all respondents (50+), (B) by education, (C) by occupational class, (D) by income, (E) by wealth and (F) by accumulated SEP. Lowest SEP in (F) refers to the combination of ISCED: 0–1, working class, first quartile income and first quartile wealth. Highest SEP refers to the combination of ISCED: 4–6, salariat, fourth quartile income and fourth quartile wealth. FI, frailty index; ISCED, International Standard Classification of Education; SEP, socioeconomic position.
The effect was found to be weakest for income and strongest for education. Figure 1 shows the predicted frailty trajectories (from the fixed part of the model) with 95% CIs (dotted lines) for all respondents (A), and for each the lowest and highest level of education (B), occupational class (C), income (D), wealth (E) and accumulated SEP (F). The latter shows that at age 67, a respondent with the lowest level of education (ISCED: 0–1), occupation (working class), income (first quartile) and wealth (first quartile) was equally frail (FI=0.165, CI 0.157 to 0.174) as someone with the highest level of education (ISCED: 4–6), occupational class (salariat), income (4th quartile) and wealth (4th quartile) was at age 74 (FI=0.167, CI 0.157 to 0.181), that is, 7 years later. Statistically non-significant growth rates pointed to a continuous impact of education, occupation and wealth on FI trajectories, whereas convergence was implied only regarding income, which was completed around age 70.
Apart from SEP, women were expectedly more frail on average than men (γ=0.012, CI 0.010 to 0.014) and accumulated health deficits at a higher rate (γ=0.004, CI 0.002 to 0.006). Later birth cohorts showed higher average FI and growth than those born before 1930. Analyses stratified by cohort (see online supplementary file) furthermore suggested that, while inequality in average FI due to wealth decreased for subsequent birth cohorts, inequality with respect to education increased. Across countries, average FI and growth were lowest in Switzerland and Sweden and highest in Italy and Spain. Finally, analyses stratified by country (see online supplementary file) showed considerable variation in health gaps at average age with regard to indicator and effect size. Furthermore, we found almost uniformly continuous effects of education and occupational class on frailty, more mixed results for wealth and convergence regarding income in 6 of 10 countries, with two more countries showing partial convergence regarding wealth instead.
Discussion
In this secondary analysis of the SHARE, we assessed the dynamic impact of four SEP indicators on frailty trajectories in old age in 10 countries. The FI calculated in this study closely followed the characteristics outlined in previous research,10 ,14 ,33–35 thus supporting its validity as a comprehensive measure of physiological decline, which, also due to its fine-grained measurement, is better suited for the assessment of SEP-related health trajectories in older age than single subjective or objective health measures. We found gaps in frailty levels for all four indicators of SEP, thereby confirming and extending results from previous studies that tested only for one or two indicators respectively,10 ,14 ,35 and support for multiple health gradients rather than threshold effects. The different trajectories and the independent contribution of all four measures of SEP for explaining frailty levels suggest different-sized additive but resource-specific effects, in line with earlier findings.8 ,9 ,11–15 Future research should, therefore, strive to include a variety of SEP measures since relying on a single indicator of SEP might underestimate the effect of accumulated SEP and bias the results.19 ,24
The relatively stronger effect of education suggests that underlying mechanisms associated with education (eg, the role of psychosocial resources or health-related knowledge and behaviour throughout life28 but potentially also the longer impact of education, which may particularly affect health problems gradually developing over time7) are particularly decisive for the enduring health gap found in old age. Interestingly, our cohort-specific analyses showed educational health inequality to have increased over time, a fact reported previously regarding mortality38 and morbidity,7 ,14 and attributed to the faster diffusion and adoption of healthcare treatments and health-related behaviours among the higher educated.18 Consequently, this suggests that the education-based selective use of societal advances in terms of health-related knowledge, behaviour and technology in affluent European societies in the second half of the 20th century plays a key role for frailty levels and trajectories in old age. This stands in contrast to the declining impact of household wealth on frailty across birth cohorts. Wealth seems more relevant for the health of older adults from earlier birth cohorts, who experienced prolonged periods of economic and social turmoil in their childhood/adolescence in the first half of 20th century. For these cohorts, savings and assets may confer more security and well-being39 than for later cohorts experiencing higher absolute individual and societal wealth. These findings and the higher average frailty levels we found in later birth cohorts—recently also documented for the USA and the UK10 ,14—deserve further research.
The main focus of this article was the impact of multiple measures of SEP on frailty trajectories. In this regard, we found educational, occupational and wealth differentials to continue up into very old age, which (partially) confirms results from previous studies.4–6 ,9 ,11–13 In contrast, a recent longitudinal study from the UK has found the impact of wealth on frailty (FI) to converge.10 This difference could, however, be attributable to the fact that we tested multiple indicators of SEP simultaneously rather than relying on a single measure. Indeed, if not controlled for education, occupation and income, the impact of wealth showed tendencies of convergence in our data as well, which, however, declined once the other indicators were included.
The continuity of education-based, occupation-based and wealth-based gaps in health throughout old age in Continental Europe is a key result of this study, which adds to longitudinal research challenging the still widespread belief that health inequalities narrow in old age. Our results regarding education and occupation support the status maintenance hypothesis. It could be argued that the educational level realised in early life keeps the health gap up due to differences in health knowledge and health behaviour, which more likely prevent or delay the onset of health problems for the higher educated.7 ,30 Similarly, physical and psychological consequences of occupational characteristics throughout adult life seem to extend into old age.5 ,28 It has also been reasoned that a pattern of continuity in European countries instead of a levelling-off—as has been documented particularly for the USA—could be due to the more comprehensive and continuous public social protection over the life course in Europe.12 ,15 Although this might conform to absolute differences between the USA and Continental Europe, our comparative results across countries within Europe—that is, continuity regarding education and occupational class in most countries, and mixed results regarding wealth—seem to not closely follow differences in public spending for social protection between countries, nor established welfare regime typologies. Therefore, the explanatory value of welfare state characteristics for old age dynamics in health inequalities remains unclear.
Regarding income, we found convergence of comparatively small initial health gaps, which is partly in line with results of previous studies,12 ,14 albeit in contrast to findings from other studies,8 ,9 ,13 none of which, however, tested for the (dynamic) effects of all four measures of SEP. Congruent with a previous smaller cross-national15 and a national study,12 we found the highest rate of convergence for income in Germany. Since we relied on the FI as a comprehensive measure of physiological decline, our results here are in principle compatible with the notion of biological frailty catching-up as implied in the age-as-a leveller theory,7 as respondents in higher income quartiles showed steeper frailty trajectories. Alternative explanations, for example, a confounding effect of selective mortality or differences in potentially compensating public social spending, were not supported by our results. However, in the face of continuous effects of the other measures of SEP, it remains unclear why an equalising effect of biological frailty should be limited to income alone. Our analyses thus indicate that the dynamic relationships between different measures of SEP and health are likely more complex than anticipated by existing theoretical accounts. Future empirical research should not only focus on specific effects of education, occupation, income and wealth but rather strive to disentangle attributable mechanisms such as living environments, psychosocial resources and health behaviour. Furthermore, when assessing multiple SEP indicators, the absolute size of health gaps should be given more attention, since a continuing sizeable health gap merits more attention from a scientific and a public health perspective than a small one converging.
We consider the findings of our study to be robust and generalisable to older adults in continental Europe, as we were able to use longitudinal data from multiple waves of SHARE spanning 10 years and multiple countries, and to control for cohort-specific and country-specific effects and for sample attrition. Furthermore, we consider causality to mostly run from measures of SEP towards frailty and not vice versa since the level of education is fixed from an early age onward, since occupational class referred to working age while a large proportion of the sampled older adults was already retired and since income and wealth, which were modelled as time-varying predictors, referred each to the year before frailty was measured.
Although we cannot rule out biases due to education being more reliably measured than income or wealth in general or due to period effects, we consider them unlikely to be substantial. Two further limitations are noteworthy. First, the usage of occupational class as a measure of SEP excluded older adults who have not participated in the labour market from the analysis, and hence downbiased FI estimates slightly. Second, cross-national differences in the proportion of institutionalised older adults which are not surveyed in SHARE, and cross-nationally varying response styles40 likely downward-bias the estimates of FI in Nordic countries and upward-bias them in Southern Europe.
In conclusion, we showed that different measures of SEP have differently shaped and sized impacts on frailty trajectories, with education-based, occupation-based and wealth-based gaps in frailty persisting throughout old age, whereas smaller income-based health inequalities converged. Country-specific and cohort-specific patterns indicate a complex interplay between different resources (and restrictions) associated with education, occupation, income and wealth, and frailty trajectories. Further theoretical and empirical research will be needed to understand the nature of these prevailing health inequalities in order to subsequently address and reduce them through public health interventions.
What is already known on this subject
Health inequalities are often considered to decrease with age.
Health inequalities in old age based on single indicators of socioeconomic position regarding frailty have been demonstrated for the USA and UK.
Recent birth cohorts have been reported to exhibit higher levels of frailty in the USA and the UK.
What this study adds
This study tested the impact of multiple indicators of socioeconomic position on frailty trajectories and found evidence for continuity (education, occupation, wealth) but also convergence (income) in Continental Europe.
Frailty levels were higher and growth curves steeper in later birth cohorts and in Southern European countries, and the impact of education was more prominent in later birth cohorts.
References
Footnotes
Contributors ES led the design of the study, conducted the literature review and analysis, and wrote the paper. HM, AW, ÉR and WF contributed to the literature review and the analysis, and reviewed the paper carefully.
Funding This work was supported by no specific institution but only the Medical University of Graz. This paper uses data from SHARE Waves 1, 2, 3 (SHARELIFE), 4 and 5 (DOIs: 10.6103/SHARE.w1.260, 10.6103/SHARE.w2.260, 10.6103/SHARE.w3.100, 10.6103/SHARE.w4.111, 10.6103/SHARE.w5.100). The SHARE data collection has been primarily funded by the European Commission through FP5 (QLK6-CT-2001-00360), FP6 (SHARE-I3: RII-CT-2006-062193, COMPARE: CIT5-CT-2005-028857, SHARELIFE: CIT4-CT-2006-028812) and FP7 (SHARE-PREP: N211909, SHARE-LEAP: N227822, SHARE M4: N261982). Additional funding from the German Ministry of Education and Research, the U.S. National Institute on Aging (U01_AG09740-13S2, P01_AG005842, P01_AG08291, P30_AG12815, R21_AG025169, Y1-AG-4553-01, IAG_BSR06-11, OGHA_04-064) and from various national funding sources is gratefully acknowledged (see http://www.share-project.org).
Competing interests None declared.
Provenance and peer review Not commissioned; externally peer reviewed.
Data sharing statement This study uses data from the Survey of Health, Ageing and Retirement in Europe, which is freely available to academic researchers.