Article Text

Abstract
Background: Relative socioeconomic disparities in cardiovascular mortality have increased in New Zealand, as in many Western countries in Northern Europe, the US and Australia during the late 20th century. However, substantial declines in cardiovascular mortality mean that its absolute contribution to overall mortality has decreased.
Research questions: How did the absolute contribution of major causes of death to socioeconomic inequalities in New Zealand change during the 1980s and 90s?
Methods: Linked census–mortality cohorts were used to calculate the contribution of different causes of death to inequalities in mortality, measured with the slope index of inequality, by household income.
Results: Between 1981–4 and 1996–9, the contribution of cardiovascular disease (CVD) to total inequality declined from 55% to 28% among women, whereas at the same time the contribution of cancers increased from 14% to 37%. Among men, the contribution of CVD to total inequality peaked at 47% in 1986–9, then declined to 38% in 1996–9. The contribution of cancer increased from 19% to 26% in men.
Conclusion: CVD mortality has declined at all income levels and so too has the contribution of CVD to mortality inequalities. Concurrently, the contribution of cancer to inequalities in mortality by income has increased and, in women at least, is now greater than the contribution of CVD. It is hypothesised that a similar crossover is occurring in other populations where CVD mortality has declined, although socioeconomic differences in the distribution and effect of the obesity epidemic for CVD may ensure its continuing importance. Prevention efforts aimed at reducing socioeconomic inequalities in mortality will need to increasingly focus on socioeconomic inequalities in cancer mortality.
- CVD, cardiovascular disease
- SII, slope index of inequality
Statistics from Altmetric.com
Inequalities in mortality between socioeconomic groups have increased in Northern Europe and the US in recent decades1–6—at least in relative terms. In many instances, cardiovascular disease (CVD) has been an important driver of these increasing relative inequalities in total mortality. In a combined study of six European countries, CVD accounted for about 50% of the increase in relative inequalities in total mortality, between 1981–5 and 1991–5.2 Increasing relative inequalities have arisen because CVD death rates, which have fallen dramatically in most of these countries, have shown a proportionally greater decrease among higher-ranked socioeconomic groups. The changing contribution of CVD to absolute inequalities in mortality has been less well documented. In Finland, CVD accounted for most (>80%) of the increase in the gap in male life expectancy between manual and non-manual occupational classes between 1970 and 1995; and for 45% of the increase among females.4
Levels of absolute and relative inequality are mathematically linked such that when average mortality falls, and absolute inequalities are constant, then relative inequalities must increase (appendix A). When varying trends in mortality for different causes are combined with changing levels of absolute and relative inequalities, we expect the contribution of different causes of death, to total inequalities to change. In particular, we expect that in New Zealand substantial falls (>50%) in cardiovascular mortality during the 1980s and 90s led to a declining contribution of CVDs to total absolute inequality, even in the presence of large increases in relative inequality. If our expectation is true, it has major implications for policies to reduce future inequalities in health—they must shift to considering other diseases as drivers of inequalities.
Our study aimed to determine trends in the contribution of CVD and other major causes of death (eg, cancer) to inequalities in mortality by income in New Zealand during the 80s and 90s.
METHODS
Data source
The New Zealand Census Mortality Study anonymously and probabilistically linked census records to mortality records for the 3 years subsequent to the 1981, 1986, 1991 and 1996 census to create four cohorts as described elsewhere.7–9 Linkage was restricted to census respondents aged <75 years on census night. For this paper, analyses were limited to respondents aged between 25 and 74 years on census night, who with 3 years follow-up attain ages up to 77 years. Approximately 75% of all deaths were linked back to a census record.
Analyses of the rate of linkage of mortality records showed that linkage varied according to age, sex, ethnicity, area level deprivation index, cause of death and rurality of residence. To adjust for incomplete linkage and differences in the linkage rates between sociodemographic strata, inverse probability weights were calculated for numerous strata on the basis of age, sex, area-based deprivation index, ethnicity, cause of death (mortality records) and rurality of residence. For example, if in the strata of Maori male decedents, aged 45–64 years, residing in moderately deprived small areas of New Zealand, 20 out of 30 were linked to a census record, each of the 20 linked records received a weight of 1.5 ( = 30/20). These weights were applied to the linked census-mortality records, meaning that subsequent cohort analyses were corrected for any linkage bias. Details of the weighting process are described in detail elsewhere.10
Equivalised household income was calculated by summing the personal income of all household members, then adjusting for economies of scale according to household composition (number of adults and children) with the New Zealand-specific Jensen Equivalisation Scale.11 A further adjustment was then made, using the consumer price index to adjust the 1981, 1986 and 1991 equivalised household incomes to 1996 dollars. Analyses were limited to respondents with complete information for household equivalised income; 20%, 16%, 16% and 19% of the four sequential cohorts were excluded from the analyses owing to missing data on income.
Table 1 gives the categorisation of cause of death by ICD9 (International Classification of Diseases, ninth revision) codes.
Categorisation of cause of death by International Classification of Diseases, ninth revision (ICD 9)codes
Age and ethnicity standardised mortality by income was calculated with the 1991–4 cohort as the standard. Ethnicity, being both a determinant of socioeconomic position and independently associated with mortality, confounds the association of education and mortality.12,13 To illustrate trends in total mortality by income level, income was grouped into five levels by dividing the 1986–9 cohort into quintiles of household-equivalised income and then applying these income cut-points to all four cohorts.
The slope index of inequality (SII) was used to summarise inequality in absolute terms across the entire population. The SII, a regression-based measure of the total association of the socioeconomic factor of interest with health or mortality in the study population, is the absolute difference in mortality between the 0th and 100th centiles of the income variable in the population under investigation. The SII for the component causes of total mortality sum to the total SII for all causes combined. The proportional contribution is therefore the SII for each cause divided by the overall SII. The change in contribution is assessed as the percentage contribution of each cause to total SII in 1996–9 minus the percentage contribution of that cause to the total SII in 1981–4.
To calculate the SII, the income variable was rank transformed to have a value in the range from 0 (least advantaged) to 1 (most advantaged).14 For example, where income groups, ranked from lowest to highest, comprise five equal-sized quintiles of the study population, the socioeconomic variable is transformed to have the values 0.1, 0.3, 0.5, 0.7 and 0.9. In a large sample, this is equivalent to a modified ridit score.15 The SII was calculated by weighted least squares regression of the mortality for each quintile of income on the rank-transformed socio-economic variable, using the proc REG procedure in SAS. Weights were the person-time in each income category.
Ethical approval for the New Zealand Census-Mortality Study was granted by the Wellington Ethics Committee.
RESULTS
The four cohorts comprised between 3.5 million person-years in 1981 and 5 million person-years in 1996, with approximately 30 000 deaths during each period (table 2).
Total person-years and number of deaths in each cohort from 1981–4 to 1996–9 by cause of death and sex
Standardised mortality rates by income level
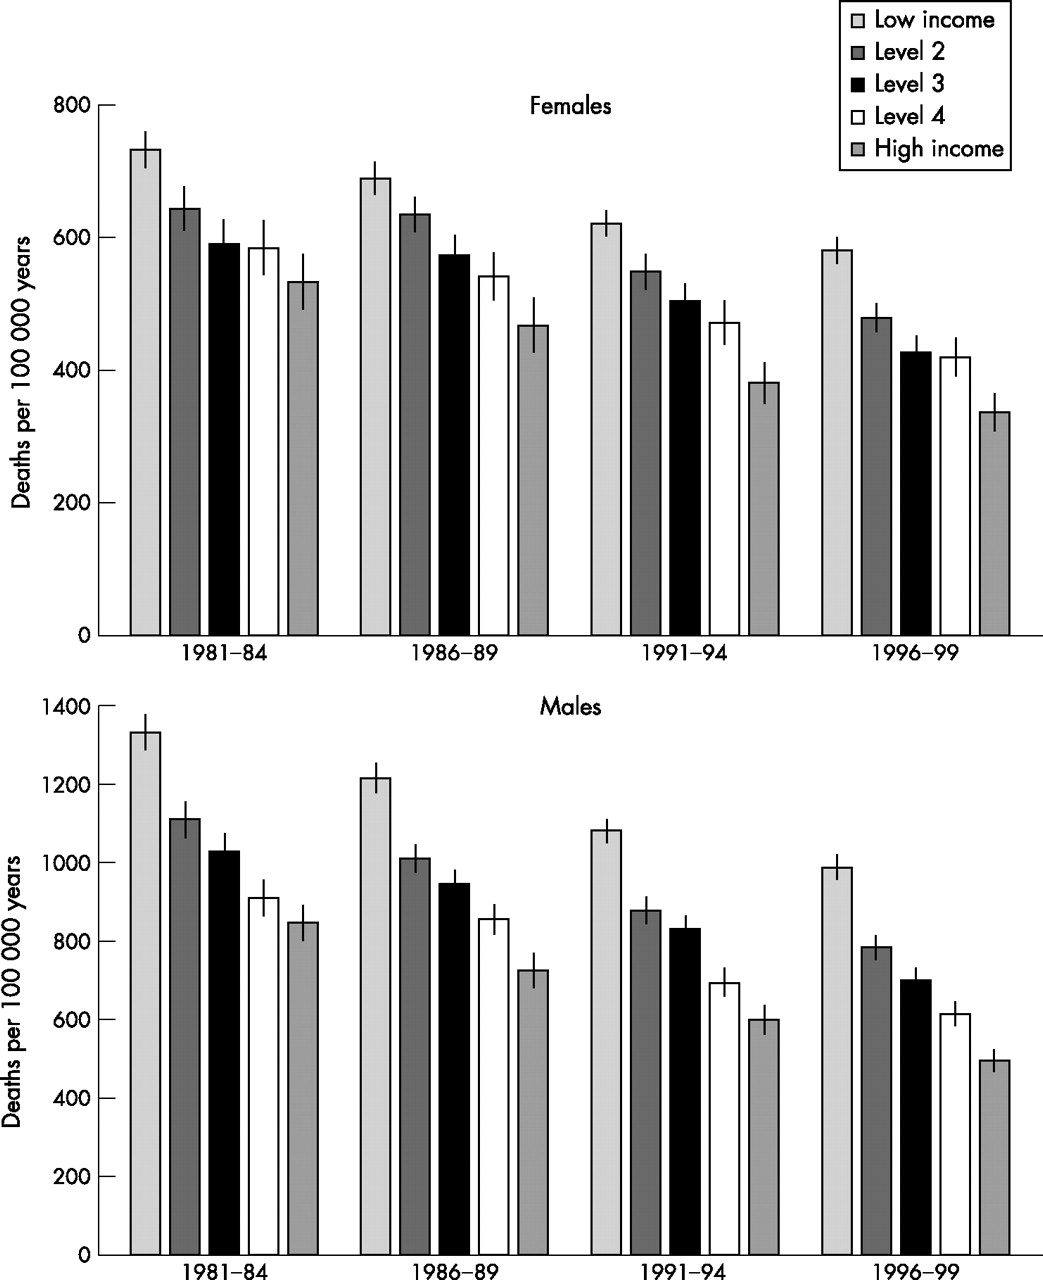
Figure 1 shows total mortalityby income level. Two patterns are evident: firstly, lower income is associated with higher levels of mortality in all four periods and secondly, mortality declined over time for all income levels. The absolute level of mortality decline between 1981–4 and 1996–9 was slightly higher at high income levels for women but similar at all levels of income for men; for women mortality declined by 152, 164, 164, 164 and 196 per 100 000 years and for men mortality declined by 344, 327, 329, 296 and 351 per 100 000 years in the five income groups, ordered from lowest to highest.

Figure1 Total mortality */100 000 years, by level of income†, for each cohort from 1981–4 to 1996–9.
Trends in mortality by cause of death
Table 3 shows trends in mortality by causes of death, and changes in mortality between 1981–4 and 1996–9. Between 1981–4 and 1996–9 total mortality decreased by 26% (from 636 to 471 per 100 000 years) for women and by 30% (from 1057 to 739 per 100 000 years) for men. Declines in mortality were recorded for most causes; however, the decline was most pronounced for CVD, where the rates halved in both women and men. Mortality declined for most causes of death, although marked increases were seen for lung cancer (+41%) among women and for suicide among men (+41%).
Standardised mortality /100 000 person-years (95% CI) for each cohort from 1981–4 to 1996–9, by cause of death and sex
Trends in the absolute inequality
Table 4 shows the total SII, the SII by cause of death and the contribution of each cause to the total SII. For both men and women the total SII was higher in the 1990s than in the 1980s. For women, the SII increased from 247 in 1981–4 to 327 in 1996–9. The corresponding increase for men was from 554 to 616.
The absolute and percentage contribution* of causes of death to the total SII for each cohort from 1981–84 to 1996–99, by sex
Trends in the contribution of causes of death to total inequality in mortality
Table 4 also shows the percentage contribution of each cause to the total SII and the change in the percentage contribution to total inequality between 1981–4 and 1996. In all time periods, CVDs, especially ischaemic heart disease and stroke, were important contributors to overall inequality. However, the contribution of CVD to the overall SII fell from 55% to 28% for women and from 42% to 38% for men. Stratifying by age, the decline in the importance of CVD was limited to the 60–77-year-age group (results not shown).
In contrast with CVD, both the SII for cancer and the contribution of cancer to the total SII increased from 14% to 37% for women and from 19% to 26% for men. For women, the increase was due to the increased contribution of all cancers: the contribution of lung cancer increased from 6% to 11%; breast cancer from 1% to 5%; colorectal cancer from 1% to 3%; and other cancers combined from 12% to 17%. By 1996–9, the contribution of all cancers combined is greater than the contribution of CVD in women.
For men, as with women, no particular cancer stands out as driving the increase in the contribution of all cancers to the total SII. Unlike in women, the contribution of lung cancer peaked in 1986–9 in men, but remained fairly stable thereafter. The contribution of colorectal and other cancers also increased over time. Prostate cancer was important at older ages only (results not shown).
Respiratory diseases (mainly chronic obstructive pulmonary disease) were important contributors to overall inequality, comprising around 10–12% in most periods.
Injury and suicide were less important contributors to total inequality in the total age group. However, analyses by age (results not shown) show that for young men (25–44 years), the contribution of injury was substantial but decreased from 42% to 21% between 1981–4 and 1996–9. At the same time, the contribution of suicide increased from 4% to 21% of the SII for 25–44-year-old men.
DISCUSSION
Summary of main findings
CVD remains an important contributor to inequalities in mortality by income level for both women and men, despite substantial declines in CVD mortality at all levels of income. A substantial decline was observed in the importance of CVD for total inequality among women; however, the decline was less pronounced among men.
The contribution of cancer to inequalities in all-cause mortality increased over time. By 1996–9, cancer contributed more to the overall income gradient in mortality in women than CVD. Lung cancer mortality was a factor in this increase, but other cancers were also important. Among men, the contribution of lung cancer to inequalities was relatively constant.
Strengths and limitations
The study covers the entire New Zealand population over a period of major restructuring of economic and social institutions. The inclusion of the full population aged 25–74 years on census night maximises the power of the study and generalisability of the analyses. The fact that each of the cohort has the same design increases the internal validity of comparisons over time—even if there are weaknesses intrinsic to the study design that are the same for all four cohorts (eg, only 3 years of follow-up, possible loss of income before census night owing to poor health), they are the same for all four cohorts. Nevertheless, death is a relatively rare outcome, especially at young ages, and so analyses of some subpopulations still encounter problems of insufficient statistical power.
We were unable to link all eligible mortality records to a census record. To overcome this incomplete linkage, we assigned weights that were inversely proportional to the probability of decedents from that sociodemographic strata being linked. This should remove most, if not all, systematic linkage bias that might otherwise affect cohort analyses.
Between 16% and 20% of cohort members were excluded from the analyses because of missing income data. These missing data introduce the potential for bias in the SII if the relationship between income and mortality is different for those included in the analyses compared with those excluded from the analyses. Furthermore, if the size and direction of any bias vary by time period, the estimation of trends in inequality may be biased. Sensitivity analyses showed that the increase in all-cause inequality in mortality may be overestimated somewhat for women, but is slightly underestimated for men (details available from the authors). However, the observed selection bias will probably not affect the observed changes in the contribution of causes of death to inequalities.
Studies in Europe show that socioeconomic inequalities in mortality are still substantial at age ⩾75 years, and that overall CVD was the largest contributor to inequalities for this age group.16 Unfortunately, deaths for people ⩾75 years on census night were not linked to census data in the New Zealand Census Mortality Study, precluding parallel analyses.
Comparisons with international studies
Many studies3,6,17–24 either report changing inequalities in total and cause-specific mortality or the contributions of causes of death to inequalities at one point in time. However, few studies have determined trends in the contribution of causes of death to absolute socioeconomic inequalities in mortality. Martikainen et al4 compared the contribution of the different causes of death to changes in life expectancy in Finland for manual and non-manual occupational classes between 1971 and 1995. CVD accounted for most (>80%) of the increase in the gap in life expectancy for men and approximately 45% for women. Cancers contributed about 16% for men and 25% for women. Suicide and alcohol-related causes also contributed to widening inequalities. We are not aware of any other studies that have explicitly identified cancer as a major driver of increasing socioeconomic inequalities in mortality over time.
Interpretation and policy implications
There are four non-mutually exclusive explanations for the growing contribution of cancer to inequalities in health that we will comment on. Firstly, as stated in the Introduction (and demonstrated in appendix A), an ongoing decline in CVD mortality in the whole population means that at some point its absolute contribution to overall inequalities in mortality must also decline. The decline in cardiovascular mortality during the 1980s and early 1990s has been attributed equally to both declines in the prevalence of risk factors and improved treatment of primary disease.25 In particular, declines in smoking rates, cholesterol levels and population blood pressure account for most of the reduction due to risk factors, whereas improved treatments for acute myocardial infarction, secondary ischaemic heart disease prevention, hypertension, heart failure and angina contributed to about half the decline in mortality. However, it is a moot point how much cardiovascular mortality will continue to decline in light of a growing rate of obesity in New Zealand with its potential CVD burden. Among women, at least, there is also clear evidence that the increase in obesity has been disproportionately greater for lower socioeconomic groups, who already have a higher incidence of ischaemic heart disease.26
Secondly, death rates for some cancers are increasing. Hence, the importance of some cancers for overall mortality and, subsequently, for total inequalities has increased. Lung cancer among women is the primary example in this study of increasing death rates having a role in the increased importance of cancer for inequalities.
Thirdly, aetiological risk factors for cancer may be becoming more socially patterned. The most obvious example is tobacco smoking, and, indeed, it is making an increasing contribution to socioeconomic inequalities in mortality over the 1980s and 1990s in New Zealand.27 The differences between women and men at the stage of the smoking epidemic are likely to be important for explaining trends in the contribution of lung cancer to total absolute inequalities. The trends in lung cancer reflect trends in smoking prevalence 20 years earlier. The results in this study show substantial increases in lung cancer mortality for women, whereas the mortality for men decreases after peaking in 1986–9. Results published elsewhere22,27 show that lung cancer mortality for women was increasing only for those with low incomes, whereas for men the decrease in mortality occurred only for those with higher income.
Increasing inequalities in colorectal cancer, breast cancer and prostate cancer27 point to changing distributions in other factors. One example is that of dietary risk factors and body weight (risk factors for prostate28 and colorectal29,30 cancers, at least), which have moved to more carcinogenic profiles overall in the population, but particularly so among lower socioeconomic groups.26
The increased contribution of breast cancer to overall inequalities occurs in the context of declining overall mortality but increases in inequality. The results presented here suggest a reversal of the income gradient in mortality for breast cancer whereby death rates were higher in high-income groups in the early 1980s. This change in the socioeoconomic gradient follows a similar direction to trends observed elsewhere,31–35 and has been related to declines in fertility and later childbearing as lower socioeconomic groups adopt the patterns of their more advantaged compatriots. More recently, inequalities in access to screening and early detection may also be a factor in the inequalities trends.36,37
Fourthly, the increasing socioeconomic inequalities in detection and treatment of diagnosed cancer is also a contributing factor. Victora38 hypothesised that more rapid and extensive uptake of public health programmes (eg, screening programmes) and interventions (eg, novel cancer treatments) by socioeconomic groups will lead to increasing relative inequalities in health. Less advantaged groups would only catch up with high socioeconomic groups after the high socioeconomic groups had secured the maximum possible benefit from the new knowledge and initiatives. Applying this “inverse care” law to cancer, slow but steady improvements in cancer prevention knowledge, services and treatments are a plausible explanation for increasing inequalities in cancer mortality. There is some emerging evidence of differential survival from cancer, adjusted for stage, by ethnic group in New Zealand8,39 and, to a lesser extent, by socioeconomic group.40 From a policy perspective, these results point to the need to be aware of, monitor, understand and act on existing and emerging socioeconomic inequalities in cancer. In New Zealand, the recently developed Cancer Control Strategy has as its second purpose to “reduce inequalities in the impact of cancer”.41 Furthermore, policies that promote equal access to interventions and technologies that improve cancer survival have the potential to reduce the overall cancer mortality.
CONCLUSION
CVD mortality has declined at all income levels and so too has the contribution of CVD to mortality inequalities. Concurrently, the contribution of cancer to inequalities in mortality by income has increased and, for women at least, is now greater than the contribution of CVD. We hypothesise that a similar crossover is occurring in other populations in which CVD mortality has declined, although socioeconomic differences in the distribution and effect of the obesity epidemic for CVD may ensure its continuing importance. Prevention efforts aimed at reducing socioeconomic inequalities in mortality need to increasingly focus on socioeconomic inequalities in cancer mortality.
What is already known
-
Socioeconomic inequalities in adult mortality exist for many causes of death in most countries.
-
In relative terms, socioeconomic inequalities increased in many countries in the later part of the 20th century.
-
In Northern Europe, much of the increase in relative inequalities was accounted for by increasing inequalities for cardiovascular disease.
-
Cardiovascular mortality has declined substantially through much of Europe, the US and Australasia since the 1970s.
What this paper adds
-
This paper illustrates trends in absolute inequalities in mortality by cause of death and shows the changing importance of different causes of death for total absolute inequalities. As cardiovascular disease becomes a less common cause of death, its contribution to overall income inequalities is declining in the New Zealand population aged 25–77 years.
-
Instead, cancer is emerging as the major driver of inequalities in mortality in the New Zealand population aged 25–77 years.
Policy implications
-
To effectively deal with socioeconomic inequalities in mortality in New Zealand, effective interventions are required to understand and reduce cancer inequalities.
APPENDIX A
When the slope index of inequality (SII) is calculated by weighted-least squares regression of the death rates on the rank transformed income variable, as described in the Methods, the average mortality (λ) is the rate for the mid-point of the population (ie, x = ½). Thus
λ=α+½β
SII=β
RII=(α+β)/α
Hence by substitution of equations 2 and 3 into equation 1
λ=SII/(RII−1)+SII/2
Thus, if the average death rate falls, the ratio of SII to relative index of inequality (RII) must also fall, which can only be achieved by either a decrease in SII (absolute inequality), or an increase in the RII, or both. Alternatively, if average mortality is constant, then increases in RII will be accompanied by increases in SII.
Acknowledgments
The New Zealand Census Mortality Study is conducted in collaboration with Statistics New Zealand and within the confines of the Statistics Act 1975.
REFERENCES
Footnotes
-
Funding: The New Zealand Census Mortality Study is funded by the Health Research Council of New Zealand and cofunded by the Ministry of Health. These funders had no role in the drafting of this paper.
-
Competing interests: None.
-
The New Zealand Census Mortality Study is a study of the relationship between social factors and mortality in New Zealand, and is based on the integration of anonymised population census data from Statistics New Zealand with mortality data from the New Zealand Health Information Service.
The project was approved by Statistics New Zealand as a Data Laboratory project under the Microdata Access Protocols in 1997. The datasets created by the integration process are covered by the Statistics Act and can be used for statistical purposes only. Only approved researchers who have signed Statistics New Zealand’s declaration of secrecy can access the integrated data in the Data Laboratory. For further information about confidentiality matters in regard to this study, please contact Statistics New Zealand.
Linked Articles
- In this issue