Article Text

Abstract
Objectives The aims were to analyse changes in nutritional parameters from diagnosis of amyotrophic lateral sclerosis (ALS) to death and to assess their relationships with survival at the time of diagnosis and during follow-up.
Methods 92 ALS patients were included and clinically assessed every 3 months (ALS functional rating scale, manual muscular testing, forced vital capacity, weight, BMI, percentage weight loss). Bioimpedance was performed to evaluate body composition (fat-free mass, fat mass and hydration status) and phase angle. Survival analyses were performed from diagnosis to death or censoring date using a Cox model.
Results The evolution of nutritional parameters in ALS patients was marked by significant decreases in weight, BMI, fat-free mass and phase angle, and increased fat mass. The authors identified an adjusted 30% increased risk of death for a 5% decrease from usual weight at time of diagnosis (RR 1.30; 95% CI 1.08 to 1.56). During follow-up, the authors identified adjusted 34% (95% CI 18% to 51%) and 24% (95% CI 13% to 36%) increased risks of death associated with each 5% decrease in usual weight and each unit decrease in usual BMI, respectively (p<0.0001). Malnutrition during the course was related to a shorter survival (p=0.01), and fat mass level was associated with a better outcome (RR 0.90 for each 2.5 kg fat mass increment).
Conclusions Nutritional parameters of ALS patients worsened during evolution of the disease, and worse nutritional status (at time of diagnosis or during the course) was associated with a higher mortality. This study offers some justification for studying the use of therapeutic nutritional intervention to modify the survival of ALS patients.
- Amyotrophic lateral sclerosis
- epidemiology
- cohort studies
- prognosis
- weight loss
Statistics from Altmetric.com
Introduction
Alteration of nutritional status among patients suffering from amyotrophic lateral sclerosis (ALS) is multifactorial, involving: dysphagia, chewing difficulties, difficulty moving the extremities, reduced caloric intake1 and hypermetabolism.2 3
Malnutrition is an independent prognostic factor for survival during the course of ALS, with an eightfold increased risk of death.4 Body mass index (BMI) has been identified as a prognostic factor for survival at time of gastrostomy placement5 and indications for non-invasive ventilation,6 and a recent study identified longer survival in ALS patients with a high blood low-density lipoprotein (LDL)/high-density lipoprotein (HDL) cholesterol level.7
To date, studies on relationships between nutritional status and survival of ALS patients have considered nutritional status only during the course of the disease. There is a need to obtain further information on the relationships between survival and nutritional status at the time of diagnosis. It would also be of great interest to evaluate this relationship during follow-up, and to describe the evolution of nutritional parameters during the course of the disease. The aims of this study were to collect the following data at the time of diagnosis and during subsequent follow-up, to analyse changes that occur and to assess their relationships with survival: anthropometric nutritional parameters (percentage of weight lost, BMI, triceps skinfold thickness representing fat mass, mid-arm muscular circumference representing fat-free mass) and paraclinical parameters (fat mass, fat-free mass, phase angle, extracellular/intracellular fluid volumes measured by total body impedance analysis (BIA)).
Methods
Eligibility criteria
This study was performed within the Limoges ALS expert centre. A total of 92 ALS patients diagnosed between 1997 and 2007 according to Airlie House criteria were enrolled. They included patients with a definite, probable or probable laboratory-supported form either at time of diagnosis or during follow-up. Subjects had to be followed at least twice during the course by the nutritional unit of the centre, with the first nutritional evaluation performed at the time of diagnosis.
Data collection
Sociodemographic and neurological data were extracted from the computerised database of the ALS centre, which contains prospectively gathered clinical data on all ALS patients. The database was approved by the Commission Nationale de l'Informatique et des Libertés, and patients gave their informed consent for data collection. The end of data collection was 1 March 2009. Clinical assessments were performed every 3 months.
Neurological and respiratory assessments
These consisted of manual muscular testing (MMT) of all the extremities and the neck, as defined by the Medical Research Council (maximal value 150) and the ALS functional rating scale (ALS FRS) (maximal value 40). The neurologist specified the date of onset of the first disease symptom, and the site of onset (bulbar or spinal). Diagnosis delay was calculated as the time between the dates of first symptoms and of diagnosis. Forced respiratory vital capacity was measured using a Hans Rudolph pneumotachograph, integrated in a body plethysmography system 1085 (CPF Medical Graphics, St Paul, Minnesota). Results were expressed in relation to a theoretical calculated index value.
Nutritional assessment
Patients were weighed in their underwear in a seated position on an electronic SECA chair scale (Vogel & Halke, Hamburg, Germany) recording to 0.1 kg. Height was obtained standing upright for all the patients at the first evaluation, using a SECA gauge recording to 0.2 cm (Vogel & Halke). BMI was calculated according to the formula BMI=weight/height2. Patients were classified for nutritional status using BMI as follows: (i) malnutrition: BMI <18.5 if age <70 years and BMI<21 if age ≥70 years; (ii) normal status: 18.5≤BMI<25 if age <70 years and 21≤BMI<27 if age ≥70 years; (iii) overweight: 25≤BMI<30 if age <70 years and 27≤BMI<30 if age ≥70 years; (iv) obesity: BMI≥30.8 9 The percentage of weight lost was calculated as compared with the usual weight as recorded 6 months before the first symptoms. Units of BMI lost were accordingly calculated using usual weight. Triceps skinfold thickness (mm) was measured using a Harpenden caliper. Three measurements were performed on each side of the body, and the retained value was the mean of all. Mid-arm muscular circumference (MAMC, cm), was calculated using triceps skinfold thickness (TSF) and the mean mid-arm circumference (MAC, cm) measured on each side of the body, using the equation: MAMC=MAC−0.314×TSF.10 BIA was performed using an Analycor3 instrument with surface electrodes (Spengler, Paris, France) according to standard methods, at 50 kHz, 5 kHz and 100 kHz11 (median number of evaluations: 3; interquartile range (IQR): 2–4). The monofrequency BIA measured phase angle (in degrees) which is directly related to cell membranes (amount and functional status of cells) and whose normal value is considered to be 6° and over in healthy subjects,12 fat mass (kg) and fat-free mass (kg), and bifrequency estimated extracellular and intracellular fluid volumes (in litres) and their ratio which gives a picture of the cell membrane status.12 The phase angle (PA) was obtained using the formula: PA=arctan(Xc/R) (in degrees), where Xc is the body reactance (resistive effect due to capacities induced by tissue interfaces and cell membrane in ohms), and R is the bioelectrical resistance (linked to bodily extracellular hydration, in ohms).
Power assessment
When the total number of events is 74, a 0.050 level two-sided logrank test for equality of survival curves will have 80% power to detect the difference between a group 1 survival probability at time t (eg, 24 months) of 0.40, and a group 2 survival probability at time t of 0.62 (constant HR of 1.92).
Statistical analysis
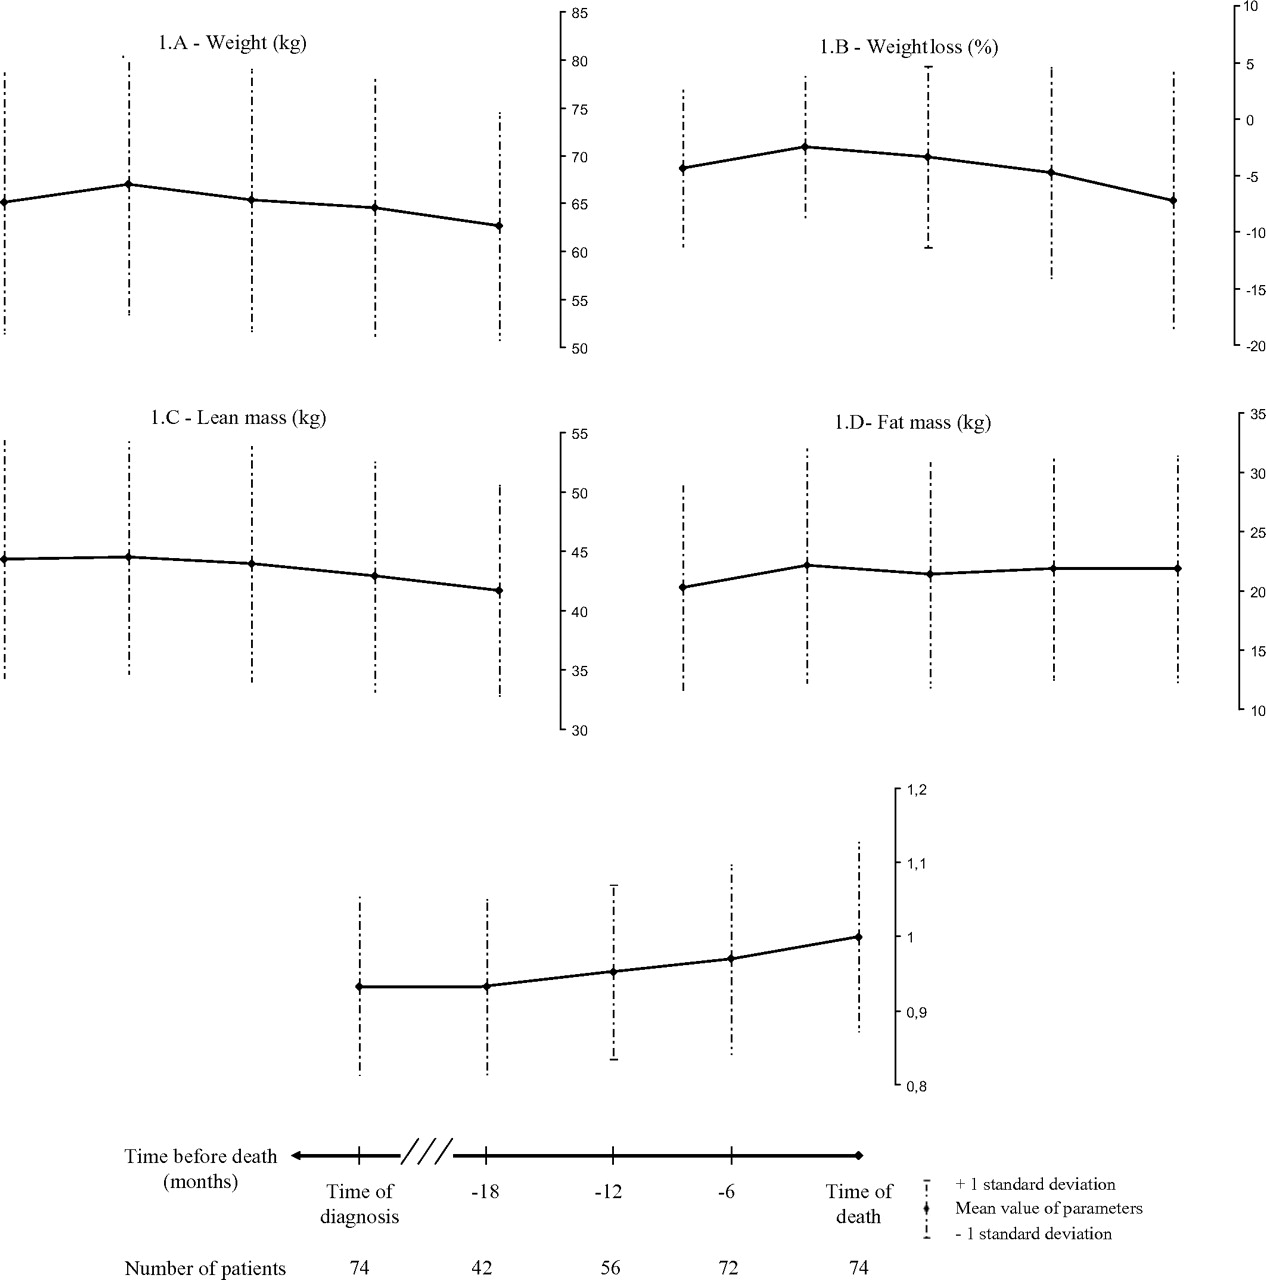
Quantitative variables were described using the median and IQR. Qualitative variables were described using frequency and percentage. Normality for distribution of quantitative variables was assessed using the Shapiro–Wilk test. Paired quantitative variables were compared using the Wilcoxon rank signed test. Quantitative variables were compared between groups using the Kruskal–Wallis test, and pairwise comparisons used the Wilcoxon test. Paired proportions were compared using the Mac Nemar χ2 test. Evolution of nutritional markers was plotted against time, using time until death as baseline. The means (±1 SD) are depicted on the graphs. We calculated means (±SD) of nutritional markers for all patients at two common time points: time of death and time of diagnosis. At intermediate time points (at least 6 months, 12 months and 18 months before death) the numbers of patients may be lower than the total due to death over time. Survival was analysed from the date of diagnosis until the death of the patient or the censoring date—the date of the last neurological consultation. The Kaplan–Meier method was used to estimate survival function, and the logrank test was used to compare the survival distribution among groups. Univariate and multivariate analyses were performed using the Cox proportional hazard model. To identify the prognostic value of nutritional variables measured at diagnosis, we adjusted our analyses according to clinical markers measured at diagnosis: ALS FRS (five-unit increment), MMT (five-unit increment), Airlie House Criteria (definite, probable, probable laboratory-supported ALS vs possible ALS), forced vital capacity (FVC) (≥80% of theoretical value vs <80%) and diagnostic delay (1-month increment). To identify the prognostic value of nutritional variables measured over the entire follow-up, we used time-varying covariates for nutritional variables and for other neurological or respiratory adjustment variables: ALS FRS (five-unit increment), MMT (five-unit increment), Airlie House criteria (definite ALS vs other categories) and FVC (10% increment) and diagnostic delay (1-month increment). Those adjustment variables were forced in the first multivariable model, which was simplified using a backward stepwise procedure. Survival analyses for nutritional variables were performed separately. Relevant interactions between variables in each final multivariate model were tested. Loglinearity assumptions were checked graphically and hypotheses for proportional hazard were tested using an interaction term between time and variables. A p value of <0.05 was considered statistically significant. We complied with ‘Strengthening the Reporting of Observational Studies in Epidemiology’ guidelines.13 Analyses were performed using SAS, Version 9.1.2 (SAS Institute, Cary, North Carolina).
Results
Baseline demographic and clinical characteristics
The median age at diagnosis was 65.6 years (IQR 56.5 to 73.3), and the sex ratio was 1. The bulbar form at onset represented 48% of cases. Supplementary baseline clinical characteristics are depicted in table e-1 (supplementary file). The median weight variation at diagnosis according to usual weight was −2.32% (IQR −7.76 to 0.68) and median BMI variation at diagnosis according to usual BMI was −0.55 unit (IQR −1.99 to 0.15) (see supplementary table e-2). The latter two values were significantly different from 0 (p=0.0001). At the time of diagnosis, 8.70% of patients were malnourished according to BMI category.
Medical care and outcome
During the follow-up, 39.10% of patients underwent non-invasive ventilation, and 57.60% were gastrostomised. All patients were treated with riluzole. The proportion of gastrostomy was significantly higher in patients malnourished at the time of diagnosis (75.00%) compared with patients with a normal BMI (59.50%), overweight patients (64.50%) and obese patients (18.20%; p=0.036). The median time between diagnosis and gastrostomy placement was 10.00 months (IQR 6.10 to 15.20). During the follow-up, 74 patients died (80.40%), median survival time being 27.80 months (95% CI 19.50 to 30.40).
Evolution of nutritional markers between diagnosis and death
All nutritional markers varied between diagnosis and death (table 1). Accordingly, weight, BMI, percentage of weight and BMI variation (as regards usual weight) and lean mass showed a significant worsening from diagnosis to death (figure 1A–C). Before death, the median per cent weight loss reached −7.05% (IQR −14.36 to −1.16), and the median BMI loss −1.70 (−3.62 to −0.25). Fat-free mass also decreased significantly using bioimpedance or mid-arm muscular circumference. Conversely, fat mass (figure 1D)and triceps skinfold thickness increased significantly. The phase angle decreased dramatically (median value 3.37° to 2.29°) and the ratio of extracellular fluid volume over intracellular fluid volume increased (median value 0.93 to 1.00) (figure 1E). During follow-up, the proportion of malnourished patients increased to 15.2%, though non-significantly (Mac Nemar χ2 test p=0.058); the proportions of patients with normal BMI and who were overweight appeared stable (56.5% and 22.8%, respectively), and the proportion with obesity was reduced (5.5%).
Nutritional variables at diagnosis and last evaluation for people who died during follow-up

Evolution of nutritional factors from time of diagnosis to time of death: (A) weight (kg); (B) weight loss (%); (C) lean mass (kg); (D) fat mass (kg); (E) extracellular/intracellular fluid volumes.
Prognostic value of nutritional markers at the time of diagnosis
At the time of diagnosis, the percentage of weight lost from usual weight was significantly associated with survival. After adjustment for age, gender, bulbar form at onset, ALS FRS, MMT, FVC and diagnostic delay, we identified a 30% increase in the risk of death (95% CI 8% to 56%) for each 5% decrease in weight (table 2). We identified a significant difference in survival between ALS patients with a weight loss of 5% and over at the time of diagnosis (median survival time: 20.6 months (95% CI 12.4 to 29.0)) as compared with patients whose weight was stable or dropped by less than 5% (median survival time: 29.0 months (95% CI 21.2 to 38.5)), logrank test p=0.01 (figure 2). Patients with a weight loss of 5% or over experienced an adjusted 1.92 RR of death (95% CI 1.15 to 3.18). Each BMI unit lost from the usual BMI was associated with an adjusted 20% increased risk of death (95% CI 6% to 36%). The rate of weight loss (percentage per month) and rate of BMI loss (unit per month) between first symptoms and diagnosis were also independently associated with survival. Malnutrition at baseline and other nutritional variables including phase angle and ratio of extracellular fluid volume over intracellular fluid volume were not associated with survival in multivariate analysis.
RRs of death associated with nutritional variables measured at diagnosis in univariate and multivariate analysis

Survival functions of amyotrophic lateral sclerosis patients according to percentage of weight loss at time of diagnosis.
Prognostic value of nutritional markers over the entire follow-up
While considering nutritional status over the entire follow-up, we identified a 34% increased risk of death for each 5% decrease from the usual weight and a 24% increased risk for each unit decrease from the usual BMI (table 3). The rate of weight loss during the course of the disease did not appear to be significantly associated with survival. Malnutrition also appeared significantly associated with survival (p=0.01). As compared with patients in the normal range of BMI, malnourished patients experienced a 2.15 (95% CI 1.09 to 4.25) increased risk of death, whereas overweight and obese patients tended to have a reduced risk of death: RR 0.71 (95% CI 0.40–1.28) and 0.36 (95% CI 0.11–1.19) respectively. An increase in fat mass using triceps skinfold thickness or bioimpedance was significantly associated with a better outcome. An increase in ratio of extracellular fluid volume over intracellular fluid volume was significantly associated with a shorter survival in multivariate analysis (p=0.02). In survival analyses, there was no significant interaction between bulbar form at onset and BMI or weight loss at diagnosis or in subsequent follow-up.
Relative risks of death associated with nutritional variables measured over the entire follow-up in univariate and multivariate analysis
Discussion
We have shown that patients with a weight loss from usual of 5% and over at the time of diagnosis experience a twofold increase in the risk of death (median survival time: 20.6 months (95% CI 12.4 to 29.0)) as compared with patients whose weight remains stable or drops by <5% (median survival time: 29.0 months (95% CI 21.2 to 38.5)). Weight loss at diagnosis was identified as an independent prognostic factor with an adjusted 30% increased risk of death for a 5% decrease from usual weight. We also identified during the course of ALS a decrease in weight, BMI, fat-free mass, and phase angle, and an increase in fat mass. We observed an adjusted 34% increased risk of death associated with each 5% decrease from usual weight during follow-up. Malnutrition during the course was associated with a shorter survival (p=0.01) and fat mass level was associated with a better outcome (RR 0.90 for each 2.5 kg fat mass increment).
This work is, to our knowledge, the first demonstration of the prognostic value for survival of the nutritional status of ALS patients at time of diagnosis. Other authors have reported the prognostic significance of BMI for survival, but only if it is assessed at the time of gastrostomy placement,5 or an indication for non-invasive ventilation,6 or during the course of the disease.14 A correlation analysis performed by Kasarskis et al also found an association between BMI and proximity of death.15
Concerning malnutrition assessed by BMI during the follow-up, our results are in agreement with Desport et al who, in 1999,4 showed that malnutrition was an independent prognostic factor for survival. In that study, the mean delay between first symptoms and nutritional assessment (29±25 months) was longer than in our work where an assessment was performed at the time of diagnosis (median time between first symptoms and diagnosis 7.9 months (IQR 6.0 to 12.2)) and in a subsequent follow-up. The absence of an association between malnutrition at diagnosis and survival here could be due to a lack of power caused by the low initial percentage (8.7%) of malnourished patients.
In a seminal paper, Slowie et al reported that for a limited number of ALS patients during a large range of times between diagnosis and assessment (6 months to 11 years), 25% of patients lost 10% of their weight.1 According to our data, at the time of diagnosis, the nutritional status of patients is already highly altered: 50% lost more than 2.3% of weight, and 25% lost more than 7.8% and 2 units of BMI. It has to be acknowledged that alteration of nutritional status is multifactorial: progressive muscular wasting due to denervation,1 swallowing or salivary disorders and dysphagia present at the time of diagnosis in patients with the bulbar form or appearing during the course are also implicated.4 In addition, anorexia, digestive disorders and upper-limb motor difficulties contribute to low intake. Moreover, an increase in energy requirement sufficient to exceed intake has been demonstrated in 50% of patients.2 3 The reason for this hypermetabolism is not known. Our study was not designed to explore the respective contributions of these factors. A further study looking at that point could also assess the link between mobility and the weight/body composition of ALS patients.
Following the literature, only 9% of patients were malnourished according to BMI at the time of diagnosis, reaching 15% at the last nutritional evaluation.4 16 17 This alteration is also highlighted by the dramatic reduction in phase angle at the time of diagnosis and before death. The early decrease in phase angle during ALS reflects alteration of the body composition, and general health and function. Similar patterns are displayed by the ratio of extracellular fluid volume over intracellular fluid volume.
In common with Nau et al18 and other authors,19 we identified modifications of body compartments in ALS patients, with a loss of fat-free mass and a gain of fat mass during the course. Our study shows for the first time that a higher fat mass is beneficial for survival of ALS patients. Similar results have already been reported in chronic obstructive pulmonary disease,20 cardiac insufficiency21 and haemodialysis patients,22 suggesting that in several chronic diseases, a moderate excess of weight could aid survival. In ALS patients, Dupuis et al7 have shown that patients with high LDL/HDL cholesterol have a longer survival, confirming previous results in mice.23 It is worth considering whether high LDL/HDL may be associated in many cases with either a sustained nutritional status or a weight excess with a higher fat storage. In accord with Patel et al,24 our results suggest that enhanced fat storage through an energy-enriched diet may improve patient survival. This hypothesis is also supported by animal models showing a better outcome for SOD1-G93A transgenic ALS mice fed with a ketogenic diet.25 This concept is opposed to previous suggestions that modest weight loss may be desirable early in the course of the disease in order to obviate any unnecessary accumulation of fat.26
We have to acknowledge that usual predictions from a hospital-based study may have limited validity for population-based patients. Rapidly deteriorating patients may not survive until referral to an academic centre or may be too ill to go there, whereas younger patients are more likely to seek a second opinion. Although our study is hospital-based, our ALS centre is the only multidisciplinary care centre in our region, and our incidence profile (2.0/100 000 inhabitants for the 1997–2007 period and 4.4/100 000 in the 45–74 age group) is highly consistent with data from American or European registries.27 It can be convincingly argued that our centre is representative of the ALS population. Moreover, because of the inclusion criteria (follow-up by our nutrition unit), half the patients had a bulbar form at onset. We think our results provide valuable information relevant to the whole ALS population because our study population is probably better followed from a nutritional point of view than the ALS population overall.
This result has three main implications. First, our findings provide important support for a re-evaluation of daily routine nutritional management and for considering early nutritional intervention to improve survival of ALS patients. The prognostic value of weight loss at the time of diagnosis and quite late nutritional interventions allow us to propose close monitoring of nutritional status following a diagnosis of ALS. Despite the value of BIA in monitoring body composition, our results and their clinical application support weight assessment as the first priority. We propose that a weight loss of 5% from usual be considered a threshold for systematic dietary recall, nutritional assessment, and BIA evaluation of fat mass and fat-free mass. For people without such a weight loss, close monitoring every 3 months of weight at least could be appropriate.
Our results have other implications for epidemiological and clinical research. Weight loss at the time of diagnosis is an independent prognostic factor for survival of ALS patients, so observational studies should adjust their estimations accordingly. Those conducting clinical trials might use percentage weight loss as a stratification criterion because a slight disequilibrium between groups for this strong prognostic factor could mask the modest efficacy of a new treatment.
Finally, in contrast to other recognised prognostic factors at diagnosis, the nutritional status of patients can be modified using oral or enteral procedures. It is interesting to consider that the correction of weight loss at diagnosis could exceed the effect of riluzole on survival.28 Consequently, trials to investigate such interventions are needed. Early enteral nutrition could be a challenge because studies showed that percutaneous endoscopic gastrostomy (PEG) is effective in stabilising body weight/BMI. According to the American guidelines for management of ALS patients, there is level B evidence that PEG should be considered for prolonging survival in patients with ALS, but the optimum time for PEG insertion is still unknown.29 There is, however, growing evidence that PEG placement should be performed before FCV<50% to prevent respiratory deficiency during insertion, and radiological inserted gastrostomy has been shown to be a safe alternative below this threshold.30 Although European guidelines for care of ALS patients state that PEG placement should be envisaged early in the course of the disease,31 patients have difficulty accepting it then. The median delay between diagnosis and gastrostomy placement in our study (10 months) can be considered as early, but is probably late as far as nutritional status and improvement of survival are concerned. Another trial could investigate the effects of nutritional supplementation enriched in energy and lipids close to diagnosis as compared with a diet adapted for caloric needs.
Acknowledgments
We thank W Francis for reviewing the manuscript.
References
Supplementary materials
Web Only Data
Files in this Data Supplement:
Footnotes
Competing interests None.
Patient consent Obtained.
Provenance and peer review Not commissioned; externally peer reviewed.