Article Text

Abstract
Objective To investigate the psychometric properties of the Hospital Survey on Patient Safety Culture on a Scottish NHS data set.
Methods The data were collected from 1969 clinical staff (estimated 22% response rate) from one acute hospital from each of seven Scottish Health boards. Using a split-half validation technique, the data were randomly split; an exploratory factor analysis was conducted on the calibration data set, and confirmatory factor analyses were conducted on the validation data set to investigate and check the original US model fit in a Scottish sample.
Results Following the split-half validation technique, exploratory factor analysis results showed a 10-factor optimal measurement model. The confirmatory factor analyses were then performed to compare the model fit of two competing models (10-factor alternative model vs 12-factor original model). An S–B scaled χ2 square difference test demonstrated that the original 12-factor model performed significantly better in a Scottish sample. Furthermore, reliability analyses of each component yielded satisfactory results. The mean scores on the climate dimensions in the Scottish sample were comparable with those found in other European countries.
Conclusions This study provided evidence that the original 12-factor structure of the Hospital Survey on Patient Safety Culture scale has been replicated in this Scottish sample. Therefore, no modifications are required to the original 12-factor model, which is suggested for use, since it would allow researchers the possibility of cross-national comparisons.
- Safety culture
- patient safety
- Hospital Survey on Patient Safety Culture
- incident reporting
Statistics from Altmetric.com
Background
Organisational safety culture not only influences worker injuries—as demonstrated in industrial research1 2—but also has been shown to be associated with patient safety outcomes such as treatment,3 medication errors and patient falls.4 5
A number of safety-climate instruments have been developed within healthcare,4 6–9 and these have also been adapted for application within different countries. A review of the main safety climate instruments for healthcare found that limited reference to theoretical frameworks and the psychometric properties were rarely assessed.10 At that time, one exception was the Hospital Survey on Patient Safety Culture (HSOPSC).11 Although this instrument is of US origin, it has been used within European countries, including Norway,12 England,13 The Netherlands,14 Belgium15 and Switzerland.16 However, conflicting results of underlying factor structures have been reported. While the 12-factor original model was replicated in both the Norwegian and Belgian samples, the Dutch data resulted in 10 factors and Swiss data in eight, and the English data revealed a nine-factor structure. Considering the disparate survey methods (eg, clinical vs non-clinical staff), analytical techniques (confirmatory factor analysis (CFA) vs exploratory factor analysis (EFA)) and modifications made to adopt the instrument to the healthcare settings in different European countries, it is not surprising that these studies yield inconsistent results.
Although Scotland has a similar National Health System to that of England and Wales, the healthcare is devolved to the Scottish government; it has a number of distinctive features, such as unitary NHS boards (rather than primary and secondary trusts), a Quality Improvement department responsible for patient safety and a national patient safety programme, introduced in 2007 for the acute hospital sector. For this reason, the aim of this paper is to investigate the psychometric properties of the HSOPSC in a Scottish healthcare setting (table 1), with a view to identifying a suitable questionnaire to assess the level of safety climate in hospitals and also to benchmark the data against other European countries. A well-structured instrument would allow examination of the underlying causal mechanisms influencing safety performance.
Estimated response rates per board (one hospital)
Method
Procedure
The 14 NHS health boards in Scotland were contacted and invited to provide an acute hospital for the study. If a board had more than one acute hospital, then the research team suggested which site would enable them to have the correct mix of teaching/non-teaching and large/small hospitals, but the final decision was given to the board in order to accommodate recent/ongoing staff surveys, other research studies, operational activities and logistical constraints. Overall, 10 boards replied, one declined, and nine boards agreed to be included in the sample. Later, one board withdrew owing to having conducted a recent staff survey similar to HSOPSC. Another board participated, but the response rate from the hospital was so low that it could not be included.
The data presented here were collected from seven acute NHS hospitals in Scotland (one per board), between February and September 2009. Given the results of previous studies conducted with HSOPSC16 (which indicated that some items might not be suitable for non-clinical staff), only clinical staff were surveyed.
The procedure for administration of the questionnaires was determined in conjunction with each participating board or hospital. Both paper-based and web-based surveys (SNAP 9) were made available. Paper questionnaires were provided with a covering letter and sealable envelopes for return to the University team or to the collection point within the hospital unit. No names were requested to enhance anonymity.
Advice obtained from National Research Ethics Service (NRES) was that this study was a Service Evaluation and therefore would not require a National Research Ethics Service ethics application. The project plan was approved in 2008 by the Scottish Patient Safety Alliance Advisory Group and Steering Group, and the Scottish Workforce and Staff Governance Group.
Measure
Selection of the instrument
The reasons for employing HSOPSC were as follows. At the time of selection, this questionnaire was the most rigorously designed in the literature.10 Since it has been used extensively in the USA,17 it provides North American benchmark data, and there are now reports from studies of hospitals in European countries providing results for cross-national comparisons. The European Society for Quality in Healthcare (2010) has published a report Promoting Patient Safety Culture summarising the patient safety culture instruments used in member states (MS).18 The HSOPSC has been used extensively within the member states, and was one of three instruments that have been recommended. This questionnaire covers a wide range of dimensions generally regarded as core factors of healthcare safety culture (table 2) and is reasonably concise.19
Subscales of Hospital Survey on Patient Safety Culture with definitions20
According to Sorra and Nieva,20 development of the HSOPSC was based on a comprehensive literature review, including both published and unpublished safety culture surveys, in addition to interviews with hospital staff. The instrument was then pilot-tested on 1437 hospital employees from 21 hospitals in the USA. The final set of 42 HSOPSC items (17 reverse-coded) showed a 12-factor structure, 10 climate dimensions plus two outcome variables (overall perceptions of safety and frequency of incident reporting). There are also two single-item outcome measures which were not included in their factor analyses.
Adjustments
As the HSOPSC was originally designed for USA healthcare staff, it required customisation for a Scottish sample, as has been necessary in the other European studies. First, 10 interviews were conducted with NHS healthcare staff (including doctors, nurses, a pharmacist, a risk manager and occupational therapists) in order to check for the usability of the instrument within a Scottish NHS context. The participants indicated that the main question set covered necessary areas and confirmed the suitability of the instrument. Therefore, all the items were retained in order to keep the instrument comparable with its original version, except the term ‘event,’ which was changed to ‘incident’ in order to adjust the terminology to Scottish healthcare. Additionally, three new outcome scales (safety behaviours, patient and worker outcomes; measured by 12 items) were added to the Scottish hospital questionnaire, but these data are not reported here, since the object of this study is to establish the psychometric properties of the HSOPSC in a Scottish sample.
Sample
The sample was drawn from clinical staff in seven acute NHS hospitals. A total of 1969 clinical staff filled in the questionnaire with an estimated 22% response rate. Then three participants were excluded from the final sample, since they were found to complete less than half of all items. Although the number of questionnaires sent to each hospital was known, it was not clear how many were distributed within each unit. The estimated response rate per hospital ranged from 15% to 31% (see table 1). These response rates are likely to be underestimated, since some hospital representatives later stated that not all the delivered questionnaires had been distributed.
The majority of the sample were nurses (50%) followed by allied health professionals (21%), doctors (14%), and nursing or healthcare assistants (15%). In relation to work unit, 21% of the participants were from surgical departments, 16% were from medical units, and the remainder were sampled across a range of other units, such as radiology, obstetrics and rehabilitation. A total of 90% of the respondents had been working in their current hospital for more than a year, and a total of 92% of the respondents reported having direct contact with patients, while 7% reported not to have any.
Statistical analysis
In order to examine the theoretical factor structure of a given instrument, using the strengths of both EFA and CFA techniques has been recommended.21 In this respect, while EFA is a less restrictive procedure which does not require a priori specification of the factors, CFA tests whether a predetermined factor structure fits the data. Because of the problems associated with conducting EFA and CFA on the same data set,22 to test the validity of the HSOPSC, a split-half validation technique was used, and the sample was randomly split into two independent groups using SPSS 17.0. Given the contradictory findings of the HSOPSC factor structure discussed above, EFA was first carried out on the calibration half of the data set (Sample I, n=965) to investigate the suitability of the 12-original-factor model, as well as to identify an alternative model. Subsequently, CFA with the maximum likelihood method using EQS 6.1 for Windows23 was performed on the validation half of the data set (Sample II, n=1001) to test how well the two models (original 12-factor and an alternative model) fit the Scottish data. Both the EFA and the CFA were conducted at the individual level. Additionally, Cronbach α scores were calculated for each factor to assess reliability, and intercorrelations were examined for the whole sample to determine the discriminant validity.
Results
Constructing a model using the calibration sample
First, EFA (principal-component analysis with Varimax rotation) was performed on the randomly selected calibration half of the data set with 42 items. The Kaiser–Meyer–Olkin (KMO) coefficient as a measure of sampling adequacy of 0.92 indicates there is common variance among the items. Together with a significant Bartlett test of sphericity (χ2=12808.9, df=861, p<0.001), these show that the data are appropriate for conducting EFA.
Based on the Kaiser criterion and Cattell scree plot, different numbers of factors were extracted to find the best alternative model. As a result, a 10-factor solution (all loadings≥0.4024) showed the best model fit to the data after the exclusion of three items (‘Things “fall between the cracks” when transferring patients from one unit to another (F3),’ ‘Our procedures and systems are good at preventing errors from happening (A18)’ and ‘It is often unpleasant to work with staff from other hospital units (F6)’). These three items were excluded based on following criteria: (1) very low item loading (<0.40) on any of the factors or (2) cross-loading. More specifically, the item F6 (originally designed to measure teamwork between units) was found to be problematic, since the results showed that it had a very low loading on the 10-factor structure. Therefore, it was decided to exclude it from further analysis. F3 (originally designed to measure the perceptions regarding hospital handovers) was found to load (>0.40) on the Teamwork across hospital units dimension. In order to examine this part of the structure further, a separate EFA was then conducted with only the eight items of the two scales Teamwork across hospital units and Hospital handovers, and F3 was found to cross-load on both factors. Therefore, it was also excluded. Finally, item A18 (originally designed to measure the overall perceptions of patient safety) appeared to load on the Organisational learning and continuous improvement dimension. Similar to item F3, a separate EFA was performed with only items of the scales Overall perceptions of safety and Organisational learning and continuous improvement dimensions. Results showed that the item (A18) cross-loaded (>0.40) on both of these dimensions.
Final factor solution
The final 10-factor model accounted for 61.7% of the total variance. After excluding these three items from the analysis, the resulting 10-factor solution differed slightly from the original 12-factor structure as follows: the two dimensions Feedback and communication about error and Communication openness appeared as one factor, and both the Staffing and Overall perceptions about safety scales merged as one factor (as had been shown in the English sample13). In addition, two EFAs were conducted separately for each of the two merging scales to explore the factor loadings in detail. Results showed a one-factor solution and thus replicated the merging factors described above. Therefore, a 10-factor structure was deemed to be the optimal alternative measurement solution.
Testing the original (12-factor) and the alternative (10-factor) model
In order to test the model fit of the 12-factor versus 10-factor structures, two separate CFA (using EQS 6.1 for Windows23) were run on the randomly selected validation half of the data set. Two measures of fit were employed: (1) comparative fit index (CFI), with values >0.90 indicating an acceptable fit and >0.95 indicating a good fit25; and (2) the root mean square error approximation (RMSEA), with values <0.05/<0.08 considered as an indication of a good/acceptable model fit to the data.22
First, the original 12-factor model with 42 items was tested (χ2 square=1708.9, df=753), and the fit indices suggested this had an adequate fit (CFI=0.91, RMSEA=0.04) to the data. The standardised factor loadings (see figure 1) were generally large (>0.60)20 and ranged from 0.39 (Staffing) to 0.89 (Frequency of incident reporting). Second, the alternative 10-factor model with 39 items was tested. This 10-factor model (χ2 square=1554.5, df=657) was found to be an acceptable fit to the data (CFI=0.91, RMSEA=0.04). All standardised factor loadings were generally large (>0.60)20 and ranged from 0.35 (Staffing) to 0.89 (Frequency of incident reporting).
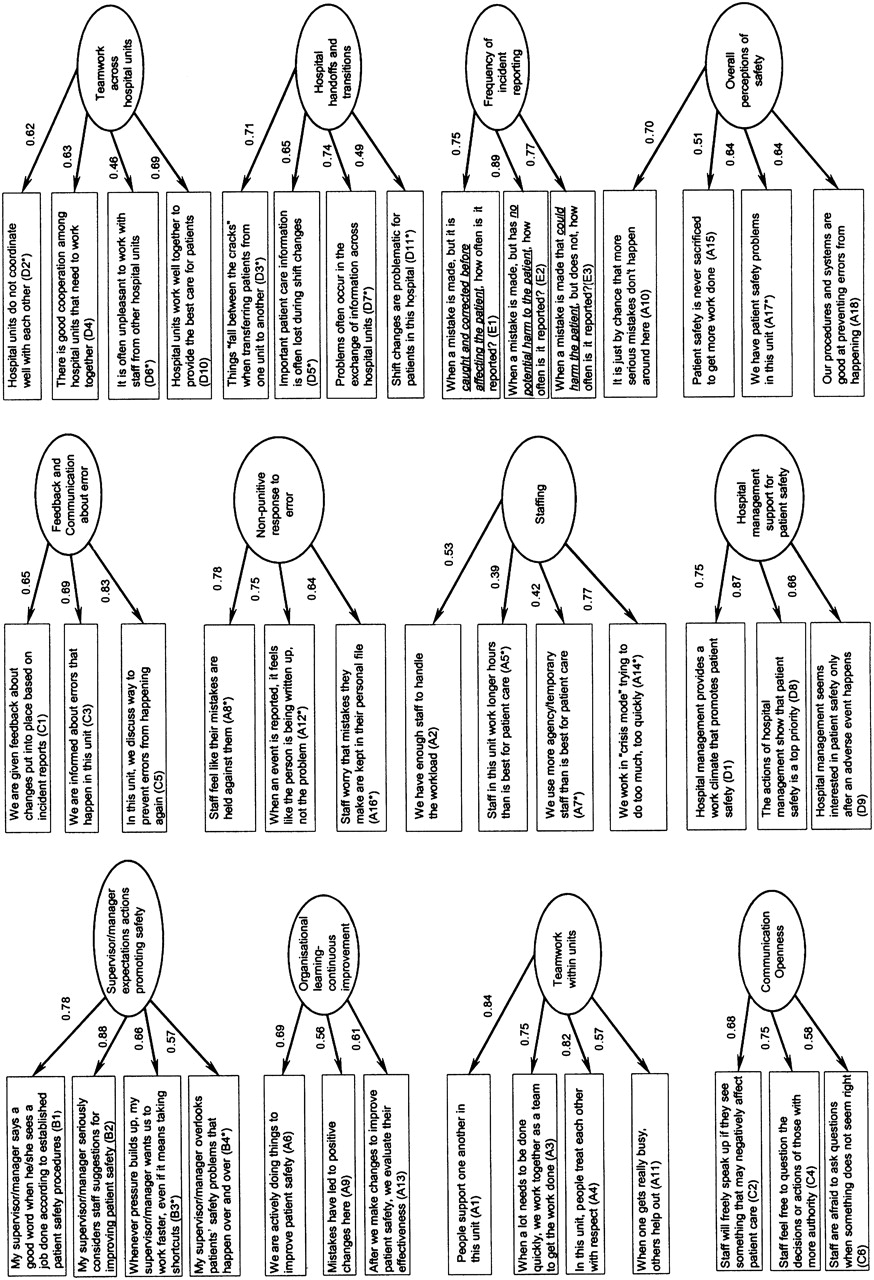
Hospital Survey on Patient Safety Culture original 12-factor model in Scotland and individual item standardised path coefficients. (The items coded with letter “D” are labelled with the letter “F” in the original questionnaire).
Because three items (F3, F6 and A18) had been excluded in the above analysis, an additional CFA was conducted to test a nested 10-factor model with the 42 HSOPSC items in the analysis. The results indicated that the 10-factor model with 42 items (χ2 square=1851.7, df=774) had an acceptable fit (CFI=0.90, RMSEA=0.04). In order to compare the fit of the two nested models, the S–B scaled χ2 square difference test was used.26 The S–B Δ χ2 test27 revealed that the less constrained 12-factor model with 42 items was a significantly better fit than the more constrained 10-factor nested model with 42 items; S–B Δ χ2 (21)=147.60, p<0.001.
Reliability
Internal consistency was calculated for each of the original 12 factors on the whole sample. The Cronbach α scores (see table 3) ranged from 0.64 to 0.84 in which two of the subscales (Organisational learning and continuous improvement; Staffing) received reliability coefficients below 0.70. Therefore, while 10 safety culture dimensions indicated satisfactory internal consistencies,22 two dimensions were found to have lower α scores. Similar findings were also obtained from other European studies and are shown in table 3. Furthermore, while no direct national comparisons can be drawn, for information, mean scores for each HSOPSC scale are presented in table 3.
Cronbach α and mean scores for Scotland (SCT), USA, Netherlands (NL), Norway (NOW), England (ENG) and Belgium (BEL)
In order to test the discriminant validity, correlations were calculated between the 12 safety-culture factors (see online appendix 1). The correlations between Overall perceptions of safety and Staffing (r=0.54, p<0.01), and between Feedback and communication about error and Communication openness (r=0.61, p<0.01) were found to be higher than with other scales, which is not surprising when the merged factors in the 10-factor structure are taken into account. All 10 safety-culture dimensions significantly correlated with three of the four outcome variables, but were less strongly related to the fourth outcome item, Number of incidents reported.
Discussion
This study provided evidence that the original 12-factor structure of the HSOPSC scale has been replicated in this Scottish sample. Although the EFA findings pointed to an alternative 10-factor structure, this deviated only slightly from the 12-factor model. Additionally, the S–B scaled χ2 square difference test results revealed that the original 12-factor model performed significantly better in a Scottish sample. Therefore, it is suggested that no modifications are required to the original 12-factor model, since it fits this data set, and its use in this form would allow researchers the possibility of cross-national comparisons.
The internal consistency of the 12 scales was found to indicate satisfactory results with Cronbach α scores >0.70 with two exceptions: Organisational learning and continuous improvement; Staffing. Similar findings for these scales were reported for the US and European data.12–15 20
Regarding the limitations of the current study, although seven acute hospitals across Scotland were surveyed, the low overall response rate is of concern given the risk of selection bias in that the perceptions of safety culture reported here might not represent the non-respondents. While the rates were comparable with an earlier Scottish survey on reporting culture,28 the timing of the study coincided with the introduction of a major government initiative on patient safety which required various types of data collection, including, in some centres, questionnaires. For future safety-climate surveys of this type, additional effort would be required to ensure a higher level of local support and managerial involvement before data collection commenced. As work unit identifiers were not collected to enhance anonymity, it was not possible to link the responses of the individuals to their specific work areas. For this reason, although safety climate has been demonstrated as a group-level phenomenon,29 and the instrument can distinguish between hospital units,30 31 for the current study, consequent clustering analysis at the unit level could not be conducted.
In addition, the factors tested in the CFA were treated as 12 or 10 correlated latent variables (safety culture), whereas EFA using Varimax rotation treated factors as uncorrelated. We therefore performed additional EFA using oblique rotation, but the resulting factorial structure did not change. Thus, we have reported EFA results using Varimax rotation in line with other European studies, which applied the same technique, to ensure that our results remain comparable with those of the US and European data. However, two factors included in this analysis represented the outcome variables (Overall perceptions of safety and Incident reporting). Therefore, an additional CFA might be needed to test the legitimacy of safety-culture dimensions and outcome variables as two separate higher-order latent constructs. Additionally, as healthcare involves not only risks of harm to the patient but also worker injury,32 one could argue that the effects of safety culture should be examined for patients and healthcare staff separately. The current study is a first step to achieving this goal, and future research will investigate the factor structure of safety culture and outcome dimensions independently and also the effects of safety culture dimensions on worker and patient safety outcomes separately. Finally, it should be noted that although the psychometric properties of the instrument have been tested across nations, to date, it has rarely been related to objective outcome measures, such as actual incident reporting data.33 Such an investigation of safety culture dimensions against an objective measure of patient safety is required to test the predictive validity of the instrument.
Acknowledgments
We would like to thank all the NHS Scotland staff, who gave their time to complete our questionnaire, and S Yule, for his statistical assistance.
References
Supplementary materials
Web Only Data
Files in this Data Supplement:
Footnotes
Funding This research was funded by a Scottish Funding Council Strategic Research Development Grant to the Scottish Patient Safety Research Network.
Competing interests None.
Provenance and peer review Not commissioned; externally peer reviewed.