Article Text

Abstract
Background Countries around the world are currently aiming to improve patient safety by means of the Institute for Healthcare Improvement global trigger tool (GTT), which is considered a valid tool for evaluating and measuring patient safety within organisations. So far, only few data on the measurement properties and utility of the GTT have been published.
Aims To determine and evaluate the effect of interrater variation between review teams on the standard outcome measures of the GTT and to assess and quantify measurement error of the GTT.
Methods Retrospective chart reviews were conducted on identical charts by two independent review teams in 2010 at a department of oncology in a university hospital. Standard GTT outcome measurements were obtained and compared between teams using statistical process control (SPC) charts. A Bland–Altman plot assessed measurement error and limits of agreement.
Results Only 31% of adverse events (AE) were identified by both teams, and further differences in categorisation of identical events was found. Moderate interrater agreement (κ=0.45) between teams gave rise to different conclusions on the patient safety process when monitoring using SPC charts. The Bland–Altman plot suggests little systematic error but large random error.
Conclusions Review teams may identify different AE and reach different conclusions on the safety process when using the GTT on identical charts. Tracking true change in the safety level is difficult due to measurement error of the GTT. The results do not encourage further use of the GTT until additional evaluation studies on the measurement properties of the GTT have been conducted.
- Trigger tools
- Patient safety
- Performance measures
- Adverse events, epidemiology and detection
- Statistical process control
Statistics from Altmetric.com
- Trigger tools
- Patient safety
- Performance measures
- Adverse events, epidemiology and detection
- Statistical process control
Introduction
During the past 12 years, considerable efforts have been made worldwide to improve safety and reduce errors in the treatment of patients in our healthcare systems. However, it still remains unclear whether these efforts have translated into significant improvements in the overall safety of patients. A reason for this could be the lack of robust measures to demonstrate improvement at national, regional and local levels.1 In recognition of this, the Institute for Healthcare Improvement (IHI) developed the global trigger tool (GTT).2 The GTT was developed with the aim of providing a practical tool to detect and monitor adverse events (AE) across the entire spectrum of adult inpatient care. The GTT focuses on detecting AE leading to patient harm caused by medical management rather than the underlying condition of the patient. The IHI describes the GTT as a ‘valid, reliable methodology for harm detection in individual hospitals, which can be used to track rates of harm over time and thereby as a measurement tool when evaluating patient safety within an organisation’.2–4 To our knowledge, the GTT is the only patient safety measurement tool to serve this purpose.
Among the existing methods, the GTT has by far the highest detection rate of AE,5–7 thereby suggesting high sensitivity. As there is no gold standard for detecting AE, the true sensitivity of the GTT remains unknown. Studies also report that different AE are detected by different methods and that no method seems to provide complete detection of AE.6 ,7 Those studies suggest that all the methods, including the GTT, lack in specificity. To obtain complete detection, a combination of different methods has therefore been recommended.6–9
Several countries around the world,10–13 including Denmark,14 are currently aiming to improve patient safety and use the GTT as part of this as a tool presumed valid for evaluating and measuring patient safety within organisations. Some countries have added specific modules directed at different medical areas, such as intensive care,15 surgical care,16 neonatal care17 and oncology.18
Despite the widespread use of the GTT, there are very few published data on the measurement properties and utility of this measurement tool, and these are restricted to assessing interrater agreement between different reviewers on finding triggers and detecting harm. The studies have found moderate interrater agreement between different review nurses3 ,19 and different review teams4 on the identification of AE. All studies concluded that the level of agreement was acceptable and the method therefore reliable.3 ,4 ,19 However, the ability of the GTT to detect change in harm rates over time, that is, the responsiveness of the GTT, within an organisation, has never been evaluated.
In this context, measurement error is the systematic and random error of a patient's score not attributed to true changes in the construct to be measured.20 ,21 To our knowledge, no previous studies have assessed the measurement error of the GTT.21
Therefore, the aim of this study was, first, to determine the interrater reliability between review teams and to evaluate the effect of interrater variation on the standard outcome measures of the GTT and, second, to quantify measurement error, including random and systematic, when different review teams were using the GTT on the same charts.
Methods
Setting
The study was performed at the Department of Oncology, Odense University Hospital, Odense, Denmark. This hospital is part of the Danish tax-funded universal healthcare system. The department provides both outpatient and inpatient care to cancer patients from the Region of Southern Denmark. During 2010, the department had 87 363 outpatient visits and approximately 2800 new patient referrals. The inpatient care units had a total of 11 522 admission days on 3709 single admissions.
Study population
The study cohort comprised oncology patients admitted to the Department of Oncology during the period 1 January to 31 December 2010. Following the IHI white paper guidelines, a 10 chart sample (plus five extra charts in the case of incomplete or unavailable charts) was selected for review in each 14-day consecutive period.2
The evaluation process
The IHI GTT defines an AE as any unintended physical injury resulting from or contributed to by medical care. A translated version of the GTT method22 and an appended oncology module10 was used. According to the method, a brief review of the medical chart, lasting no longer than 20 min, for the presence of ‘triggers’ was conducted by two primary reviewers. On identification of an AE, the level of harm was assessed using the National Coordinating Council for Medication Error Reporting and Prevention (NCC MERP) categories E to I, ranging from ‘temporary harm to the patient requiring intervention’ to ‘harm contributed to death’.23 A secondary review was conducted by a physician on charts containing one or more events, confirming or dismissing the occurrence and category of the event. Data were collected on the number of AE and severity of the events, as well as length of the stay (days), as recommended.2
Selection and training of reviewers
Eight primary reviewers were selected among research nurses employed at the Department of Oncology, Odense University Hospital. All the nurses had several years of experience (median 11 years) with reviewing patient records within the institution as part of their job of working with cancer treatment protocols. One physician reviewer within clinical oncology was selected as a secondary reviewer. All reviewers attended training in accordance with GTT methods. Training comprised a full 2-day course and was provided by experienced staff members from the Centre for Quality, Region of Southern Denmark. Training included orientation and review of standardised training records and site-specific medical records.
Study set-up
Following training, primary reviewers (nurses) were divided into two groups of four, one group using the GTT (team A) and the other using the GTT including the oncology module (team B). All charts were reviewed in sets of 10 charts from each period, but in random order by both groups. The two teams were further divided into groups of two. Each group of two nurses would review half of the charts, but both nurses within the group would review the same charts. In that way, a brief review of each sampled chart was conducted by two groups of two nurses using two different methods, see figure 1. As the GTT oncology module is an appended module, this set-up gave four independent reviews of each chart when using the GTT and two independent reviews when using the GTT including the oncology module.

Flowchart of the review process including measurement endpoint for comparison between review teams. AE, adverse event; GTT, global trigger tool; SPC, statistical process control.
Each review was conducted independently by each of the two nurses in a group. After each individual chart review, the two nurses would present their results to each other and reach agreement on length of stay, number of AE and level of harm. These results were then presented to the secondary reviewer (the physician) who would evaluate any AE presented and the level of harm by reading the chart. All steps of the review process were documented before any discussion of the results. The nurses were also instructed not to discuss any aspects of the study between the teams during the study period. This paper summarises and compares the results obtained using the identical GTT module only. Results compared were the number of AE, category of AE, statistical process control (SPC) charts and the conclusion on the patient safety process.
Analysis and statistics
The IHI recommends that the GTT data are presented and evaluated using SPC charts.2 When evaluating SPC charts, the reader looks for signs of special cause variation (SCV) by using SPC t tests. When using the GTT the SCV tests 1 to 3 are recommended.22 ,24 Test 1 is positive when one or more data points fall outside the upper or lower control limits. Test 2 is positive when eight or more data points fall on the same side of the median. Test 3 requires at least six points consecutively ascending or descending for a statistical trend to be present and the test to be positive.25 SPC charts, presenting data as AE per 1000 admission days (U-chart) and AE per 100 admissions (C-chart), were drawn and tested for SCV using the statistical programs Epidata Analysis (http://www.epidata.dk) and STATA V.2010 (htpp://www.stata.com).
Interrater reliability was assessed using Cohen's kappa statistics,26 a non-parametric test to evaluate the strength of agreement between individual reviewers or pairs of reviewers. The level of agreement was evaluated on the Landis and Koch scale.27 The kappa value was calculated using the results obtained with the GTT module by both review teams. Agreement was defined either as both teams identifying the presence of at least one AE, or agreeing that no AE was present in the chart.
We evaluated the measurement properties of the GTT by using a Bland–Altman plot. The Bland–Altman plot is a method to quantify the measurement error of a measurement instrument on the scale of which it measures. We used the plot to evaluate the extent of agreement between review teams on the outcome measure: AE per 1000 admission days. On the Bland–Altman plot the differences between the pairs of measurements (here the difference between AE per 1000 admission days in each period, teams A vs B) is plotted on the vertical axis against the mean (of AE in each period) of each pair on the horizontal axis. This gives the limits of agreement (LoA) between review teams when measuring using the GTT on identical charts.28 The values within the LoA cannot be distinguished from measurement error, random and systematic, within a 95% CI.21 All calculations were made using the statistical program STATA V.2010.
Results
All chart reviews were conducted retrospectively in the period of February to March 2011. From 3692 eligible patient charts, a total of 240 was selected for review. Nine of the primary randomised charts were unavailable on selection due to participation in protocol reviews. Unavailable charts were substituted with the extra charts in the selected order. A total of 960 single primary chart reviews was conducted, resulting in 480 agreed chart results confirmed by a physician, that is, 240 by review team A and 240 by review team B.
Number and NCC MERP categories of identified AE
Using the GTT, review team A identified 56 physician-confirmed AE on 50 separate admissions corresponding to at least one AE in 21% (95% CI 17% to 25%) of the admissions. Review team B identified 49 physician-confirmed AE on 41 separate admissions corresponding to 17% (95% CI 13% to 22%) of admissions with one or more AE. No significant difference in the total number of AE identified with the GTT was found between teams. Overall, only three suspected AE were not confirmed by the secondary physician review. The distribution of AE on the NCC MERP categories E to I between the review teams is shown in figure 2. The general distribution was almost equal. Review team A had the highest number of identified AE, thus ranging the highest in all categories, except category I in which the teams had similar numbers.
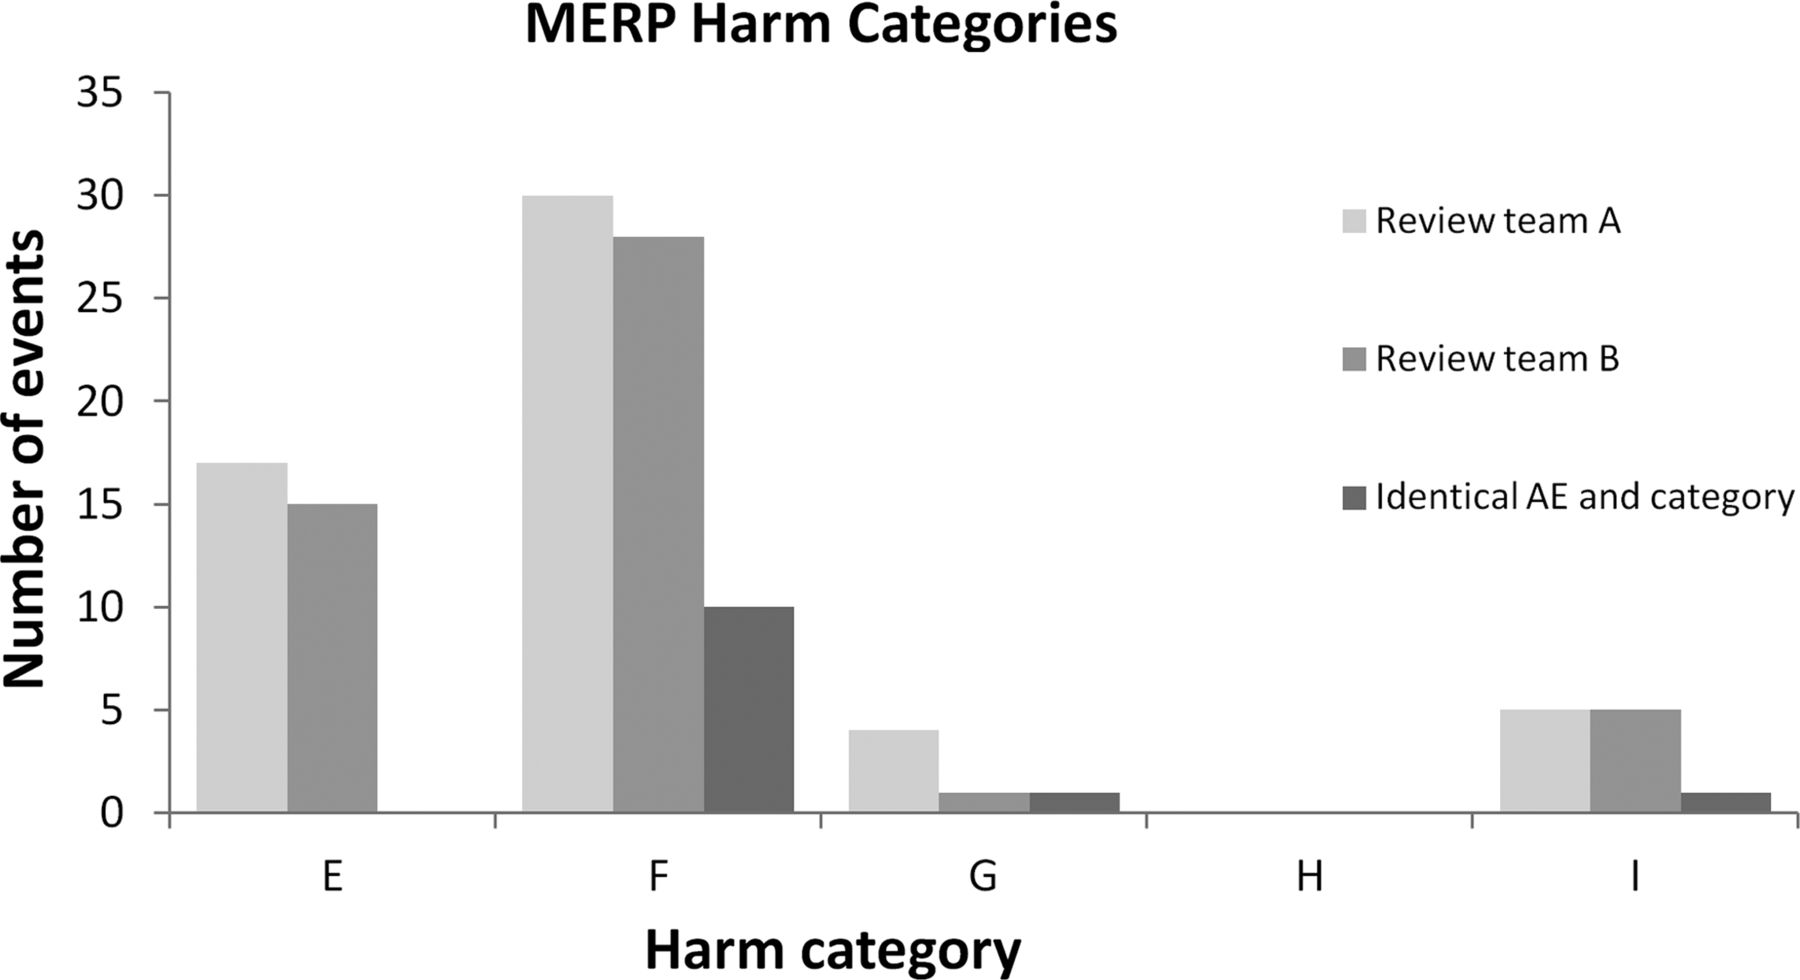
Distribution of identified adverse events on the five National Coordinating Council for Medication Error Reporting and Prevention harm categories.
Further evaluation of all identified and physician-confirmed AE revealed a total of 80 different AE of which only 25 (31%) were identified by both review teams. Thirty-one AE (39%) were identified only by review team A and 24 AE (30%) only by review team B (figure 3). When the 25 AE identified by both review teams were compared with regard to NCC MERP harm category, we found agreement regarding categories in only 13 AE (distributed on 10 category F, one category G and two category I) corresponding to 52% of the common events, a difference of one category in 10 AE (40%), all between the E and F category, and a difference of more than two categories in two (5%) of the identified AE, both disagreement between the G and I category. In no cases did the review team disagree between the temporary harm categories (E, F) and the permanent harm categories (G, H, I).

Venn diagram of distribution of identified adverse events.
Interrater variation between review teams
Interrater agreement was first calculated using kappa statistics on all reviewed charts. Agreement was defined either as both teams identifying the presence of one or more AE, or agreeing that no AE was present in the chart. This gave a percentage of agreement of 83% and (K=0.45, 95% CI 0.30 to 0.52), which corresponds to moderate agreement on the Landis and Kock scale.
Comparison of SPC charts
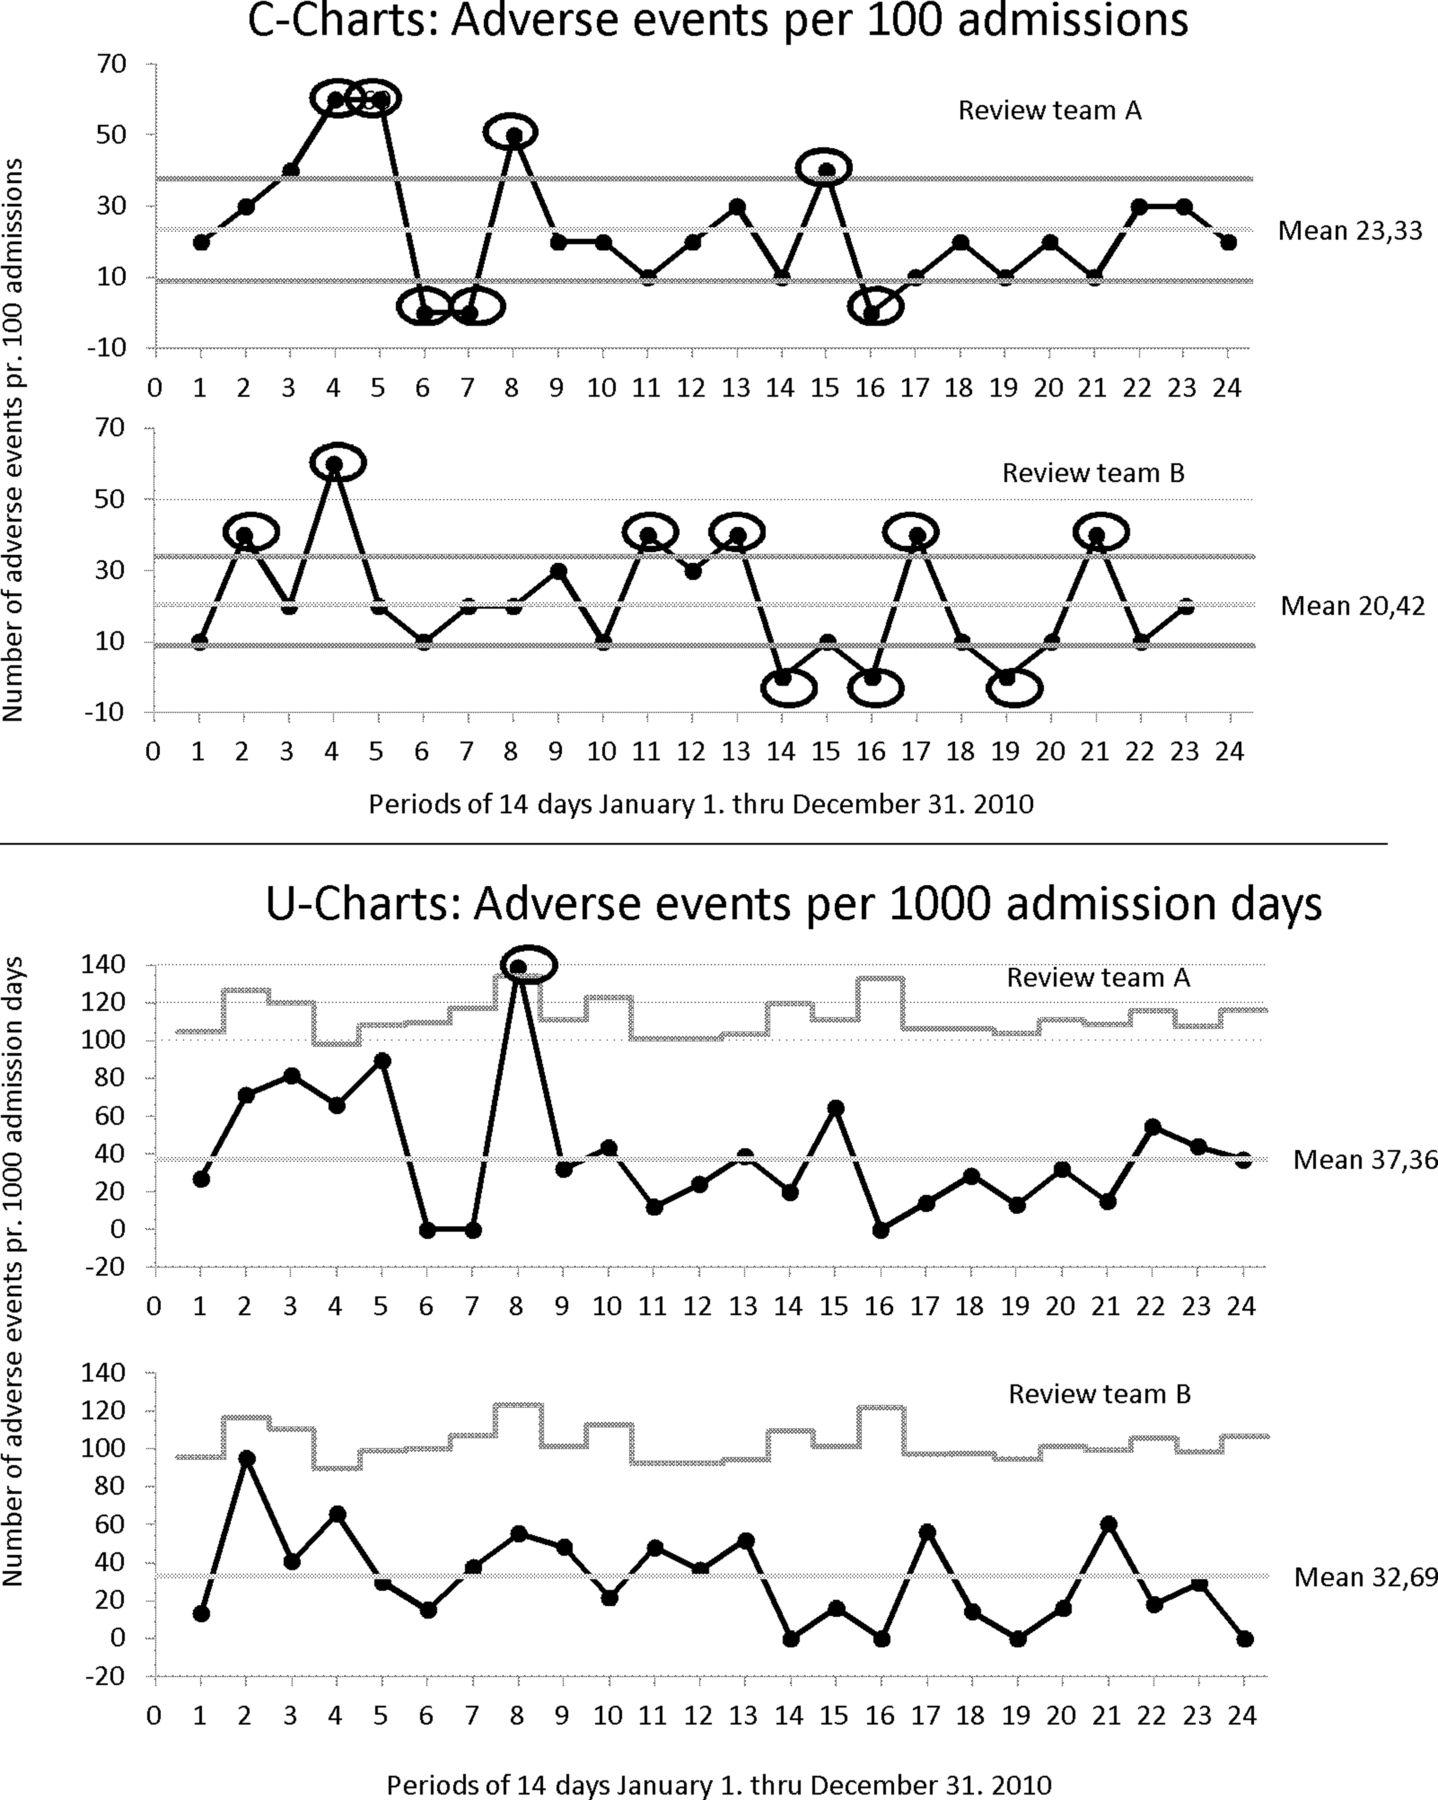
In figure 4, GTT data are shown using SPC displaying harm rates over time by using control charts. SPC charts from both groups displaying AE per 100 admissions (C-chart) and AE per 1000 admission days (U-chart) in the 24 periods of 2010 are shown. The mean level of harm displaying AE per 100 admissions (C-charts): review team A 23.33 AE per 100 admissions; review team B 20.42 AE per 100 admissions. The mean level of harm displaying AE per 1000 admission days: review team A 37.36 AE per 1000 admission days; review team B 32.69 AE per 1000 admission days. As the review teams did not have perfect agreement on the number of identified AE in each period, the C-charts and the U-charts displayed differ substantially between review teams A and B. If the three t tests for SCV are applied, test 1 is positive on the C-chart of both team A and team B (marked with a circle in figure 4). Team A's C-chart has seven periods with signs of SCV and team B's C-chart has nine periods, but only in two periods, that is, periods 4 and 16, do the teams agree on the sign of SCV. Team A's U-chart has one episode with a positive t test 1; period 8 and team B has no positive t test 1 on the U-chart. None of the teams have positive t test 2 or 3 on the charts.

Comparison of statistical process control charts (U and C-charts) between review teams A and B.
Assessment of measurement error using the Bland–Altman plot
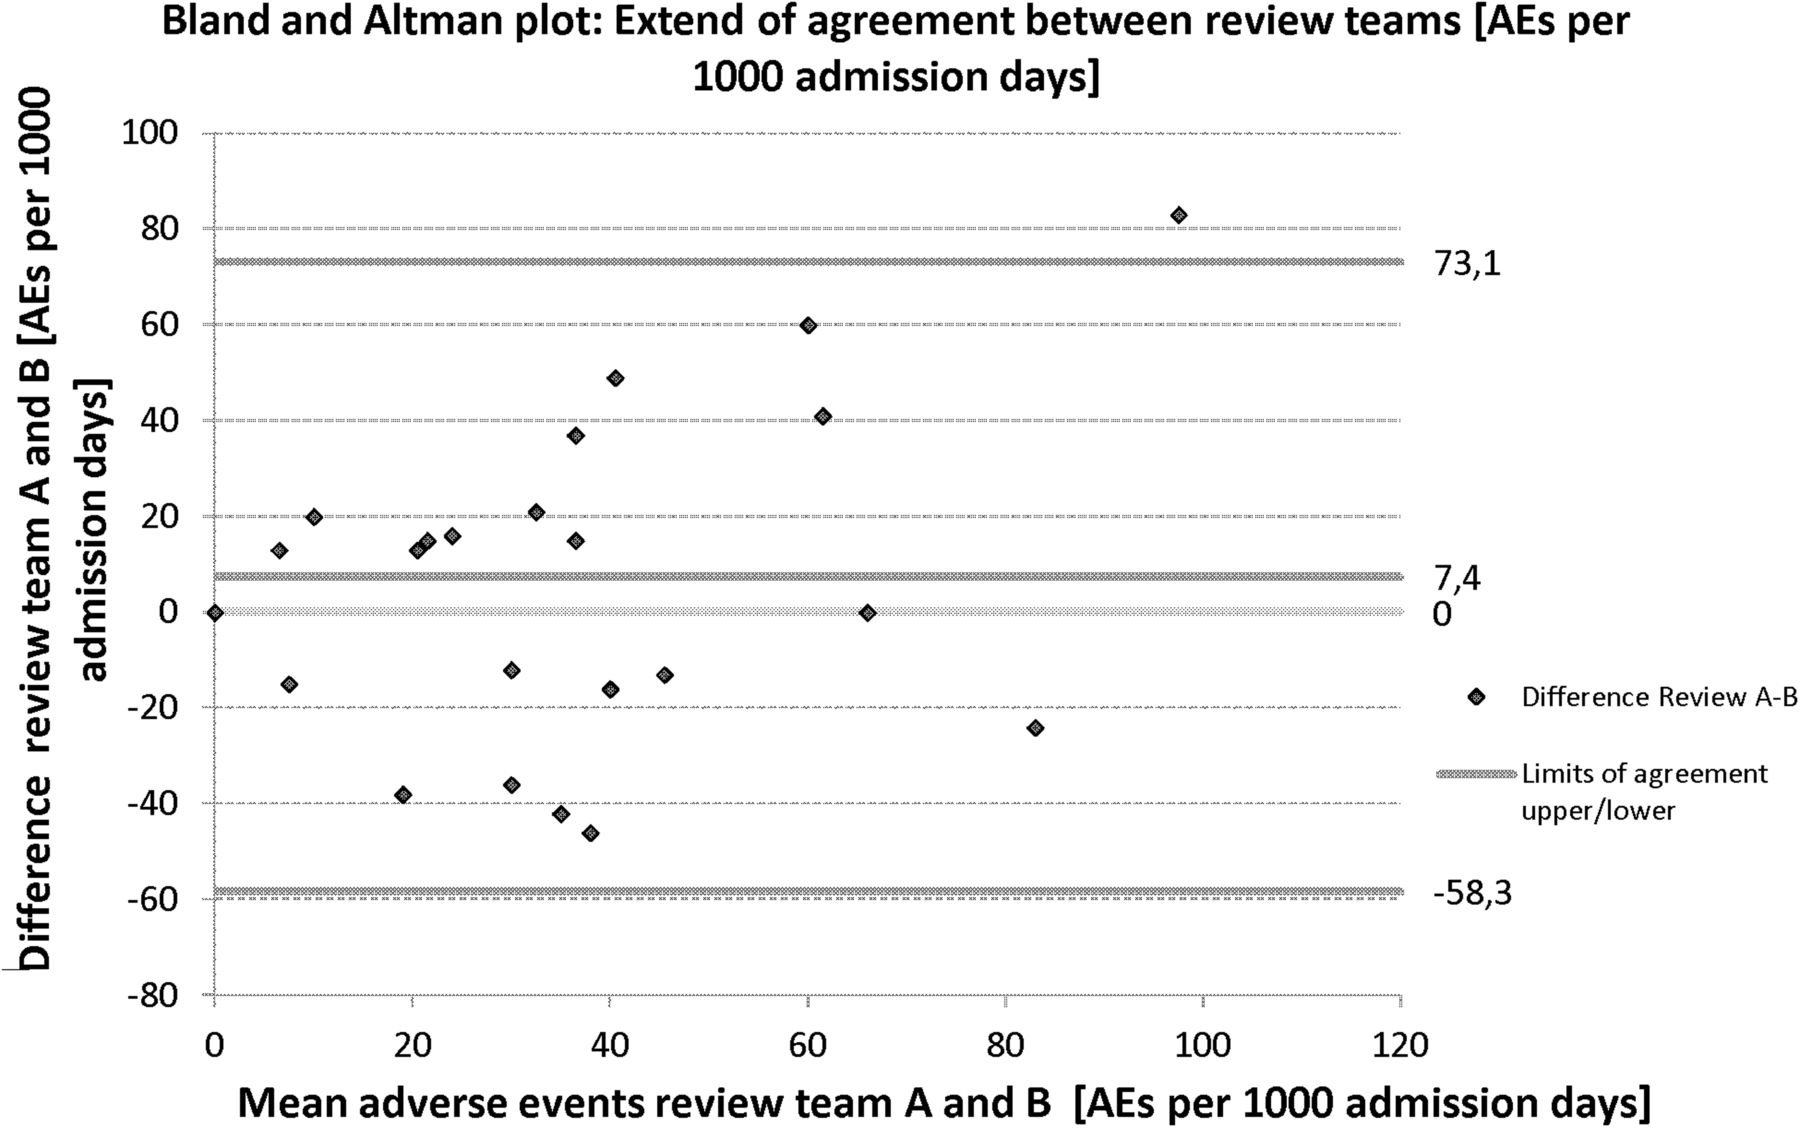
A Bland–Altman plot is seen in figure 5. The differences between the teams on the level of harm are plotted against the mean level of harm in each of the periods. From this, the 95% LoA between review teams A and B are found to be in the range of −58.3 to 73.1 AE per 1000 admission days. The systematic error between review teams A and B is 7.4 AE per 1000 admission days, and thus the random error is ±65.7 AE per 1000 admissions.

Bland–Altman plot evaluating limits of agreement between review teams. AE, adverse event.
Discussion
In this study, the aim was first to determine interrater reliability between review teams and evaluate the effect of this interrater variation on the standard GTT outcome measures and, second, to assess the measurement error of the GTT. This was done by comparing results from two different review teams using the GTT method on the same randomly selected 240 charts.
Number, NCC MERP category and interrater variation between review teams
The total level of harm measured in AE per admission was in this study found to be in good agreement with other studies using the GTT for the identification of AE,4 ,5 ,19 ,29 confirming the high detection rate of the GTT when compared with other methods. We found no statistically significant differences between the two review teams either in the total number of identified AE or in the overall distribution of the identified events. Still, comparison of the AE identified revealed a lack of consistency between the review teams on the specific events identified, with only 25 (31%) of the total AE identified by both teams. Sharek et al4 found that internal reviewers identified higher rates of AE with greater interrater and intrarater reliability than did external reviewers. In our study, the reviewers were internal to the Department of Oncology. Moreover, all reviewers, including the secondary physician reviewer, received identical GTT instruction and training. All events identified by primary reviewers were confirmed by the same secondary physician reviewer. We, therefore, believe that both the selection and the training of reviewers in our study were of a high standard compared to other studies and settings. In other settings, reviewers were internal to the hospital but not affiliated with the specific departments.5 ,19 ,29 Reviewers were trained on different occasions by different staff members or within the review teams,22 and reviewers disagreed on definitions of AE.29 When using the GTT, reviewers are instructed to skim the chart for triggers using the different modules of the GTT in the same order. On identification of a positive trigger, there are no specific instructions as to where specifically to read into the chart. Some triggers are highly specific when documented, and all reviewers would be expected to read the same part of the chart, for example, a positive medication trigger with a specific date of administration. Other triggers are less specific with regard to documentation, for example, pressure ulcers, which may be present and documented at different places in the chart. Also, more than one trigger may point to the same AE, making specific triggers less important in the identification of specific AE. Still, reading into the chart due to different triggers may lead to the identification of other and different AE with no specific trigger. This and the 20-min time limit may explain some of the differences between the review teams found in this study. Within the 25 identical AE, the review teams disagreed on the category in almost half of the cases. Schildmeijer et al29 evaluated agreement on the event level by comparing five different review teams on 50 charts. They found a total of 42 AE, but only three (7%) were identified by all teams, and 29 (69%) by one team only. The authors found a large variation in categorisation on identical AE between the review teams, which is in agreement with our finding of the variation between teams, both with regard to identification and categorisation of AE. Other studies have evaluated the agreement between review teams on the total number of AE alone, and may thus have missed the fact that events may not be identical. Also, categorisation may vary between teams.3 ,4 ,19 The combination of both a low number of identical AE and low agreement on harm category for identical events makes an evaluation of agreement using kappa statistics less meaningful. It is noticeable that there was no agreement in category E events, and a difference in 40% of the identified identical events between categories E and F. This difference reveals difficulties between reviewers both in identifying E events and in determining whether an event should be categorised as E (as resulting in temporary harm and requiring intervention) or as F (as resulting in temporary harm and requiring initial or prolonged hospitalisation). As category E AE are the most common, but also the most difficult to identify and categorise when using the GTT, the reliability of the GTT may increase if such AE were excluded from the GTT, but this would have to be evaluated in future research. When dealing with hospitalised cancer patients, there may be several factors contributing to admission and prolonged stay, some concerning the primary cancer disease and the patient's comorbidity, and others concerning the social status of the patient as well as access to home care. Therefore, deciding on the main cause of initial or prolonged hospitalisation may be difficult and give rise to different interpretations between review teams.
Comparison of SPC charts
When evaluating patient safety using the GTT and SPC, patient safety is evaluated as one process. If we consider the SPC conclusion on the patient safety process to be of most value when evaluating patient safety using the GTT, it could be argued that identification of identical events may not be highly important as long as the conclusion between the teams remains the same. We, therefore, evaluated the possibility that the two review teams reached different SPC conclusions on the patient safety process when using the GTT on identical patient charts. This was done by using the SPC charts (C and U) as recommended by both the IHI and the Region of Southern Denmark, for evaluation of the safety process.2 ,22 As shown in figure 4, the two review teams disagreed when using the tests for SCV. Interpreting the U-charts (AE per 1000 admission days), review team A would, in the eighth period of 2010, have initiated an investigation of the patient safety process due to a positive test 1, whereas review team B, in the same period, would have concluded that the process was stable with no further need for investigation. Both C-charts (AE per 100 admissions) showed unstable patient safety processes, but again, the review teams reached the conclusion based on different periods. Presenting data as a percentage of admissions with an AE (P-chart) is considered less sensitive to the measurement of improvement due to the reduction of data. However, we have evaluated this and found that team A had one positive test 1 in the fourth period. Team B had no periods with positive tests 1 to 3. These results confirm the possibility of two review teams reaching different conclusions on the patient safety process when evaluating safety levels using the GTT on identical charts. This finding supports the conclusion by Schildmeijer et al29 that the GTT should not be used to make comparisons between teams or hospitals, and it raises concern about using multiple reviewers and review teams. The results also show that the choice of SPC chart to evaluate safety is highly important, and the choice of chart may affect the conclusion on the patient safety level, even within the review team.
Measurement error assessed using the Bland–Altman method
We evaluated measurement error of the GTT by using the Bland–Altman plot to assess LoA between our review teams, thereby evaluating the effect of the identified differences between teams in the identification of AE in each sample on the measurement properties of the GTT. If we accept moderate agreement, we also accept LoA between review teams from −58.3 to 73.1 AE per 1000 admission days. When evaluating using kappa statistics, between review teams using the GTT on identical charts, the systematic error between the teams was limited to 7.4 AE per 1000 admission days. This means that values of ±65.7 AE cannot be distinguished from random error within 95% CI. The mean values of AE rates in this study of 37.4 and 32.7 AE per 1000 admission days lay within the range of the measurement error of the GTT, making changes within this range impossible to distinguish from normal variation before they exceeded the ±65.7 limit for detection of true change. Our study shows that, if we accept moderate agreement between reviewers, as suggested in previous studies,3–5 the ability to detect change in harm rates, that is, the responsiveness of the GTT, is poor. Landrigan et al5 conducted a large 5-year study and used the GTT to review 2341 admissions in an attempt to track changes in rates of harm. They concluded that patient harm remained common, but they also suggested the possibility that the GTT failed to capture an actual change. Our study is the first to report on and quantify the measurement error of the GTT. Our findings support the hypothesis that an actual change in rates of harm may be impossible to detect by the GTT if interrater agreement remains moderate.
Limitations
Our study was retrospective and used only records from a single department of oncology. Therefore, results may not be completely representative of other hospital departments. However, as interrater agreement in our study is consistent with previous studies, we have no reason to believe that the patient status as an oncology patient should have an impact on the reliability of the GTT. Similar results from Schildmeijer et al29 furthermore suggest that problems with the lack of consistency between review teams in the identification and categorisation of AE are similar at hospital level and across departments. The second physician reviewer was used by both review teams to increase comparability and may have been biased towards higher agreement. Still, only in three cases did the secondary reviewer not confirm an identified AE. As reviewers had no previous experience with the GTT, there may have been a learning curve towards higher rates of AE. Chart reviews were conducted in random order and results are presented with regard to period and not chart review order. We, therefore, tested this by drawing SPC charts of the results in the order of the chart reviews, and no sign of a learning curve was observed. Review team B also focused on the additional oncology module and, even though results from this module have been excluded in this study, it could be argued that, using the extra oncology module may have taken both time and focus away from the GTT, resulting in the non-significant lower mean of AE per 1000 admission days and AE per 100 admissions. If this was the case, SPC charts in figure 2 from review teams A and B would be expected to show parallel curves, which was not the case.
Conclusions
We used the GTT method, as devised by the IHI, on identical, randomly selected charts from oncology inpatients, and found that different review teams identified different AE. Even when identical events were identified by different review teams, categorisation in the NCC MERP harm categories varied. Variation between review teams in identification and categorisation of AE resulted in different conclusions on the patient safety process. Moreover, calculations of measurement error of the GTT showed that mean values of harm rates were within the measurement error of the GTT, making change in harm rates almost impossible to track, unless rates doubled.
Measuring, monitoring and evaluating patient safety using the GTT may lead to the identification of different AE and variation in categorisation, different conclusions on the SPC patient safety process, and difficulties in tracking true changes in the patient safety process due to the measurement error of the GTT. Using the GTT may, therefore, lead to unnecessary and costly evaluation processes within the organisation studied.
We therefore propose that further evaluation studies on the measurement properties of the GTT method are carried out before further use of the tool to measure and track changes in patient safety level.
Acknowledgments
The authors would like to thank the staff from the Centre for Quality, Region of Southern Denmark for their support and training of the reviewers and the review teams for their efforts.
References
Footnotes
-
Contributors TOM, JLK, KB and JH designed the study. TOM collected the data. TOM analysed the data and JL approved and provided advice on the data analysis. All authors contributed to the interpretation of data. TOM drafted the manuscript. JKL, JL, KB and JH participated in the revision of the manuscript. All authors have read and approved the final manuscript.
-
Funding This work was strictly financially supported by Odense University Hospital, University of Southern Denmark, Danish Cancer Society and the EU InterReg program.
-
Competing interests None.
-
Provenance and peer review Not commissioned; externally peer reviewed.
-
Data sharing statement Data available on request from the corresponding author.