Article Text

Abstract
Objectives To examine how much of the variation between general practices in referral rates and cancer detection rates is attributable to local health services rather than the practices or their populations.
Design Ecological analysis of national data on fast-track referrals for suspected cancer from general practices. Data were analysed at the levels of general practice, primary care organisation (Clinical Commissioning Group) and secondary care provider (Acute Hospital Trust) level. Analysis of variation in detection rate was by multilevel linear and Poisson regression.
Setting 6379 group practices with data relating to more than 50 cancer cases diagnosed over the 5 years from 2013 to 2017.
Outcomes Proportion of observed variation attributable to primary and secondary care organisations in standardised fast-track referral rate and in cancer detection rate before and after adjustment for practice characteristics.
Results Primary care organisation accounted for 21% of the variation between general practices in the standardised fast-track referral rate and 42% of the unadjusted variation in cancer detection rate. After adjusting for standardised fast-track referral rate, primary care organisation accounted for 31% of the variation in cancer detection rate (compared with 18% accounted for by practice characteristics). In areas where a hospital trust was the main provider for multiple primary care organisations, hospital trusts accounted for the majority of the variation attributable to local health services (between 63% and 69%).
Conclusion This is the first large-scale finding that a substantial proportion of the variation between general practitioner practices in referrals is attributable to their local healthcare systems. Efforts to reduce variation need to focus not just on individual practices but on local diagnostic service provision and culture at the interface of primary and secondary care.
- Cancer
- General Practice
- Primary Care
- Referral
- Variation
- Multi-level modelling
Statistics from Altmetric.com
Introduction
Ensuring that patients with symptoms of possible cancer have access to prompt diagnostic tests and treatment is a key concern for healthcare systems.1 2 Variation between providers in referral or access to such services is thus an important performance issue.3–5 In the UK and Europe, particular attention has been drawn to variation in referral from primary to secondary care for patients with clinical features possibly indicative of cancer.4 6–8 This observed variation, particularly the proportion of patients with cancer who have been referred through a fast-track pathway, has been portrayed as unacceptably large.3 9
The route from a patient experiencing symptoms to a specialist cancer diagnosis involves several steps before, during and after primary care.1 Variation in referral may arise at these different stages and may be either systematic10 or random.11 It may arise at patient or population level; within general practices; and at the level of larger organisations such as primary care organisations and secondary care providers of diagnostic services for cancer.12 Potential sources of systematic variation include patient and population demographics and environmental exposures,13 accessibility to and quality of primary care3 and variation in the capacity and local policies of secondary care services.4 Common reasons for apparent random variation include the heterogeneity of cancer presentations14 and small numbers of cases at practice level.11 15 These are summarised in table 1.
Systematic and random sources of variation in GP referrals for suspected cancer
We have previously demonstrated that the variation in general practitioner (GP) urgent referrals for suspected cancer can be considered from the perspective of referral decision accuracy in terms of sensitivity and specificity.16 From this perspective, sensitivity (referred to in UK national statistics as ‘cancer detection rate’) equates to the proportion of cancers that are diagnosed via the fast-track pathway, and specificity is related to the number of patients referred by the fast-track pathway who did not have cancer. We previously found that there was more variation between practices in specificity than in sensitivity for a given specificity, and interpret this as indicating that practices vary more in referral threshold (referring more or less patients), than in referral decision accuracy (referring the ‘right’ patients at a given referral threshold).16
In this study, we aimed to examine how much variation in the number of fast-track suspected cancer referrals that GP practices made, and in the cancer detection rate from these referrals, could be accounted for by local health services above the level of the general practice (primary care organisations and diagnostic service providers).
Methods
We conducted an analysis of publicly available data. The data contained no individual patient information and no ethical permissions were needed.
Data sources
We obtained data from the Public Health England Fingertips database,17 which holds extensive data, at GP practice level, about fast-track referrals for suspected cancer. These are widely referred to as 2-week wait (2WW) referrals. We extracted and aggregated data for five consecutive years between 2012 and 2017. Data were available for general practices (groups of between 2 and 30 GPs) rather than individual physicians.
Selection of variables for analysis
We extracted the total number of 2WW referrals; total number of cancer diagnoses; and the number of cancers diagnosed after 2WW referral (as opposed to other pathways). For each practice, we also extracted the age-standardised 2WW referral rate; the proportion of patients aged over 65; and the practice’s index of multiple deprivation (a measure of socioeconomic status of the registered patients).
For this study, we considered two approaches to account for different referral thresholds. The first was to use the standardised 2WW referral rate. This represents a value for each practice, based on the crude 2WW referral rate adjusted for practice deprivation and proportion of patients aged over 65 years and centred on a value of 100. This standardised rate is approximately normally distributed. The second was to use an estimated specificity for each practice using the definition of specificity from the contingency table of a diagnostic accuracy study as true negatives divided by (true negatives+false positives) . As in this instance true negatives represent patients without cancer but whose clinical presentation may have indicated cancer, we could not measure this directly. Instead we estimated a total population at risk of cancer in the practice by dividing the number of cancer cases by 3% (as this represents the probability of a cancer diagnosis with symptoms that are sufficient to trigger a 2WW referral). This was calculated using our previously published method.16 Standardised 2WW referral rate and specificity were strongly correlated (Spearman’s rho=0.74). For the primary analysis of detection rate, we used the standardised 2WW referral rate because: (A) it is simpler to understand; (B) it is provided in the data rather than estimated so makes for easier replication and (C) it is already adjusted for practice population demographics of age and deprivation.
Inclusion/exclusion of GP practices’ data
We have previously demonstrated that variation in detection rate is particularly susceptible to error when there are less than 50 cancer cases per GP practice.15 We thus set a minimum criterion for eligibility for the primary analysis of at least 50 cases of cancer diagnosed over the 5-year period. We tested this assumption in a sensitivity analysis using different cut-offs for minimum number of cancers. We excluded a small number of practices that served predominantly student populations (identified by a very low proportion of patients aged over 65 years) as we found that because of the very low incidence of cancer and 2WW referrals the algorithm for calculating specificity returned impossible values (>1). We also excluded practices from one CCG because data were only available for less than one quarter of practices in this particular CCG.
Allocation of practices to primary care organisations and diagnostic services
The downloaded data linked each practice to a Clinical Commissioning Group (CCG). CCGs are primary care organisations responsible for commissioning both the delivery of primary care services in a geographical area and the commissioning of specialist services for practices in their area. CCGs varied in size between 5 and 108 practices and a population of between 74 000 and 894 000 patients.
We also linked CCGs to Acute Hospital Trusts (AHTs), which act as referral and diagnostic service providers for CCGs. AHTs comprise one or more hospitals within a geographical area with populations that are typically similar to or larger than those of CCGs. There are fewer AHTs than CCGs in England (127 and 207, respectively). We mapped CCGs to AHTs, recognising that CCGs commonly commission services from more than one AHT. Typically, this is because some practices at the CCG boundary are closer to another AHT. In mapping CCG to AHT, we used the criteria for mapping listed in online supplementary table 1. Where the mapping was either single CCG to single AHT or multiple CCG to single AHT, we allocated each CCG to the relevant AHT. Where there were multiple possible AHT:CCG mappings, we used information on AHT and CCG websites to identify AHTs that held the largest reported contract from a CCG or where there was other evidence including a particular relationship.
Supplemental material
Analysis of variation between practices and CCGs
We examined the variation between practices graphically and by creating multilevel regression models. In both approaches, we first examined all included practices in a two-level model (practices in CCGs) and then examined practices where there were multiple CCGs per AHT in a three-level model (practices in CCG in AHT).
For the plots of standardised 2WW referral rate and detection rate, we ordered CCGs (or AHTs) by median value of the relevant variable. For the two-level analysis, we created box plots for each CCG that were ordered by median value. For the three-level analysis we plotted a single point for each CCG representing the median value of the variable; points were grouped by AHT.
Statistical analysis used multilevel linear regression for standardised 2WW referral rate and multilevel poisson regression for detection rate. For standardised 2WW referral rate, we used a simple model in which the only predictor was the clustering variable. For the primary analysis of detection rate, we used both the simple model and a model including standardised 2WW referral rate as an independent variable. As initial plotting of data suggested a non-linear relationship between detection rate and standardised 2WW referral rate, we also included a quadratic term. For the secondary analysis of detection rate, we used specificity and practice demographics as independent variables. As the distributions of both referral rate and detection appeared unimodal and approximately symmetrical, we compared the appropriateness of linear and non-linear (poisson and logistic) regression models by inspecting standardised residuals. For the final analysis, we selected the regression models with residuals best approximating to a normal distribution (linear regression for referral rate and poisson for detection rate).
We analysed clustering at CCG level for all practices and at CCG and AHT for practices where more than one CCG was linked to the same AHT. We conducted two sensitivity analyses: first we repeated the three-level analysis after excluding CCGs, which mapped to multiple AHTs (ie, those in central London and Newcastle), and second, we examined the effect of different inclusion thresholds of numbers of cases per practice over the 5 years.
For each model, we reported two measures of the amount of variance attributable to the clustering variable: R2 and the intraclass correlation coefficient (ICC). R2 is widely used as an indicator of the proportion of total variance, which can be explained by a statistical model. In the context of a multilevel model, it can be used to partition variance into that explained by fixed effects (of covariates across all units) and random effects (arising from the clusters). We used the formulae for R2 in linear mixed effects models by Nakagawa and Schielzeth18 modified by Johnson.19 ICC is broadly similar in purpose, in that it also describes the proportion of variance that can be attributed to clustering in the data. It has the advantage that in a three-level model, it can be split between the different levels. Thus, ICC and R2 provide similar but complementary information.
Analysis was conducted in R3.6 with the lme4 package for linear mixed effects models using Restricted Maximal Likelihood fitting. We obtained the ICC using the sjstats package and R2 using the MuMIn packages within R. We used the Aikake information criterion in order to compare models.
Results
The downloaded data included information from 7219 practices with a combined total population in 2015 of 54.7 million patients. We excluded data from 830 practices with less than 50 cancer diagnoses, 4 practices in which the proportion of patients aged 65 years or over was <2% and 6 practices from one CCG in which more than two-thirds of practices had missing data. This left 6379 practices (88.4%) with a combined population in 2015 of 51.6 million patients (94.3%). The distribution of small (excluded) practices was uneven across CCGs: in one case, this left only five practices remaining in the CCG cluster for analysis. Of the 206 CCGs and 127 AHTs, 71 CCGs and trusts mapped one to one, leaving 135 CCGs and 56 trusts with more complex mappings. These complex-mapped CCGs included 3558 of the included practices (55.8%) with a combined population in 2015 of 29.0 million patients (56.2%).
The characteristics of the total population, the sample analysed for CCG clustering and the sample with clustering by CCG and AHTs are shown in table 2. The distributions of standardised 2WW referral rate, detection rate and specificity unimodal and only mildly skewed. For practices with a minimum of 50 cancers, the minimum and maximum values for detection rate were 0.12 and 0.73, respectively. Only 2/6379 practices had values for detection rate of less than 0.2 (both of these had between 50 and 100 cancers). Mean detection rate was 0.48 (SD 0.073). For the practices with a minimum of 50 cancers, the mean standardised 2-week referral rate was 99.3 (originally centred at 100) with a SD of 28.9.
Characteristics of included data
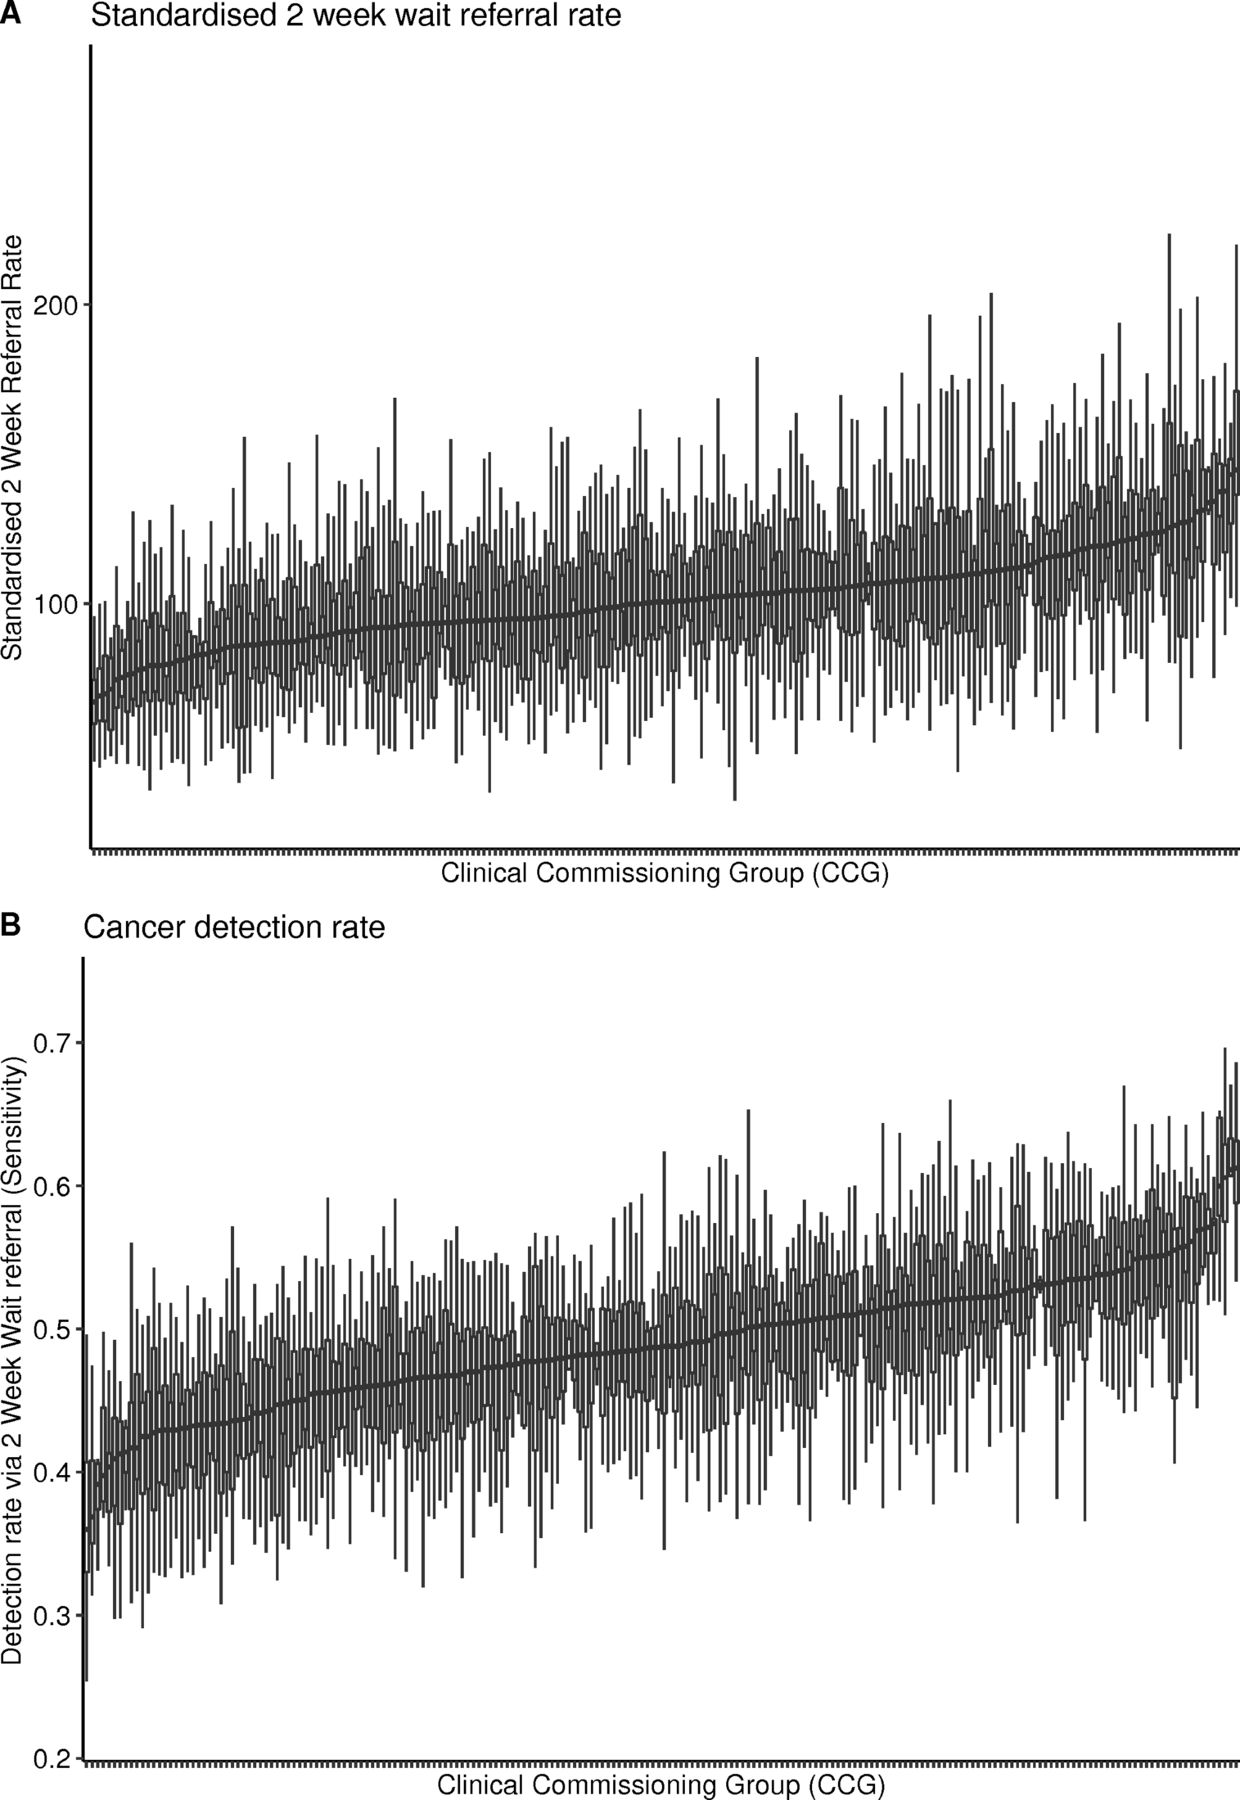
Figure 1 shows the distribution within CCGs of practice values for: (A) standardised 2WW referral rate and (B) detection rate. Box plots each represent one CCG and they are ordered by median value; outlying points have been excluded for clarity.

Distribution of indicators of GP practice fast-track referrals for suspected cancer grouped by CCG. CCG, Clinical Commissioning Group; GP, general practitioner.
Table 3 contains the results of the two-level regression models of practices in CCGs. The columns relating to R2 include the total R2, the amount attributable to fixed effects (practice level characteristics) and the amount attributable to random effects (clustering within CCGs). Adding covariates to the primary model for detection rate increased the overall R2, while reducing the random effects R2 and ICC, however these remained very substantial at 0.31 and 0.37, respectively. This indicates that around one third of the variation between practices in detection rate (after adjusting for standardised 2WW referral rate) is attributable to clustering within their CCG.
Attributed variation within multilevel models of practices nested within CCGs
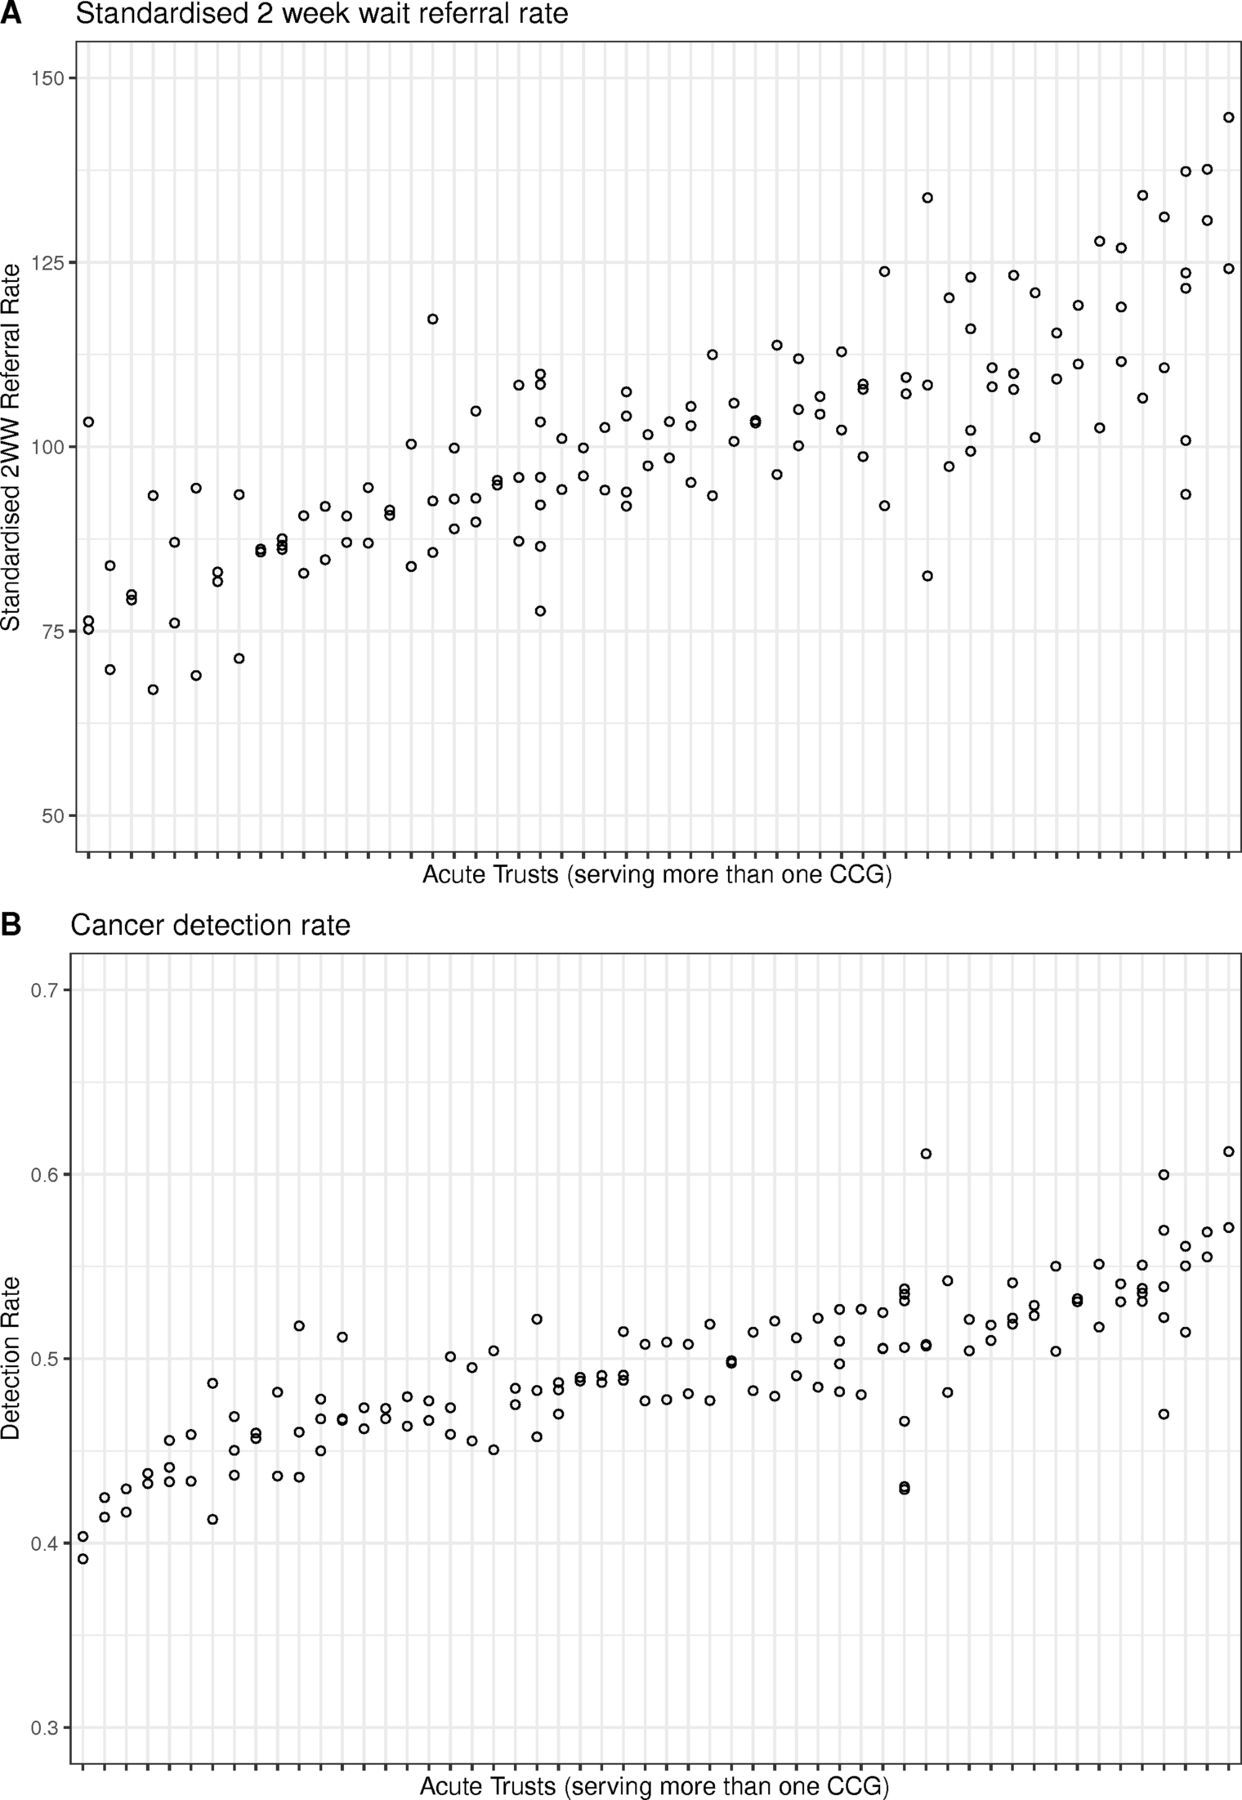
Figure 2 shows the relationship between CCG level results and AHTs in the subset of data from practices linked to AHTs that have multiple CCGs. The plots show the median values for each CCGs of: (A) practice standardised 2WW referral rate and (B) practice detection rate. In these plots, AHTs are ordered by median value.
Distribution of median indicators of GP fast-track referrals per CCG grouped by Acute Hospital Trust. 2WW, 2-week wait; CCG, Clinical Commissioning Group; GP, general practitioner.
Table 4 contains the results of the three-level regression models of practices in CCGs in AHTs. The columns relating to subsets of R2 shown in table 3 have been omitted for clarity, and the columns for ICC have been expanded to include the total ICC, its partition between CCG and AHT and the proportion of total ICC attributable to AHT. The total R2 and ICC values are slightly lower than in table 3, reflecting that table 4 comes from only a subset of the data in table 3. However, they remain substantial, with total ICC between 0.34 and 0.39 in the primary analysis. The right-hand columns of table 4 confirm the visual impression from figure 2 that AHTs account for a substantial proportion of the observed clustering effects. For the primary analysis model, AHTs account for between 66% and 69% of the total ICC.
Attributed variation within multilevel models of practices nested within CCGs within Acute Hospital Trusts
The sensitivity analysis that excluded CCGs mapped to multiple AHTs showed similar results to the main analysis (online supplementary table 2). online supplementary table 3 shows the effect of setting different thresholds for the number of included practices on the clustering for both standardised 2-week referral rate and detection rate (with and without adjustment). As the threshold increases, the ICC and the R2 attributable to the CCG increases indicating that the effect of clustering by CCG increases as ‘noise’ from small practices is removed.
Discussion
Summary of main findings
This study shows that variation between GP practices in cancer referral within the same national health system is substantially associated with their local commissioning and specialist diagnostic services. Diagnostic service providers account for a greater proportion of this variation than primary care commissioning organisations.
Strengths and limitations
This study extends published research investigating the accuracy of cancer referrals11 14–16 in terms of detection rate adjusted for referral rate. We have not identified any previous studies that have used multilevel regression to examine clustering of referral practice for possible cancer. A large current national dataset was used with high standards of data quality. Our selection of a 5-year data period, a threshold of 50 cancers and the use of process measures rather than clinical outcomes reflects our previous published work and that of others.11 15 16
There are a number of limitations to our analysis. First, the lowest level of analysis was GP practice: this meant that meaningful patient level data were absent (eg, cancer type)14 or included in summary form only (eg, proportion of population aged 65 or over). Thus, we can only comment on the variation between practices, not on the factors that affect individual patients. While this is not ideal, these are the data on which practice performance is monitored and so it is appropriate to examine it. Second, we did not include other covariates relating to practice characteristics that have been reported recently and relate both to the population served7 and the way the practice meets the population needs.8 However, these had modest effects on the two outcome measures we included in our analysis, and none of these seems particularly likely to explain the clustering that we observed in the data. Third, we had to aggregate data from several consecutive years rather than using a single set of multiyear data; this may have introduced some error due to incomplete coding.20 Our analysis may also have obscured temporal trends; however, as changes to guidelines were introduced nationally during this time, there is no strong reason why these should influence local clustering effects.2 Fourth, we were only able to examine aggregate performance of practices, not of individual practitioners. This was neither possible from the data, nor feasible because of the small numbers of cases per practice. Variation has been shown to occur at both the level of the clinician and the practice.21
While mapping of practices to CCGs was robust, mapping of CCGs to AHTs is more challenging in some areas and may have introduced error. We used multiple steps to optimise these mappings (online supplementary table 1) and carried out a sensitivity analysis excluding CCGs where there was uncertainty, which showed little effect on the results. While we demonstrate local clustering effects at the level of AHT where there are multiple CCGs linked to one AHT, this ecological study cannot demonstrate the directions of causal influence (whether AHTs influence CCGs or vice versa) nor can it exclude additional clustering levels (such as practice neighbourhoods or networks).
Relationship to other research
A recent UK study of variation in process and outcomes of care between specialists clustered within hospitals showed that doctor variation exceeded hospital variation,22 but clustering effects were small (most ICCs between 0.005 and 0.05) in contrast to those seen in our study (0.21–0.37). Two studies from Italy found that postdischarge care for cardiac23 and respiratory24 disease showed greater variation due to hospital than primary care practitioner, but this may not be surprising as one would expect treatment to be dictated by the hospital and followed by the GPs. A further study examining primary care antibiotic prescribing demonstrated variation attributable to region.25
Analyses at practice level have indicated that lower fast-track referral rates were associated with poorer 1 year cancer survival4 and that lower endoscopy referral rates are associated with lower rates of curative surgery for upper gastrointestinal surgery.26 Meanwhile analysis at regional level has recently demonstrated substantial variation in aggressive treatment for lung cancer is associated with differences in survival.27
Meaning of the study
Our data indicate a pressing need to extend the focus on variation beyond the GP consulting room and into the wider health services. While the majority of variation between practices remains unexplained, the extent of variation at the level of primary care organisation and secondary care provider suggests that GPs in different areas are effectively referring into different systems that are performing differently. Until this is better understood, there needs to be caution about publishing national GP benchmarking figures that may be highly dependent on wider services and circumstances.
Unanswered questions
This higher level variation requires further exploration. From the current data, we are not able to establish how much the observed differences are due to capacity within diagnostic and specialist services, to ways in which referral criteria are applied locally or to other cultural factors. The finding that clustering of detection rate is greater than clustering of referral rate suggests that capacity in secondary care is not the only factor. While adjusting for referral rate reduced the observed clustering of detection rate (from ICC of 0.42 to 0.37), this remained very substantial. Further research should consider combining analysis of routine data with in-depth approaches such as ethnography.
Conclusion
Sources of primary care practice variation appear to extend beyond the practice boundaries. Efforts to reduce variation in suspected cancer referrals need to focus not just on individual practices but on local diagnostic and specialist service provision and culture.
References
Footnotes
Contributors CB and PM conceived and designed the study; CB, LO and PO conducted the analysis. CB drafted the manuscript and PM and PO critiqued the paper for important intellectual content.
Funding The authors have not declared a specific grant for this research from any funding agency in the public, commercial or not-for-profit sectors.
Competing interests None declared.
Patient consent for publication Not required.
Provenance and peer review Not commissioned; externally peer reviewed.
Data availability statement Data are available in a public, open access repository.